Tải trọng sóng tác dụng lên công trình biển
Bạn đang xem bản rút gọn của tài liệu. Xem và tải ngay bản đầy đủ của tài liệu tại đây (6.59 MB, 46 trang )
Seediscussions,stats,andauthorprofilesforthispublicationat: />
WaveImpactLoads-PressuresAndForces
Article·February2001
Source:CiteSeer
CITATIONS
READS
4
3,049
8authors,including:
WilliamAllsop
MarioCalabrese
HRWallingford
UniversityofNaplesFedericoII
162PUBLICATIONS1,060CITATIONS
55PUBLICATIONS278CITATIONS
SEEPROFILE
SEEPROFILE
DiegoVicinanza
UniversitàdegliStudidellaCampania"Luigi…
153PUBLICATIONS945CITATIONS
SEEPROFILE
Someoftheauthorsofthispublicationarealsoworkingontheserelatedprojects:
Waveovertoppingperformanceofsteeplow-crestedstructuresViewproject
CFDMODELINGOFWAVELOADINGSONWAVEENERGYCONVERTERSViewproject
AllcontentfollowingthispagewasuploadedbyDiegoVicinanzaon06February2013.
Theuserhasrequestedenhancementofthedownloadedfile.
CHAPTER 5.1: WAVE IMPACT LOADS
- PRESSURES AND FORCES A. KORTENHAUS1); H. OUMERACI1); N.W.H. ALLSOP2); K.J. MCCONNELL2);
P.H.A.J.M. VAN GELDER3); P.J. HEWSON4); M.WALKDEN4); G. MÜLLER5);
M. CALABRESE6); D. VICINANZA6)
1)
Leichtweiß-Institut, Technical University of Braunschweig, Beethovenstr. 51a, DE-38106
Braunschweig, Germany
2)
HR Wallingford, Howbery Park, GB-Wallingford OX10 8BA, U.K.
3)
Delft University of Technology, Faculty of Civil Engineering, Stevinweg 1, NL-2628 CN
Delft, The Netherlands
4)
University of Plymouth, School of Civil and Structural Engineering, Palace Street, GB-Plymouth PL1 2DE, U.K.
5)
Queens University of Belfast, Department of Civil Engineering, Stranmills Road, GB-Belfast BT7 1NN, Northern Ireland
6)
Università degli Studi di Napoli 'Frederico II', Dipartimento di Idraulica, Via Claudio n. 21,
IT-80125 Naples, Italy
ABSTRACT
The tentative procedures for both impact and uplift loading proposed by Oumeraci and
Kortenhaus (1997) have been brought together and amended by many partners in PROVERBS. This paper proposes a procedure to calculate time-dependent pressures, forces and lever arms of the forces on the front face and the bottom of a vertical breakwater. For this purpose, (i) the data sets on which this method is based are briefly described or referred to; and
(ii) a stepwise procedure is introduced to calculate the wave loading supported by some background and data information. Suggestions for estimating the forces on a caisson in feasibility
studies are also given.
-1-
LWI / HR / DUT / UE / UoN / UoP / QUB
2.
A. KORTENHAUS ET AL.
INTRODUCTION
Wave impacts on vertical breakwaters are among the most severe and dangerous loads this
type of structure can suffer. Whilst many design procedures for these structures are well established worldwide recent research in Europe has shown that some of those design methods are
limited in their application and may over- or underpredict the loading under important conditions. This will then lead to overdesigned and very expensive structures or, even more dangerous, to underdesign and consequently to danger to personnel and properties.
Within PROVERBS engineering experience from various fields (hydrodynamic, foundation,
structural aspects) concerned with vertical breakwaters has been brought together. Furthermore, data available from different hyraulic model tests, field surveys and experience from
numerical modelling were collected and analysed to overcome the aforementioned limitations.
Engineers from both universities and companies were working together to derive new methods for calculating forces and pressures under severe impact conditions taking into account
the influence of salt water and aeration of the water. This new approach was then further
optimized by taking into account the dynamic properties of the structure itself and the foundation of the breakwater (see Volume I, Chapter 3.4). The multidirectionality of the waves approaching the structure (Vol. I, Chapter 2.5.3) has also been considered.
The intention of this paper is to describe a procedure to calculate both impact and uplift loadings under 2D conditions and to give references to more detailed work on the different aspects
of the steps described in here. For sake of completeness and easier understanding of the whole
method some parts had to be repeated from other sections within Vol. II of the PROVERBS
report. This was considered to be more useful rather than giving too many references to other
sections.
Geometric dimensions and a sketch of a typical caisson breakwater are given in Fig. 1.
-2-
CHAPTER 5.1
4.
WAVE IMPACT LOADS: FORCES AND PRESSURES
OVERVIEW OF RECENT WORK
There are a number of formulae available for different types of waves breaking at the structure. These formulae generally include magnitudes of maximum pressures, their distributions
and forces. In some cases, uplift pressures are given as well. All formulae are fully empirical
or semi-empirical as the process of wave breaking at the structure is still not fully explained.
Tab. 1 summarizes the most important methods in a chronological order, details are given in
the respective references.
Tab. 1:
Overview of design methods for wave loading
Author
Year
Pressures
Forces
Uplift
Comments
Quasi-Static Waves
Sainflou
1928 yes
yes, but
difficult
no
vertical wall, no berm
Miche-Rundgren
1944
yes
1958
yes
no
design curves from SPM, 1984
Goda
1985 yes
yes
yes
most-widely used design
method
Impact Waves
Hiroi
1919 yes
yes
no
vertical wall
Bagnold
1939 -
-
-
conceptual model only
Minikin
1963 yes
yes
no
sometimes incorrect dimensions!
Ito
1971 yes
yes
yes
Blackmore &
Hewson
1984 yes
yes
no
Partenscky
1988 yes
not given
no
air content of wave needed
Kirkgöz
1990
yes
1995
yes
no
vertical wall only
Takahashi
1994 yes
yes
yes
extension of Goda model
Allsop et al.
1996 no
yes
yes
Walkden et al.
1996 no
yes
no
relation of forces and rise time
Oumeraci &
Kortenhaus
1997 yes
yes
yes
time-dependent approach!
-3-
LWI / HR / DUT / UE / UoN / UoP / QUB
Author
Year
McConnell
Pressures
A. KORTENHAUS ET AL.
Forces
Uplift
Comments
1998 no
yes
no
amendment of O&K, 1997
Hull & Müller
1998 yes
yes
no
amendment of O&K, 1997
Vicinanza
1998 yes
yes
no
amendment of O&K, 1997
Broken Waves
SPM
1984 yes
yes
no
vertical walls only
Camfield
1991 yes
yes
no
amendment of SPM, 1984
Jensen
1984 yes
yes
yes
Crown walls
Bradbury &
Allsop
1988 yes
yes
yes
Crown walls
Pedersen
1997 yes
yes
yes
Crown walls
Martín et al.
1997 yes
yes
yes
Crown walls
This paper is concentrated on calculation of pressure distribution and related forces under
impact conditions. Furthermore, the dynamic characteristics of impact forces were considered
essential for the behaviour of the structure subject to this type of loading. The design
procedure is therefore based on the approach by Oumeraci and Kortenhaus, 1997 which was
derived from solitary wave theory but amendments were made to many details like the
statistical distributions of impact and uplift pressures, the vertical pressure distribution at the
front face, and the relation between rise time and duration of impact forces.
6.
OVERVIEW OF DATA SETS
Different hydraulic model tests have been carried out and analysed to obtain the design
method proposed in this paper. These tests are summarized in Tab. 2 where the most
important information is given. Furthermore, references are added where more detailed
information on these tests is available.
-4-
CHAPTER 5.1
Tab. 2:
Overview of hydraulic model tests (random waves)
Tests Year
Co
fsam
No.
n- Scale
Waves Slope
Imp.2) Upl.2) References
[Hz]
tests
fig.1)
Oumeraci et
al., 1995
WKS 1993
1
1:15
600
90
1:50
121
10
6
GWK 1993/94
1
1:5
100
100
1:50
62
10
5
HR94 1994
10
1:20
400
500
1:50
217
8
4
PIV
1
1:50
400
1
1:20
77
7
-
Oumeraci et
al., 1995
1000
1:50
1:20
1:10
1:7
-
McConnell
& Allsop,
1998
4
Kortenhaus
& Löffler,
1998
1994
HR97 1997
QUB 1997
1)
WAVE IMPACT LOADS: FORCES AND PRESSURES
1
3
1:20
1:30
1000
1000
800
1:50
9
12
1
McConnell
& Kortenhaus, 1996
number of configurations tested; 2) number of transducers
It may be assumed from the differences in the number of waves per test and the acquisition
rate that results of pressure distributions and forces might also differ significantly.
Nevertheless, data analysis has confirmed that most of the data sets fit well to each other
which will be explained in more details in the successive sections.
8.
PREPARATORY STEPS
-5-
LWI / HR / DUT / UE / UoN / UoP / QUB
A. KORTENHAUS ET AL.
8.2. Identification of wave impact loading
A simple method is needed to distinguish between:
(b) quasi-standing loads for which available formulae (e.g. Goda, see Vol. I, Chapter 2.4.1) without any account for load duration can be used (Fig. 2a);
Fh
Hb
Fh
Fh
3.0
Fh
D·g·H
2
b
1.0
0.0
2.0
2.0
1.0
1.0
0.0
0.5
1.0
t/T
(a) Standing wave
0.0
0.2
0.4
t/T
(b) Slightly Breaking wave
"Pulsating load"
(d)
(f)
(h)
0.1
0.2
t/T
(c) Plunging breaker
Impact load
(Goda-formula applicable)
Fig. 1:
T=wave period
(Goda-formula not applicable)
Pulsating and impact load - problem definition
slightly breaking wave loads which already consist of some breaking waves but not
significantly exceeding the Goda loads (Fig. 2b);
an impact load for which new formulae including impact duration are to be used
(Fig. 2c); and
broken wave loads, i.e. the waves already broke before reaching the structure.
For this purpose the PROVERBS parameter map (Fig. 3) was developed which is in more
detail described in Chapter 2.2 of Volume IIa. Input for this map are geometric and wave
parameters which in combination yield an indication of a certain probability that one of the
aforementioned breaker types will occur.
-6-
CHAPTER 5.1
WAVE IMPACT LOADS: FORCES AND PRESSURES
"Vertical"
Breakwater
h*b < 0.3
Crown Walls
Rubble Mound Breakwater
h*b > 0.9
Composite
Breakwater
0.3 < h *b< 0.9
L
Low Mound
Breakwater
0.3 < h *b< 0.6
SWL
d
hs
Large waves
Small waves
H *s< 0.35
0.35 < H
Small waves
0.1 < H s*< 0.2
*
s
Quasi-standing wave
hs
B eq
hb
Large waves
Small waves
Large waves
0.1 < H s*< 0.2
0.25 < H *s< 0.6
8.0
8.0
8.0
6.0
6.0
6.0
4.0
4.0
0.0
with h*b=
0.2
Moderate berm w.
Wide berm
0.12 < B *< 0.4
B* > 0.4
Impact loads
Fh*
0.0
Narrow berm
* 0.12
0.08 < B <
Slightly breaking wave
Fhq
0.4
t/T
0.0
Hs
B eq
Fh
*
hb
; H *s=
; B* =
; F=
h D·g·H
hs
L
hs
Broken waves
Fh*
Fhmax
8.0
6.0
4.0
Fhmax
Fhq
2.0
0.0
SWL
0.2 < H *s< 0.6
Fh*
Fhmax
High Mound
Breakwater
0.6 < h *b< 0.9
d
Fh
2.0
Fig. 2:
Hsi
0.1
4.0
Fhq
2.0
0.2
t/T
0.0
0.0
0.1
Fhmax
Fhq
2.0
0.2
t/T
0.0
0.0
0.1
0.2
t/T
2
b
PROVERBS parameter map
8.4. Breaker height at the structure
A breaking criterion which accounts for the reflection properties of the structure has been suggested by Calabrese (1997) (see Chapter 2.3 of Volume IIa) based on extensive random wave
tests in hydraulic model tests and previous theoretical works (Oumeraci et al., 1993):
Hbc '
Lpi @ 0.1025 % 0.0217 @
1 & Cr
1 % Cr
(1)
where Lpi is the wave length in the water depth hs for the peak period Tp which can be calculated iteratively by:
Lpi '
L0 @ tanh 2 B @
hs
(2)
Lpi
-7-
LWI / HR / DUT / UE / UoN / UoP / QUB
A. KORTENHAUS ET AL.
where L0 is the wave length in deep water which can be taken as:
L0 '
g
@T2
2B p
(3)
or can be approximated using the method given in Fenton (1990):
Lpi '
L0 @ tanh 2 B @
hs
3/4 2/3
(4)
L0
The reflection coefficient Cr in Eq. (1) may be estimated as follows (Calabrese and Allsop,
1998):
Cr = 0.95
for simple vertical walls and small mounds, high crest
Cr = 0.8 + 0.1@Rc / Hsi for low crest walls (0.5 < Rc / Hsi < 1.0)
Cr = 0.5 to 0.7
for composite walls, large mounds, and heavy breaking
The empirical correction factor kb can be estimated as follows:
kb '
0.0076 @ Beq / d
2
& 0.1402 @ B eq /
(5)
where Beq is the equivalent berm width which is defined as:
Beq '
Bb %
hb
(6)
2 tan "
and Bb is the berm width in front of the structure. Further details on this approach are given in
Section 2.3 of Volume IIa.
-8-
CHAPTER 5.1
WAVE IMPACT LOADS: FORCES AND PRESSURES
8.6. Probability of occurrence of impacts
The parameter map as given in Fig. 3 results in different branches where the probability of the
respective breaker type is not known in advance. The branch of 'impact breakers' proposes to
use an impact loading formulae which generally yields much higher forces than any other
approach for quasi-standing waves, slightly breaking waves or broken waves. Hence, it is
necessary to know how many of the waves approaching the structure will break at the wall
(thus causing impulsive forces) and how many will not break at the wall (inducing non
impulsive Goda forces).
The aforementioned method by Calabrese and Allsop (1998) described in Chapter 2.3 of Volume IIa also gives a simple formula for the probability of broken waves Pb based on the idea
that every wave with a higher wave height than the breaking wave height Hbc (as calculated in
Section 4.2) is already broken or will break as an impact breaker at the wall. The probability
of occurrence of breaking and broken waves can therefore be calculated as follows:
Pb '
exp & 2 @ Hbc / Hsi
2
@ 100%
(7)
The maximum wave height Hbs which describes the transition from impact breakers to already
broken waves can be described by Eq. (1) where Beq/d and Cr are set to zero which then yields:
Hbs '
0.1242 @ Lpi @ tanh 2 B
hs
Lpi
(8)
The proportion of impacts can then be derived from:
Pi '
exp & 2 @ Hbc / Hsi
2
& exp & 2 @ H
(9)
The magnitude of the horizontal force itself is strongly related to the type of breakers at the
wall which are essentially depth limited. It can be expected that the magnitude is related to the
relative wave height at the wall Hsi/hs.
Eq. (9) can be regarded as a filter in the 'impact' domain of the parameter map. For very low
percentages of impacts (smaller than 1%) the problem can be reduced to the quasi-static
problem and the Goda method can be used to calculate pressures and forces (see Chapter 4.1
of Volume IIa). In all other cases the method as described in the successive sections has to be
used.
-9-
LWI / HR / DUT / UE / UoN / UoP / QUB
A. KORTENHAUS ET AL.
10. WAVE IMPACT LOADING
10.2. Initial calculation of impact forces
Allsop et al. (1996) have investigated a large data set (10 different structure geometries, see
Tab. 2) to predict horizontal wave forces on vertical breakwaters. The relative wave
height Hsi/d has been found to most significantly influence the wave forces non
dimensionalized by the water depth over the berm. All forces were given at a 1/250 level thus
taking the mean out of the highest two waves (500 waves per test were measured). The
magnitude of the horizontal impact force can then be estimated from:
Fh, 1/250 '
15 @ DW g d 2 @ Hsi / d
3.134
(10)
This formula has been derived from data sets with a 1:50 foreshore slope and checked against
other slopes where it also seems to fit the data reasonably well. In Fig. 4 data from three different model tests have been plotted and compared to the prediction method given in Eq. (10).
Random waves
GWK 1993/94
WKS 1993
HR 1994
45.0
30.0
A&V prediction
15.0
0.0
0.5
1.0
1.5
H si /d [-]
Fig. 3:
Relative wave force Fh,max/(Dgd2) plotted vs. relative wave height Hsi/d and
comparison to calculation method given by Eq. (10)
It can be seen from the graph that Eq. (10) gives an upper bound to the data and is only
exceeded by some data points. Allsop et al. (1996) give the validity range of the method as
Hsi/d in between 0.35 and 0.6 whereas here the graph in Fig. 4 shows that it can be used up to
- 10 -
CHAPTER 5.1
WAVE IMPACT LOADS: FORCES AND PRESSURES
relative wave heights Hsi/d = 1.3. It is not possible to take into account the structural response
(dynamic load factor) as rise time and duration of the force is not calculated. Hence, Eq. (10)
provides a quick estimation of the expected horizontal force to the structure but cannot predict
the length of its duration.
Furthermore, problems occur when tests were performed with a low water depth over the
berm resulting in unreasonably high relative values for the forces and wave heights. For any
occurrence probabilities of impacts higher than 1% it is therefore recommended to also use
the method described in the sucessive section.
10.4. Statistics of relative wave forces
A statistical distribution of the relative impact forces F*h,max is needed in order to allow for a
choice of exceedance or non exceedance values for the relative impact forces. Following discussions and exchange of data within PROVERBS, a Generalized Extreme Value distribution
(GEV) is proposed (see example for small-scale data in Fig. 5). The cumulative distribution
function (cdf) of the GEV distribution can be written in its standard form as follows (Johnson
and Kotz, 1995):
exp & 1 & ( @ ˜
x
1
(
with
or
F(˜
x) '
exp & exp & ˜
x
with
- 11 -
(11)
LWI / HR / DUT / UE / UoN / UoP / QUB
A. KORTENHAUS ET AL.
28.0
24.0
20.0
GEV
16.0
Parameter (ME):
n = 260
" = 3.7816
ß = 8.7819
( = 0.0381 *)
s = 0.0917
12.0
Kolm.-Sm. Test:
Dn = 0.000
" = 0.01 (%)
" = 0.025 (%)
" = 0.05 (%)
8.0
4.0
*)
0.1
10.0
50.0
80.0
90.0
95.0 97.5
99.0 99.5
scales x-axis
99.9
99.99
Non exceedance probability
Fig. 4:
Statistical distribution of relative impact forces observed in the WKS for random
waves
In Eq. (11) the standardized x-parameter x˜ can be written as follows:
x '
˜
x & $
"
(12)
The probability density function (pdf) of the GEV in its standardized form can be given as:
f(˜
x) '
1 & (@˜
x
1
& 1
(
@ exp & 1 & (
(13)
exp & ˜
x @ exp & exp & ˜
x
where parameters ", $ and ( can be taken from model tests similar to the structure to be
designed or can generally be estimated as " = 3.97; $ = 7.86; and ( = -0.32. The latter values
were derived from large-scale tests with a 1:50 foreshore slope and almost non-overtopping
conditions (GWK, 1994) and are used in PROVERBS for all probabilistic calculations of
structures where impact waves are considered. Further advice for different bed slopes have
been given by McConnell and Allsop (1998) so that the following parameters for further use
can be suggested:
- 12 -
CHAPTER 5.1
Tab. 3:
WAVE IMPACT LOADS: FORCES AND PRESSURES
Values of ", $, and ( for GEV distribution of relative horizontal force
Bed slope
no. waves
scale
"
$
(
1:7
116
.1:20 / HR97
2.896
6.976
-0.526
1:10
159
.1:20 / HR97
10.209
12.761
-0.063
1:20
538
.1:20 / HR97
3.745
7.604
-0.295
1:50
3321
.1:20 / HR94
1.910
3.268
-0.232
For details on HR94 and HR97 tests see Tab. 2
In Kortenhaus (1998) the influence of the number of waves on statistical parameters of the
various distributions available has shown that the number of data points should be not less
than about 250. The values given in Tab. 3 for bed slopes of 1:7 and 1:10 should therefore be
considered carefully. More details on the influence of geometric and wave parameters on
statistics of wave impact forces can also be found in Kortenhaus (1998).
Furthermore, Eq. (11) has been used to plot data from other wave flumes where significant
differences were observed resulting in much higher relative forces (McConnell and Allsop,
1998). These differences are assumed to be mainly due to the differences in logging frequencies (GWK: 100 Hz; WKS: 600 Hz; HR94: 400; HR97: 1000 Hz), the different number
of waves per test (GWK: 100; WKS: 100; HR94: 500; HR97: 1000) and the different total
number of impacts as given in Tab. 3.
Eq. (11) can be transformed using Eq. (12), yielding the force as a function of the probability
of the horizontal impact force:
(
Fh,
max '
"
ˆ(
1 & & ln P F
h, max
(
(
% ß
(14)
where P(F*h,max) is the probability of non exceedance of relative impact forces which generally
may be taken as 90% and F*h,max is the relative horizontal force at the front face of the structure
non dimensionalised by DgHb2. The maximum horizontal force can then be calculated by :
Fh, max '
(
2
Fh,
max @ D g H b
(15)
- 13 -
LWI / HR / DUT / UE / UoN / UoP / QUB
A. KORTENHAUS ET AL.
where Hb is the wave height at breaking (Eq. (1)) and D is the density of the water.
10.6. Calculation of impact force history
A full impact force history is needed to account for the temporal variation of the forces and
pressures induced by the breaking wave. For practical reasons the typical impact force history
may be reduced to a triangle1) (Fig. 6) which is described by the rise time tr and the total duration of the force td as discussed below.
10.6.2.
Rise time tr
Following considerations derived from solitary wave theory (Oumeraci and Kortenhaus,
1997) a relationship between relative impact force peak F*h,max = Fh,max/DgHb2 and the rise time
trFh can be derived. It is proposed to use the following equation for trFh:
trFh '
k @ 8.94
d eff / g
(16)
(
Fh,
max
The effective water depth in front of the structure deff can be assumed to be identical to the
water depth in which the wave breaks and may be calculated as follows:
deff '
1)
d % Brel @ mrel @ h s & d
(17)
The triangular shape is derived from the actual force history based on the equivalence of
breaking wave momentum and force impulse.
- 14 -
CHAPTER 5.1
F
WAVE IMPACT LOADS: FORCES AND PRESSURES
F
h
h
F h,max
I
I
rFh
I
t
I
dFh
t
rFh
dFh
rFh
tr
t dFh
t
td
Fig. 5: Substitution of actual force history by an equivalent triangular load
where Brel is the part of the berm width which influences the effective water depth (Brel = 1 for
no berm width):
1
Brel '
for smaller
1 & 0.5 ·
Bb
L
(18)
for larger
and mrel is the part of the berm slope influencing the effective water depth (mrel = 0 for simple
vertical wall):
1
mrel '
for steeper slopes
1
m
for flatter slopes
- 15 -
(19)
LWI / HR / DUT / UE / UoN / UoP / QUB
b)
A. KORTENHAUS ET AL.
Deterministic approach
The k-factor used in Eq. (16) is dependent on the breaker type and the fluid mass directly
involved in the impact process and can be expressed as follows:
k '
Mimp
Mtot
'
IrFh
(20)
IdFh
where Mimp is the mass part involved in the impact; Mtot is the total mass of the breaking wave
moving towards the structure and IrFh and IdFh are the corresponding force impulses. This
approach is based on solitary wave theory again and thus is regarded as preliminary for
random waves. Detailed investigations on pressure impulses on vertical walls and breakwaters
have been performed by Bristol University and references are given in Vol. I, Section 2.5.5.
Specific details on the most relevant parameters involved can be found in Cooker and
Peregrine (1990).
Preliminary analysis by early PIV measurements in 1994 (Oumeraci et al., 1995) and more
detailed analyses of breaker types at University of Naples (Vicinanza, 1998) together with
University of Edinburgh derived from random wave trains have shown that
@ even though there is some scatter the k-parameters for waves breaking over low and
high berms are in the same range;
@ a mean value of k = 0.205 ± 20% (standard deviation of 11%) can be assumed for all
plunging breakers regardless the relative height of the berm.
Eq. (16) is compared to random wave data from three different model tests in Fig. 7. All data
sets have been re-analysed where the following filters were applied:
@ the highest 10 waves of each test;
@ only breaking waves of the highest 10 waves (following the criteria as given by
Kortenhaus and Oumeraci, 1997);
@ the total duration td is shorter than 6 times the rise time tr (to avoid unreasonable results)
These filters reduce the scatter considerably and will lead to some other formulae than
indicated by previous papers (Oumeraci and Kortenhaus, 1997). Fig. 7 shows that the
proposed formula represents a curve fitted to most of the random data sets whereas an even
better fit is obtained for solitary waves (Oumeraci and Kortenhaus, 1997). Data from
McConnell and Allsop (1998) have not yet been plotted using the aforementioned filters but it
is assumed that the high values found in these data are reduced considerably as well.
- 16 -
CHAPTER 5.1
WAVE IMPACT LOADS: FORCES AND PRESSURES
Random waves
GWK 1993/94
WKS 1993
HR 1994
45.0
No. of tests = 239
30.0
15.0
McConnell & Allsop, 1998
Eq. (16), k = 0.205
0.0
0.5
1.0
1.5
Relative rise time t
Fig. 6:
2.0
rFh /%(d eff /g) [-]
2.5
Comparison of prediction formula to large-scale measurements (random waves)
The equivalent 'triangular' rise time tr (see Fig. 6) is assumed to be much shorter for breaking
waves, especially when rise times are very short. For longer rise times it is expected that triangular rise time tr and measured rise time trFh are in the same range. For non breaking waves it
may be expected that the rise time is no longer than a 1/4 of the wave period whereas for
breaking waves much shorter relative rise times can be assumed. It is, however, extremely
difficult to derive a clear relationship between both values so that the ratio trFh/tr was derived
for the GWK, WKS and some of the HR94 data and a statistical distribution was plotted
(Fig. 8).
- 17 -
LWI / HR / DUT / UE / UoN / UoP / QUB
Fig. 7:
A. KORTENHAUS ET AL.
Probability distribution for triangular rise time ratio for horizontal forces
This best fit was achieved by a log-Normal distribution with a mean value of 1.487 and a standard deviation of 0.667. The mean value is higher than what was found in Oumeraci and
Kortenhaus (1997) which is most probably due to that only breaking waves are included in the
present analysis.
d)
Probabilistic approach
For probabilistic calculations the aforementioned uncertainties in the relations of rise time to
triangular rise time and triangular rise time to relative impact force were considered together.
This was achieved by defining a factor k' which summarizes k*8.94 (right side of Eq. (16))
and the relation of the measured rise time trFh (left side) and the 'triangular' rise time tr (assuming a constant relationship). Eq. (16) will then read:
- 18 -
CHAPTER 5.1
tr '
k) @
WAVE IMPACT LOADS: FORCES AND PRESSURES
d eff / g
(21)
(
Fh,
max
From statistical analysis of the unfiltered data the factor k' can best be described by a
LogNormal distribution with a mean value of 0.086 and a standard deviation of 0.084 (Van
- 19 -
LWI / HR / DUT / UE / UoN / UoP / QUB
A. KORTENHAUS ET AL.
Gelder, 1998). These values are again based on results from large-scale hydraulic model tests
which are believed to best represent the situation under prototype conditions.
10.6.4.
b)
Total duration td
Deterministic approach
The relationship between rise time and total duration of the impact is dependent on the
breaker type. The aforementioned filter which was applied to the data sets has led to a new
approach describing the total duration of impact forces:
td '
tr @ 2.0 % 8.0 @ exp & 18 @ t r / Tp
(22)
In Fig. 9 this relation is examplarily plotted for random wave tests. According to what was
expected the total duration is rarely smaller than 2.0, i.e. the decay time of the impact is
usually longer than the rise time. For longer relative rise times the total duration is close to 2.0
whereas for shorter rise times the factor can increase significantly. When ignoring very sharp
peaks (and thus very high ratios of td/tr) Eq. (22) gives a good estimate of the upper bound of
these data.
Random waves
No. of tests = 239
10.0
GWK 1993/94
WKS 1993
HR 1994
5.0
Eq. (22)
t d = 2*t r
0.00
0.05
0.10
0.15
0.20
Relative rise time t
Fig. 8:
0.25
r/T p [-]
Triangular impact duration td vs. relative triangular rise time tr for random waves
- 20 -
CHAPTER 5.1
d)
WAVE IMPACT LOADS: FORCES AND PRESSURES
Probabilistic approach
Upper bound approaches as given in the previous section are not applicable for probabilistic
design. Therefore, a relation of rise time and total duration was derived by Van Gelder (1998)
where td can be calculated from tr by:
td '
&c
ln ( t r )
(23)
Eq. (23) is dimensionally incorrect but has given the best correlation of the data. In Eq. (23) c
is a random variable (dimension: [-s@ln(s)]) with a Gaussian distribution which can be given
by its mean value (c = 2.17) and its standard deviation (F = 1.08). Again, these values
correspond to large-scale measurements without any filtering of the data. Different parameters
were found from other (small-scale) tests which indicates that filtering of the data as indicated
above would be useful for this statistical approach as well.
10.6.6.
Force impulses Ihr and Ihd
Force impulses are more relevant to the response of the overall structure than the impact
forces and should therefore be calculated and probably used for the selection of the worst
design situation of the brakwater. Since rise time (or total duration, respectively) and the
maximum force are known (Eqs. (21) and (23)), the force impulse over the rise time Ihr can be
obtained from:
Ihr '
1
@F
@t
2 h,max r
(24)
and the horizontal force impulse over the total duration Ihd can be calculated as follows:
Ihd '
1
@F
@t
2 h,max d
(25)
- 21 -
LWI / HR / DUT / UE / UoN / UoP / QUB
A. KORTENHAUS ET AL.
10.8. Pressure distributions at the wall
Two types of pressure distributions were proposed and discussed within PROVERBS one of
which is based on extensive large-scale testing of waves breaking at a vertical wall whereas
the other is derived from small-scale tests of a composite breakwater with extensive variation
of geometric and wave conditions. Both distributions start with the maximum force at the wall
as the dominant input parameter so that the overall loading of the structure is identical in both
cases. It should be noted that results from these pressure distributions are not used for
probabilistic calculations. Both approaches are described in the following.
10.8.2.
Distributions from vertical wall tests
Based on the analysis of almost 1000 breakers of different types hitting a vertical wall, the
simplified distribution of impact pressure just at the time where the maximum impact force
occurs, can tentatively be determinated according to Fig. 10. Three or four parameters need to
be calculated in order to describe the pressure distribution: (a) the elevation of the pressure
distribution 0* above design water level; (b) the bottom pressure p3; (c) the maximum impact
pressure p1 which is considered to occur at the design water level; and (d) the pressure at the
crest of the structure if overtopping occurs.
Fh(t)
DWL = Design Water Level
R c = Freeboard
0 = 0.8@ H
p4
F h,max
p
*
Rc
1
DWL
F
F (t)
h
l
h,max
d
Fh
dc
t
tr
t
p = 0.45 p
3
1
td
Fig. 9:
Simplified Pressure Distribution at a Vertical Wall
- 22 -
b
CHAPTER 5.1
b)
WAVE IMPACT LOADS: FORCES AND PRESSURES
Elevation of pressure distribution 0*
The elevation of pressure distribution 0* may be calculated from the following tentative
formula (see Fig. 10):
0( ' 0.8 H b
d)
(26)
Bottom pressure p3
The bottom pressure p3 may be derived as a function of the maximum pressure at the height of
the still water level as follows (see Fig. 10):
p3 ' 0.45 p1
f)
(27)
Maximum pressure p1
The maximum impact pressure p1 can be calculated directly from the equivalent force history
(Fig. 10), since Fh(t) represents the area of the pressure figure at any time of the history
(assuming an infinitely high wall):
Fh( t ) '
1
p ( t ) @ 0.8 @ H b % d % dc
2 1
(28)
Substituting Eq. (27) in Eq. (28) yields:
p1 ( t ) '
h)
Fh ( t )
0.4 @ Hb % 0.7 @ d % d c
(29)
Pressure at the crest of the structure p4
If the waves in front of the structure are high enough, overtopping is expected to occur. This
will reduce the total impact force as parts of the energy of the wave will get lost. This effect
can be taken into account by cutting off the pressure distribution at the top of the structure
(Fig. 10) so that the pressure at the crest of the structure can be described as follows:
für 0( < Rc
0
p4 '
0( & Rc
0(
p1 für 0( $ Rc
- 23 -
(30)
LWI / HR / DUT / UE / UoN / UoP / QUB
A. KORTENHAUS ET AL.
The horizontal impact force1) is then reduced to:
Fh,max,ov '
10.8.4.
Fh,max &
1
@ 0( & R c @ p4
2
(31)
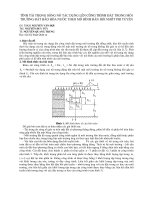
Pressure distributions from breakwater tests
Very recently, Hull et al. (1998) proposed a different pressure distribution based on the HR94
data set (see Tab. 2). This distribution is given in a non dimensionalized form only dependent
on the maximum pressure observed at still water level, pmax, the height of the berm, hb, and the
height of still water level at the toe of the foundation, hs. Fig. 11 shows this pressure
distribution which is separated into three areas: pulsating, impact, and wave runup.
This distribution has been derived
from all composite type breakwaters
tested (10 different configurations)
and can therefore be used for any
structural configuration. The zcoordinate at the wall is obtained for a
very high wall (no overtopping) as
follows:
z '
y @ hb
hs2
(0 / 1.2)
1.0
Wave run-up
0.5
(8 / 0.4)
(40 / 0.17)
(100 / 0)
DWL
0.0
Impact
Pulsating
(40 / -0.25)
-0.5
(0 / -0.9)
0.0
25.0
50.0
75.0
100.0
125.0
P / P max [%]
(32)
Fig. 10:
Vertical pressure distribution after Hull
et al. (1998)
where hb is the height of the berm, hs is the water depth at the toe of the foundation, and y is
the vertical distance above or below still water level (positive upwards). All points of the distribution may be calculated using the coordinates given in the graph. The relative pressures in
this graph are only dependent on the maximum pressure pmax, and the vertical coordinate is
only dependent on two known variables. Hence, the integration of this distribution is straightforward for a very high wall with no overtopping and relatively deep water over the berm. The
summation of areas of the relative pressure distribution then yields:
1)
Consequently, the statistical distribution given in Fig. 5 is no longer valid for this
reduced force as the statistical distribution was determined for relatively high caisson
structures and almost no overtopping.
- 24 -