Protection and Control of Coastal Erosion in India
Bạn đang xem bản rút gọn của tài liệu. Xem và tải ngay bản đầy đủ của tài liệu tại đây (43.37 MB, 145 trang )
I
: :~
<
'
COVER PHOTO:
Anjuna Beach, Goa, India - protruding
rocky cliffs offering natural proteetion
to pocket beaches
. ,,"
1980 N. 1. O.
Published by
National
Institute
of
Oceanography, Dona
Paula
Goa- 403 004, India
Printed at
Samyukta Karnataka Press (Job), .Koppikar Road, Hubli- 580020, India
1980 N. 1. O.
Published by
National
Institute
of
Oceanography, Dona
Paula
Goa- 403 004, India
Printed at
Samyukta Karnataka Press (Job), .Koppikar Road, Hubli- 580020, India
Contents
Page
Preface
I.
2·
list
of Figures
iii
list
of Tables
vii
Introduction
1
I. I
General
review
on causes
'·2
Rise of sea level
of beach erosion
1
2
1·3 Heavy storms, storm surges, wave
action and its seasonal effects
2
1.4 Littoral drift barriers, natural
and man-made conditions in India
10
Beach Surveys
19
2.1
Bathymetric
surveys
2.2
Sand sampling and analysis
2,2.1
Sand sampling
2.2.2 Sample analysis
2·2.3 Beach fill models
21
21
21
21
2.3
VVave
2.3.1
2.3.2
2.3.3
24
24
19
surveys
General
VVave measurements
Relationship between the visual
and the Instru mental data
25
25
2.4 Current
and tide surveys
2.4.1 General
2.4.2 Current
measurements
2.4·3 long term analysls of current
2.4·4 Tide surveys
2.5 Littoral
3.
Coastal
3. I
3·2
drift
25
25
data
surveys
..
Protection
26
26
26
27
31
Basic aspects
3· I . I Material balance
3·1·2
Beach and bottom profiles
3· 1·3 VVave machanics aspects
31
31
35
Review of coastal protective
36
3.2·1
~. 2.2
36
measures
Natural and man-made coastal protection
Pre-re9uisites
for coastal protection
.,
36
40
22
/'
.~
20
18
6
4
'2
~
.-
Sw
r-,<,
.......
Sx
I
-
~
r-,<,
r------.
r-,
<,"'-
Sy ..........
•
\
-,
::::::--.....:
~
~
Sap
\ ·
...J
\
4
---
\.
2
...J
-.........
I-
,•
\
6
o
--'r-
i\
Q
UI
·
\
\
\,
'2
I-
--
----~-----
8
>
UI
I
DESIGN WATER LEVEL INCLUDING
SURFACE - WAVE SETUP
r---
0
'C[
v-
,
SA
\
.
-
Se
.
-
'~
I--- MEAN SEA LEVEL ( MSl )
~
-T
-T
I-- CONTINENTAL SHELF
~
100
I
",
~
•
I
I- 20 0
UI
UI
s.w = BREAKING
"x 30 0
I
I-
0..
UI
~
WAVE SETUP
= • .;..COMPONENT SETUP
S.
S.~:.
o
I
II- 50,n
111
~
-,
Sy :. y - COMPONENT SETUP
o 40 0
~
o
LEGEND
-
SA
. Se
ATMOSPHERIC PRESSURE SETUP
= ASTRONOMICAL
::t
I"
o
DrSTANCE IN YARDS
INITIAL
TIDE
WATER LEVEL
I
j
I
10,
20
30
40
50
. DISTANCE. FROM COAST ( NAUT.ICAL MfLES)
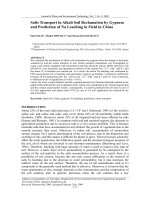
Fig; 1.3 Various setup compoaents over the continentaJ sheJf (ref. 43).
60
Preface
Erosion prevailing along the vast coastline of India has a long history.
Coastal erosion,
very of ten, poses a serious problem- The nature and degree of protection
required for a given
coast vary widely depending upon the environmental conditions prevailing in the area.
A comprehensive environmental study of the problem is required for developing a suitable
solution to any specific coastal problem.
In genera I, there wiJl be more than one method
applicable to protecting an eroding area- Hence, it is very desirabIe to consider both short-term
and long-term effects very carefully before determining
the most suitable remedial measure
to cernbat erosion problem.
In this manual, an attempt has been made to present some of the remedial measures
including the guidelines for suitable designs to control coastal erosion with special reference to
Indian condinons. While some of the basic information has been presented in the text under
various sections, more detailed information has been included separately under six_appendices
in the manual.
Although the techniques presented in the manual are generally applicable to _
most of the coastal erosion problems, competent engineering judgement,
based on experience,
is necessary for determining their application to any specific problern.
This manual is first of its kind in India. It is intended to be precise and effective .and makes
no claim to be exhaustive.
Nevertheless,
the value of a manual of th is nature, dealing with
diverse aspects of coastal erosion and its protection, cannot be denied.
The original idea for preparing this manual came from Professor Per Bruun, who has
considerable experience of working in Indian conditions for the past fifteen years or so. His major
contribution and guidance during the preparation of this manual is indeed greatly appreciated.
I would like to express my gratefulness to my colleagues at the National Institute of
Oceanography for giving valuable support to Prof. Bruun in the preparation
of this manual.
Colleagues who made significant contributions to this manual are: Dr. B. U. Nayak, Mr. N. M.
Anand, Dr. A. K. [aln, Dr. A. G. Untawale,
Mr. B. G. Wagle and Mr. K. H. Vora. Very useful
suggestions and reviews were offered by Mr. N. P. Bhakta, Director, Pre-investment
Survey
of Fishing Harbours,
Bangalore and Dr. V. V. R. Varadachari,
Mr. H. N. Siddiquie and
Dr- J. S. Sastry. The valuable asslstance rendered by Mr. K. G. Chitari of the Drawing Section
and Mr. S. P. Sharma of the Planning and Data Division in connection with the printing of
the manual is gratefully acknowledged.
I would like to express my gratitude to the U. S. Army Corps of Engineers, Coastal
Engineering Research Centre, Virginia and Mis. Litton Educational Publishing Inc., New York
for their kind permission to reproduce some of the material and figures from thelr publications.
Comments and suggestions from readers on this publication
improving and up-dating the manual in the future.
National Institute of Oceanography
Do~a Paula, Goa-403004.
India
IS February, 1980.
would be most welcome for
S. Z. QASIM
Director
iii
List of Figures
Page
Fig.
1.1
Fig.
Fig.
Fig.
Fig.
1.2
1.3
1.4
1.5
Fig.
Fig.
Fig.
Fig.
Fig.
Fig.
Fig.
Fig.
Fig.
1.6
1.7
1.8
1.9
1dO
1011
1012
1.13
1·14
Fig.
Fig.
Fig.
Fig.
Fig.
Fig.
Fig.
2.1
2.2
2.3
2.4
2·5
2,6
2.7
Some examples of coastal erosion on the west coast of India
Schematic diagram showing attack of storm waves on beaches and dunes (ref. 43)
Various setup components over the continental shelf (ref. 43)
Probable elevation of maximum storm surge on the south-east coast of India
Wave setup in a breaking zone in relation to tides, beach profile and energy
dissipation (ref. 12)
Wave setup along a beach profile in terms of significant wave height (ref. 12)
Naturallittoral drift barriers and headlands
Natural Iittoral drift barriers, tombolo and recurved spit
Effect of man-made littoral drift barriers
A group of groins used as Iittoral drift barriers
Some problems of littoral drift at tidal inlets
Improved tidal inlets as littoral drift barriers
Shoreline at Mangalore showing the location of the Bengre fishing village (ref. 34)
Developing erosion at a jetty improved tidal inlet (a) showing persistent swelJ
conditions (h) during storm wave condition
A simple procedure for measuring beach and offshore bathymetric surveys
Procedure for rapid and accurate beach and offshore bathymetric surveys
Size frequency plots
Overfill factor (RA) versus phi mean difference and phi sorting ratio (ref. 17)
Renourishment factor versus phi mean difference and phi sorting ratio (ref. 16)
Tracer experiments to determine the predominant direction of Iittoral drift
A simple wave observation procedure
to evaluate Iittoral drift
/
3
5
6
7
9
9
10
11
12
13
14
15
16
17
20
20
22
22
2.3
27
28
Fig. 3-1
Longshore transport rate versus longshore energy flux factor for field conditions
(ref. 43)
Fig. 3.2
Longshore transport rate as a function of deep water wave height and deep water
wave angle (ref. 43)
Fig. 3·3
SwelJ profile and storm wave profile
Fig. 3.4
Various types of wave breakers
Fig. 3·5
Breaker height index versus deep water wave steepness (ref. 43)
Fig. 3·6
Relative depth àt wave breaking versus breaker steepness (ref. 43)
Fig. 3·7
Schematic of a rock mound wall in front of a dune on an open beach
Fig. 3·8 Schematic of a rock revetment for dune proteetion on an open beach
Fig. 3·9
Schematic of a rock revetment for protecting the valuable shore property
with a provision of an access.to the beach
Fig. 3.10 Schematic of a vertical rock gravity wall (for wave heights Iess than 0.5 m)
Fig. 3· J1 Schematic of a double piled fascine or bag crib ( for wave heights less than I m )
Fig. 3e12 Schematic of a single piled rock crib (for wave heights less than 1.5 m)
Fig. 3. D Schematic of a simple mattress or gabion wall I for wave height less than I m)
Fif. 3.}4 Schematic of a simple revetment of sand bags ( for wave heighis less than I m ~
32
33
35
37
38
39
45
46
47
48
49
49
~,
50
29
For
and Hp thc
observations
reference to
the above formula, the relation between Hbr, height of the wave at the time of its breaking
height of the same wave while passing the wave polc are needed (sec Fig. 2.7). Further field
on the following lines wcre made to arrive at a relationship between Hbr and Hp with special
monsoon waves-
Step 1:
From the knowledge of the bottom topography,
wcre drawn to trace the path of the waves-
refraction diagrams for different wave directions
Step 2:
Using the data from the Shore Proteetion Manual of the U· S· Army Coastal Engineering
Research Centrc (ref. 43) for the obscrvcd direction, the height of the wave at the pole and
the approximate depth at wave breaking were determined- A marker buoy was placed at
that point (see Fig. 2.7).
Step 3
From the knowledge of the distance through which the wave had to travel, the actual time
required for a wave to travel from the wave pole to the point of its breaking at the marker
buoy was noted as t seconds.
Step 4:
Two theodolites were set up as close as possible at a strategie location to get a clear view
of the crest and trough of the breaking waves and the distances between the marker buoy and
the theodolites were computed-
Step 5:
A pers on was posted to observe the wave height of a passing wave at the pole- At the same
time he signals the other two persons at the two theodolites- A stopwatch was used by the
posted person to count the time t for the wave to travel from the po Ie to the buoy- At the
end of t seconds, and on receiving the signal, the vertical angles to the ere st and a few seconds
later to the trough, were read at the buoy by the two theodolites- The procedure was repeated
for a number of waves passing the wave pole-
Step 6:
From the above data and after knowing the vertical angle between the crest and the trough
and the horizontal distance between the theodolites and the buoy, the height of the wave at the
time of its breaking was computedFIOm a sufficient number of readings, the following relationship between Hbr and Hp was arrived at:
Hi» = 1-45 Hp (valid for waves of almost equal steepness)
Using this relationship and adopting the above integrated formula, the amount of littoral drift
each day for a period of one year was calculated- Table 2·2 is a summary of the littoral drift calculations (ref. 29).
Table 2·2 Summary of littoral drift eaIculation for Ramayapatnam
covering the period from 31·5·1972 to 1·5·1973 (ref. 29)
Total drift
= 16,80,446 cu- m
Drift south to north
= 15,56,564
Drift north to south
= 1,23,882 cu· m
Net drift (south to north)
= 14,32,682 cu- m
cu- m
The quantity of net drift given in Table 2.2, most probably, is on the higher side- However, it
has the right order of magnitude as compared to the drift at the Madras harbour which has a similar
wave. elimate as at RamayapatnamThe above example shows how a difficult task could be accomplished
using simple methods-
v
Fig.
0·4 Forces acting on a gravity seawall
Fig.
Fig.
Fig.
Fig.
Fig.
0.5
0·6
Page
105
106
106
106
108
Circular slip surface for a seawall (rel- 8)
Non-eireular slip surface for a seawall (ref. 8)
D.7 Some failure mechanisms for piled retaining walis (ref. 8)
0'8
Effect of slope angle and friction angle on stability factor (ref. 8)
0.9
Stability factors for failure plane passing through and below the toe of
a structure (ref. 8)
109
Fig. E·l
Fig. E·2
Fig. E·3
Geological map of nortb-west coast of India
Geological map of south-west and south-east coasts of India
Geological map of north-east coast of India
114
116
Fig. F.I
Fig. F.2
Fig- F.3
Climatqlogical factors at Jamnagar, Marmugao, Visakhapatnam and Pamban
Succession of dune plants at Miramar beach, Goa
Proteetion of transplanred seedlings by 'Checker board' method
120
123
127
Plate F-I
(a) Dune formation by Spinifix littoreus at Miramar, Goa
(b) Growth of S. littoreus
128
128
(a) Development of shoot and rootlets at nodal region in Si llttoreus
129
129
Plate F·2
117
(b) Female flowers of S. littoreus
Plase F· 3 (a) Growth of J. pescaprae on the sandy dune
(b) Typical bilobed and fleshy leaves of J. pescaprae
130
130
Plate F.4
(a) Carpet flora of Cyperus arenarius on sand dune at Miramar, Goa
(b) Mixed vegeration of C. arenarius and l. pescaprae
131
131
Plate F· 5
(a) Growth of Periploca sp· on sand dunes of Saurashtra
132
132
(b) Periploca sphylla growing in -sand in an arid region
Plate F'6
(a) Coastal erosion of sandy beach at Miramar, Goa
(b) Coconut plantation on sandy beaches
133
,.
t33
vii
List of Tables
Page
Table
1.1
Causes of erosion attributable to nature and man (ref. 3)
Table
2·1
Steps for sampling and analysis
Table
2.2 Summary of Iittoral drift calculation for Ramayapatnam
2
24
covering tbe
period from 31·5·1972 to 15·6·1973 (ref. 29)
29
Table
3·1
Breaker type in relation to tbe parameter
~ or
~b
36
Table
3.2
Natural and man-made
(ref. 3)
40
Table
3·3
Needs for coastal proteetion
Table
3·4
Coastal protective measures classified in accordance witb tbeir ability to
provide proteetion to large and small shore areas and their influence on
tbe adjoining sbores (ref. 3)
41
Coastal proteetion in relation to souree of materials and conditions of
beach profiles for beneficial versus adverse effects
42
43
Table
3·5
coastal proteetion
(ref. 3)
40
Table
3·6
Details of tbe performance
of seawalls (ref. 3)
Table
3·7
Details of tbe performance of groins (ref. 3)
Table
3.8
Details of tbe performance
of offshore breakwaters
(ref. 3)
44
Table
3·9
Details of the performance
of artificial nourisbmen t (ref. 3)
44
Table
3.10 Future
Table
A.I
43
coastal protective measures (ref. 3)
Parameters
(ref. 10)
of long-term
distributions
57
of individual
wave heights
73
Table
8.1
Values of r for various slope characteristics
Table
B.2
Approximate rock sizes in kilograms for various wave beigbts, slopes
and wave periods T == 6 to 10 seconds (specific gravity 2.65)
95
Table
C.I
Grain size scales and soil c1assification systems
99
Table
E.I
Important
Table
F. I Distribution
of sandy beaches along the Indian coastline
121
Table
p. 2 Distribution
of dune species along the Indian coast
122
engineering properties
(ref. 16)
of common rock types (ref. 15)
79
112
60
1~ ~1"t
are given in. Table 3·11, and in the legend of Fig 3.21 which should be followed- The bypassing procedure
which could prove to be most successful for Indian conditions is trap-dredging -by which drift material
is accumulated in dredged traps located at a convenient placc from where it eau he removed by hydraulic
pipeliIl:e"dredge at regular intervals- Figs- 3·22 and 3',23 show some practical locations of traps for improveOCEAN
f)REDGED
MATERlAL
TO BE DUMPED ON
DOWN DRIFT BEACHES
LITTORAL
BARRIER,
BAR~IER 'BEACH
....
DRIFT
BEACH
"
•
.. ,' ..
• ,
"
• -
:
",
..
•
•
•
••
0.
•
•
•
•
•
,
•••••••
• • • ". " • • ..~: : 0. : : I. i .", '0 : : ••• ". : : : ,,' .."
BAY
••••
Fig. 3'22
Inlet maintenance to improve navigation by dredgiug.
OCEAN
SAND
TRAP
DURING
SEASON
THE
TO
BE
DREDGED
NON MONSOON
NEW SHORELINE
DREDGED
DUMPED
MATERlAL
TO
ON DOWN
BE
LlTTORAL
DRIFT
BEACHES
" .. '.'.~~',·:':·i·~:
..:..:~
'~:":-7
,.
.. .. ..
.. ..
DRIFT
...
.. ..
BARRIER
.. ..
•
•
•
î": : :-'. '. : : :: :
•
•
•
..
:
:
:
:
'". "
°0
...
.. : "'-.: :
BEACH
.;..::.: "::: ': ....
'
.. . ..
ORIGINAL
..
.. ...•........ :: r », :
SHORELINE
BAY
Fig. 3.23
Maintenance of inlet to improve nävigation and to decrease loss of material to
deeper water by ebb ftows during the rnonsoon,
..
.
2
Dlost
couutries of the world are surrouuded by shores of alluvial matcrials derived from inland and
offshore soureesErosion is caused by the forces of nature, sometimes enhanced by man-made structures or by
rnan's activity of removing the material from the shore for building or other commercial purposes- Table 1.1
summarises some of the causes leading to natural and man-made erosionTable 1·1 Causes of erosion attributable to nature and man (ref. 3).
Man
Nature
Rise in sea level.
Protruding headlands, reefs and rocks
causing downdrift erosion.
Tidal entrances aud river mouths eausing
interruption of Iittoral drift.
Shoreline geometry causing rapid increase
of drift quantityBlocking of river outlets carrying sediments to the shore by flood stage barriers,
change of loeation of outlets due to
floods, erosion, teetonic movements etcRemoval of beach material by wind driftRemoval
outbursts
of beach material
of flood waters-
by sudden
Dams, dykes and other coastal structures
causing rise and concentration
of tidesGroins, breakwaters, jetties etc-, causing
downdrift erosion.
Man-made entrances causing. interruption
of littoral drift- This includes jetties for
proteetion of tidal entrancesFills protruding In the ocean to an extent
that they change local shoreline geometry
radically Sueh fiUs are often bulkheadedDamming up of rivers without providing
material sluices which allow continuatien
of drift of matcrials.
Irrigation projects
decreasing flow of water and sediments
to the shoreRemoval of material from beaches for
construction and other purposes. Digging or dredging of new inlets, channels
and cntrances- Offshore dumping of materials-
The following paragraplis give the overall explanations
physics and engineering aspeets of the erosion problem-
for erosion-
Section 3·1 deseribes basic
1.2 Rise of sea level
Alrn rst all the mores in India erode (refs- 25, 28, 34, 35, 40 and 41).
some of the examples of beach erosion occurring on the west coast of India-
Figs- 1·1 (a) to (h) show
Óne general reason for erosion is the rise of the sea Ievel- The sea level rise (refs- 2 and 13) may
sound insignificant but it is necessary to realise how narrow a beach is, as compared to the offshore area,
which has to be nourished by the material eroded from the beach iu order to compensate for thc rise of
the sea level- With an equal amount of the deposited material at the bottom, it is easy to work out how
au average sea level rise of just 1 mm per year could cause a shorelinc recession in the order of about 0·5
metre per year- The actual rise of the sea level along the Indian coast is not well established- However,
it is generally accepted that while the sca level is rising, a consolidation by settling takes place at the same
time in the river delta" like the Hooghly- The average rise of the sea level appears to be of the order of
1 to 2 mm per year, which is the average rate accepted universally1.3
Heavy storms, storm surges, wave action and its seasonal effects
It is well known that heavy storms including severe monsoons, hurricanes and eyclones cause the
maximum erosion rates- The explanation for this is that high and steep waves break on the shores producing
highly turbulent waters and up rushes which often attack the dunes or coastal platforms directly, thereby,
causing eros ion and creating vertical scarps, which in turn cause reflection of the waves, increase the
(a) Photograph
showing beach erosion
during the Monsoon of 1967.
at Punnapra,
Kerala
(c) Photograph showing erosion problem at a beach at Trivandrum, Kerala during the Monsoon of 1976.
(b) Photograph showing how the coconut trees we re being uprooted at Punnapra, Kerala due to beach erosion (1967).
(d) Photograph sbowing the upre oted ccconut trees at Vypeen,
Kerala due to the terminal effect cf a seawall.
Fig. 1.1 Sorne exarnples of coastal erosion on the west coast of India.
101
For a ymmetrical distribution, equation C·2 wiU give the median size but for an asymmetrical
distribution, M will be the most reliable estima.e of the q, mean- Thus S and Mare perhaps the best estimates of the standard deviation, IJ" and cf> mean, !.I. for describing a unitnodal sediment grain size distributionA comrnon metbod to calculate S and M is shown in Fig. Co3· In this figure, size data have been plotted
as cumulative distribution on log probability paper in such a way that cf> and percentage coordinates of a
point on the curve indicate the percentage of coarser than a given cf> size. The sizes associated with 84 per
cent and 16 per cent finer by weight are interpreted directly to calculate S and M (ref. land 2).
References
Hobson, R.D., ]977, "Review of Design Elements for Beach-Fill Evaluation", U·S· Army Corps of
Engineers, Coastal Engineering Research Centre, Fort Belvoir, Va- Teehuical Paper No- 77-6.
2
James, W· R·, 1975, "Techniques in Evaluating Suitability of Borrow Material for Beach Nourishment" ,
TM-60, U· S· Army Corps of Engineers, Coastal Engineering Research Centre, Fort Belvoir,
Virginia-
5
'nONE CREST
PROFILE
M.H.W.
A - NORMAL WAVE ACTION
_
PROFIL~
ACCRETION
......
C -
STORM TlDE
......
.......
~---_' _t
M.H.W.
STÖR'M"'WAvlf:-:::'::,:,:,:,::,::~,:,:,::~,,;;,:;;
.....
ATTACK
ON FOREDUNE
-"";'.' ~ __ -_:_
ACCRETION
PROFILE
· "12
F Ig.:
•
Schematic diagram showiog attack of storm waves
00
A
beaches aod duoes (ref. 43).
_
22
/'
.~
20
18
6
4
'2
~
.-
Sw
r-,<,
.......
Sx
I
-
~
r-,<,
r------.
r-,
<,"'-
Sy ..........
•
\
-,
::::::--.....:
~
~
Sap
\ ·
...J
\
4
---
\.
2
...J
-.........
I-
,•
\
6
o
--'r-
i\
Q
UI
·
\
\
\,
'2
I-
--
----~-----
8
>
UI
I
DESIGN WATER LEVEL INCLUDING
SURFACE - WAVE SETUP
r---
0
'C[
v-
,
SA
\
.
-
Se
.
-
'~
I--- MEAN SEA LEVEL ( MSl )
~
-T
-T
I-- CONTINENTAL SHELF
~
100
I
",
~
•
I
I- 20 0
UI
UI
s.w = BREAKING
"x 30 0
I
I-
0..
UI
~
WAVE SETUP
= • .;..COMPONENT SETUP
S.
S.~:.
o
I
II- 50,n
111
~
-,
Sy :. y - COMPONENT SETUP
o 40 0
~
o
LEGEND
-
SA
. Se
ATMOSPHERIC PRESSURE SETUP
= ASTRONOMICAL
::t
I"
o
DrSTANCE IN YARDS
INITIAL
TIDE
WATER LEVEL
I
j
I
10,
20
30
40
50
. DISTANCE. FROM COAST ( NAUT.ICAL MfLES)
Fig; 1.3 Various setup compoaents over the continentaJ sheJf (ref. 43).
60
1
turbulence eind ihereby accelerate erosion further- The erosion by wave action is weU iUusfrated by the
schematic Fig. 1·2· It is easy to understand that an increase in the tidal elevation also increases the -erosion,
as higher tides bring in higher waves causing runup to greater elevations- The worst erosion, therefore,
takes place when a combination of high tides and high and steep waves occurs which Ieads to erosion
profiles as explained in Section 3·1·2 with reference
to Fig.3.3.
.
.
The total rise in the water .level along the coast is the sum of all the components which lead- to
changes in the water level .resulting from a meteorologie al storm plus those which are not related to the
storm but occur simultaneously- Fig. 1.3.(ref. 43) gives the various setup components contributing to the
rise in the sea water level over the continental shelf over and above the initia! water level, These are:
=
=
=
. "S
8"
=
A
A"
o
8.E
=
s·p
Wave setup caused by breaking waves
X-component. of wind setup
Y-component of wind setup
Atmospheric pressure setup
Astronomical tide- "
Y
F
I..
N .6 A
"
1ITill"4~ 6 M
~6-8M"
~
8-IOM
_IO-12M
~"12-14M
E
Fif' 1.4 Probable elevation of maximum storm surge onthe south-east coast of ~Îldia,
=r
.. The wind setup .components jnclude the effects of surface wind-shear
as weIl as the .influence of .earth's rotation-
stresses and .'QQttom-friction
The Iargest component contributing to the rise of the sea level during storms, cyclones or hurricanes
is the wind shear stresses acting over the surface of water- Computational procedures för the determination
of wind setup are given in a number of publications includlng ref· 43· However, it is important to note
that the wind pileup iSrl?roportio!1a1 to the second power of the wind velocity and inversely proportional
to the water depth- .The wind setups or storm surges. during the cyclones and hurricanes are,. therefore,
large st in. the shallow water areas -of the continenta] shelf as in the upper: part of the Bay of Bengal and
in the Gulf Co ast of FloridaFig. 1·4 gives the probable elevations of maximum storm surges on. the south-east coast of India.
These values are -computed based on the assumptions that a sustained wind of 40lm/sec is blowing in an
onshore direction and the centralpressure depression is 35 mb when the storm. is approaching the coastIt is also assumed that the storm surge coincides with the high spring tide (ref- 33). The astronomical
tide, in general, is quite smalt in magnitude, but can be very significant at certain geographical locations
like the Gulfs of Cambay and Kutch on the west coast and the mouth of Hooghly river on the east coast·
Storm surges in combination with astronomical high tides can play havo es in the coastal zone- Information
on the tides can be obtained from the Indian Tide Tables published by the Survey of India, Dehra DunThe atmospheric pressure setup, SL',pexpressed in metres is given by
SL',p= 0·13 (Pn - Po) (1 - rB/r)
where Pn is the pressure at the periphery of the storm, Po is the central pressure in cm of mercury,
r is the radial distance from the storm centre to the computation point on the traverse line and R is the
distance from the storm centre to the point where the region of maximum winds intersects the shorelineRand r should be in the same units say in kilometres, metres or nautical milesThe wave setup Sw mayalso contribute significantly to the total elevation of the water level in
the region shoreward of the breaker zone- It is caused by the inflow of water by wave-breaking and
depends upon the characteristics of. the wave .and the bottorn profile and their mutual interaction, tides,
energy dissipation, bottorn matcrials etc- This is described in detail in ref- 12 which gives the results of
field tests on the German Island, Sylt on the North Sea coast where beach and bottom profiles and wave
characteristics have considerable similarity to conditioris found in the nearshore areas of the east and west
coasts of India. Accordingly, the maximum wave set up, "'l'max may be written as
"'l max =
0·3 Hos
in which Hos is the recorded offshore significant wave height- If HBS the significant breaking
height in the surf zone is used as a reference, the maximum setup can be expressed as
"'l max=0·5
wave
HBS
As long as 110 field data of a similar nature are available for the shores in India, one may use the
above expression in relation to the diagrams of ref. 12· Fig. 1·5 shows schematically the wave setup in
the breaking zone in relation to the tide, beach profile and energy dissipation- Fig. 1·6 shows the wave
setup along the profile in relation to significant wave height-
Lh
Factor ~
= Lb
where Lh is the distance from the breaking point until the wave height has decreased to O.5Hs (HB is the
breaker height). Ls is the wave length at the breaking point, B is the width of the breaker zone and J.1B is
the wave setup at the breaking point. Other terminologies are defined in Figs- 1·5 and 1·6.
Waves in the ocean, however, are irregular having certain spectra as explained in Appendix A·
In wave science and engineering, one distinguishes between a generation. phase when the waves are
.
'
generated ..by-:the winds shearing the
sea surface- Next follows a peak phase
when the wind veloeities are the highest
and the wave heights and periods
reach their maximurn valnes- When
winds start slacking, the wave heights
gradually decrease whereas the average
periods continue to increase because
the short period waves Iose their energy
most rapidly and attenuate- This is
called the attenuation phase- When the
waves reach the shore they mayor
may not break but, in any case, they
runup on the beach- Wave breaking
and uprush are dealt-with in Sections
3.1·3, 3·3·1 and in Appendix B.
HW
TmE WATERLEVEl.. ~
~
PERIOOICAL CHANGE
OF THE PROFILE
• t
BREAKING ZONE
E.NERGV DISSIPATION
The uprush or runup elevation
WAVE SET-UP
IN THE
depends upon the wave characteristics,
BREAKING ZONE
bottorn and beaeh geometry, friction
and permeability characteristics- Natural sandy beaches may be considered
Fig. 1.S Wave setup in a breaking zone in relation 10 tides, beach profile
and energy dissipation (ref. 12).
hydraulically smooth and impermeableAlthough they are not exactly straight,
their geometry is usuaUy simple and may in cross-section, be approximated by a straight line or by two
straight lines-one for lower part and the other for upper part of the beach. Sometimes thc beach
may have a gentle slope in the middleThe uprush on beaches and coastal structures is discussed in detail in Appendix B· For smooth
slopes (beaches) Figs- B·I to B·8 give diagramrnatic representations from which it can be secn that
maximum runup or uprush occurs for the slopes of 1 in I to 1 in 2· For rough slopes, e-g-: rock mounds or
revetments, the uprush decreases depending upon the character of the roughness as explained in Table Bvl .
Appendix B also indicates how it is possible to evaluate the uprush by irregular waves from the known data
for regular waves (Fig. B.l3).
_l_
140 Ho,s
HW
Fiç. 1.6 Wave setup along a beach profile in terms-of significant wave height (ref. 12'.
lÓ
1.4
Littoral
drift harriers,
natural
and manmade
conditions
in India
India has a long shoreline characterized by varieties of coastal features like rocky headlands, coral
reefs and reef-like structures, tidal inlets, estuaries, lagoons, bar ri er islands, bays etc. Such coastal features
of ten give rise to adverse conditioris affeeting the shore stability as they would act as complete or partial
littoral drift barriers thereby prevenring the drift of the material to downdrift shores which, as aresult,
will be subjected to erosion . Figs- 1·7 and 1·8 show a' few typical examples of such natural structural
barriers found on the Indian shores and Fig- }·9 shows similar barriers caused by man-made structures
which also include a group of groins (Fig. 1.10). One of rnan's worst destructive actlvities on the beaches
is the cxcavation and removal of thc beaeh material for land or road fill or for other construction purposesSueh a lack of understanding of the most important principle of conservation is of common occurrence
all over the world as also in IndiaBEACH
ERODES
HERE
DUE TO
PROMONTORY
FUNCTIONING
A LlTTORAL
DRIFT
PROMONTORY
AS
BARRIER
DRIFT
EXAMPLES:
MOPLA
SHORELINE
BAY,
WALTAIR
I
POINT,
ANDHRÀ PRADESH
__
--- -.
LlTTORAL
DRIF'T
._------:O:NJ
LlTTORAL
DRIFTS
DRIFT
ON
INSTEAD
MATERlAL
ROCK REEF
FROM
RIGHT
PAST "HARD POINT" (. ROCK OUTCROP)
OF NOURISHING
DOWN
DRIFT
BEACH
EX.AMPLES :
CANNANORE,
CAPE
KERALA
COMORIN EAST,
PUDIMADAI
TAMILNADU
Fig. 1.7 Natura! Iittoral drift barriers and headlands,
Fig. 1.11 shows how a natural inlet or an estuary may interrupt the longshore drift thereby causi~g
downdrift crosion- This type of situation is very frequently seen both on the east and ",:,estco~sts of IndiaAs it is known, sornc material wilt always bypass the inlet and this proeess m~y be assisted either ?y the
inlet eurrents or by the presencé of bars or by a combination of both- The vanons degrees- of effectiveness
11
ISLAND
FORMATION
UP HERE
SHDRELINE
LlTTDRAL
-
---~
EROSJON
EXAMPLES~
MALPE (IN FDRMATlON).
I(ARNATA~A.
TUTlCDRIN , TAMILNADU.
UYTOAAL
( RECURVED
EROSION
HEAO
LA~D
LlTTORAL.
EXAMPLES:
KAKINADA
DRIFT
I
MACHILIPATNAM.
ANDHRA
PRADESH.
Fig. 1.8 Natural Iittoral drift barriers- tombolo and recurved spit.
DRIFT
SHORELINE
.......... ::',',:::
.'
INITlAL
EROSION
SHORELINE
EXAMPLES =
MADRAS HA~BOUR ANO TUTICORIN I;IARBOUR, TAMIL NADU
PARAOIP HARBOUR, ORISSA
MATERlAL
ACCUMULATES
SHOALING ,,:i:'" ,
.,'
,';..
..~:.~::
~.;
\
INITIAL
SHORELINE
EXAMPLES:
PORBUNDAR, GUJARAT
RATNAGIRIJ MAHÄRASHTRA
OETACHED BREAKWATE,R
WHICH COULD BE A SHIPWRECK
EROSION.
ACCRETION
EXAMPLES:
VISAKHAPATNAM
. INITIAL SHORELINE
I
ANOHRA PRAOESH
Fig. 1.9 Effectof man-made Iittoral drift harriers.
LlTTORAL
SHORELINE
DRIFT
SHORELINE BEFORE GROINS
EROSION .
EXAMPLES:
MOPLA
'BAY, KERALA
GOKARN, KARNATAKA
Fig. 1.10 A group of groios used as Iittoral drift barriers.
of such a transfer system are described in ref- 4· Some inlets, particularly those with very strong ebb currents,
are poor bypassers and therefore, they cause severe downdrift erosion- This condition is very widespread
in India as compared to the other littoral countries, due to the fact that ebb currents become very strong
during the monsoon season- This would Bush the littoral drift material farther offshore where it settles
and may get lost forever from the shoreOther inlets have large bars which are formed by the combined effects of littoral currents and the
inlet ebb currents- They facilitate bypassing of a major part, if not all, of the material drifting alongshoreSuch natural bar- bypassing systems are found in very large numbcrs on the Indian shorcs- Examples of
this type of offshore bars are given in Fig- 1·11· However, natural bar bypassers are undesirable for navigation
beeause the shoals or bars cause obstruction to free navigation from the bay or lagoon to the sea- During
the recent years, our knowledge and understandrng of the associated physieal processes have advanced
considerably and such problems ean be solved by introducing proper dredging or by constructing suitable
jetties or both as illustrated in Fig. 1·12· Such .improvements invariably cause erosion or incrcase the
existing erosion on the downdrift side of the inlet- -Examples of such occurrcnccs are numerous all over
the world including India (refs- 3 and 4). As indicated in Fig· 1.12, we find some intcrcsting examples on
both east and west coasts of India such as the dredged entrance of Cochin Harbour (38 ft- deep at ML W)
and thc 57 ft- deep dredged channel with groin and sand-trap-protection of the Visakhapatnam Harbour
including sand-bypassing by pumping- Both these cause severe downdrift erosionAn interesting example of the intermittent natural bypassing is found at Bengre, a fishing village near
Mangalore in the Karnataka State (Fig. 1.13). Although located close to the tidal Netravati and Gurupur
rivers, the shore has been relatively stabie for a long time (ref. 34). This undoubtcdly is as a result of
natural bypassing of material from the river along an outer sand bar, particularly during thc SW monsoon
(May to October). But a temporary slow down in this natural bypassing process may intensify thc existing.
beach erosion problemFig. 1·14 indicates how a jetty and channel improvement can cause considerablc crosion- Such an
crosion often does not take place immediately after thc establishment of such a littoral drift barrier It
may take a few ycars bcfore it starts accentuating thc problem- This is largcly due to changes in wave
characteristics caused by diffraction of waves (spreading of waves) resulting in the deercase of wave stcepness
therebyeausing a tempoary transport of material from the nearshore bottom towards the beach. This leads
to a temporary stabilization of the beach- Reference is made to Section 3·1.2' for the beach and bottom
profiles under the influence of storm waves and swclls- However, as soon as thc limited quantity of
14
LJTTORAL'
DRIFT
EBB
BARRIE R BEACH
, '··~~~~;~·R:.'
BE2~:~;:":;JU)·
FLOOD
FLOW
BAY OR LAGOON
:.:?~~9~t~}?:~
INLETS WITH LARGE TIDAL P.RISMS OAUSE EROSION BECAUSE LlTTORAL
DRIFT MA'rERIAL
JETTED FAR OUT IN THE OC,EAN. OR IN THE BAY WHERE IT IS ,DEPOSITED IN SHOALS
IS
EXAMPLES:
DEVAG~R~ , VIJAYA DURG I MAHARASHTRA.
EBB
FLOW
LITTORAL
DRIFT
SHOAL
FLOOD
INLETS WITH SMALLER, TlDAL
DRIFTS ACROSS, THE CHANNEL
FLOW
PRISMS CAUSE LESS OR NO ,EROSION DOWN, DRIFT
ON AN OCEAN BAR
EX'AMPLES:
BAYPORE, KERALA
HONNAVAR• COONDAPURI 'KARNATAI
CHILKA LAKE INLETS, ORISSA
Fiç. 1.11 Some problems of littoral drift at tidal inlet~.
AS MATERlAL.