Salts Transport in Alkali Soil Reclamation by Gypsum and Prediction of Na Leaching in Field in China
Bạn đang xem bản rút gọn của tài liệu. Xem và tải ngay bản đầy đủ của tài liệu tại đây (251.59 KB, 13 trang )
Journal of Water and Environment Technology, Vol. 7, No. 2, 2009
Salts Transport in Alkali Soil Reclamation by Gypsum
and Prediction of Na Leaching in Field in China
Yuji SAKAI*, Shohei SHITARA**and Masayoshi SADAKATA*
* Department of Environmental Chemical Engineering, Kogakuin University, Tokyo 192-0015,
Japan
**Department of Chemical System Engineering, The University of Tokyo, Tokyo 113-8656, Japan
ABSTRACT
We examined the mechanism of alkali soil reclamation by gypsum from the change in hydraulic
conductivity and the solute transport in soil. Solute transport mechanism was investigated by
using a soil column equipped with tensiometers and four-electrode sensors (FES). Moreover, the
pH and EC were measured, and quantitative analysis of the cations (Na+, Ca2+, Mg2+ and K+) and
the anion Cl- in leachate was carried out. As a result, the initial Na leaching was confirmed by
FES measurement, EC of leachate and quantitative analysis of leachate. Correlation coefficients
between all the parameters (pH, EC, cations (Na+, Ca2+, Mg2+ and K+) and Cl-) were confirmed,
to different levels of significance (P value < 0.01).
Lastly, the water content balance and the evapotranspiration by Penman-Monteith method in the
paddy field predicted the soil reclamation time, taking into consideration the meteorological data
and the column experimental results. Consequently, it could be predicted that all salts in case of
0.5 wt% application and almost salts (97%) in case of 1.0 wt% application are leached by the
end of October.
Keywords: alkali soil, China, gypsum, Na leaching, prediction, solute transport
INTRODUCTION
About 23% of the total cultivated area (1.5×10⁷ km2) (Massoud, 1981) of the world is
saline soil, and saline and sodic soils cover about 10% of all potentially arable lands
(Szabolcs, 1989). Moreover, about 25% of all irrigated land has been affected by salts
(Suarez and Rhoades, 1991). In countries with arid and semiarid regions, the decrease in
agricultural production due to excessive salts is a very serious problem. This is because
insoluble salts that have accumulated in soil obstruct the growth of vegetation due to the
osmotic pressure they exert. Moreover, in saline soil, accumulation of monovalent
cations (mainly Na+) causes deterioration of the soil physics, due to the dispersion and
swelling of clay, and this makes it difficult for plants to grow. These processes adversely
affect the water penetration, the infiltration speed, and the moisture transport property of
the soil, all of which are involved in soil moisture maintenance (Shainberg and Levy,
1992). Therefore, leaching with large amounts of water is used to improve this type of
soil. However, a natric layer of low permeability is generated by Na adsorption to the
surface of the soil particles in the salts accumulation process. As a result, there is a
possibility of soil erosion, because this not only causes difficulties in the removal of
salts by leaching due to the decrease in water permeability, but it also increases the
outflow water on the soil surface. Therefore, the use of soil amendments such as Ca
compounds is the generally used method that is effective. Moreover, it is known that the
water penetration of clay strongly depends on the concentration and the composition of
the soil solution, and, in general, decreases when the soil solution has a low
Address correspondence to Yuji Sakai, Department of Environmental Chemical Engineering, Kogakuin
University, Email:
Received February 6th, 2009, Accepted February 25th, 2009
- 121 -
Journal of Water and Environment Technology, Vol. 7, No. 2, 2009
concentration and a high ESP (Quirk and Schofield, 1955).
In recent years, the air, water and soil in China have been polluted by economic and
industrial development. Carbon dioxide (CO2) emissions from fossil fuel combustion
are estimated to lie between 2,050 and 2,445 million tons of CO2 per year. CO2
emissions from industrial processes are estimated to lie between 81 and 104 million tons
per year (World Bank, 2004). Moreover, sulfur dioxide (SO2) emissions increase as coal
consumption increases, and these emissions not only cause acid rain, but are also
harmful to humans and vegetation. However, desulfurization technologies such as flue
gas desulfurization (FGD) of coal-fired power plants have not been put into widespread
use because of economical and technological problems. On the other hand, in
northeastern China, the amount of salt-affected soil is increasing due to increases in the
evaporation rate and excessive cultivation. In order to solve these air pollution and soil
desertification problems simultaneously, Sakai et al. (2002, 2004, 2008) have reclaimed
alkali soil with gypsum from FGD processes in China. Concretely, desulfurization
gypsums from wet, simple-wet, and semi-dry FGD process and bio-briquette ash have
been reclaimed in Shenyang of China since 1996. Moreover, these soil reclamation
methods have performed in Tianjin, Inner Mongolia (Wang et al., 2008), Ningxia
Province of China (Wang et al., 2009). They showed that gypsums from FGD processes
and bio-briquette ash are effective at reclaiming alkali soil. Moreover, we quantified the
metal (B, Cr, Mn, Ni, Cu, As, Cd, Pb) contents in soil, FGDG (FGD gypsum), and corn
grains for the safety confirmation. Consequently, there was no effect of gypsum
application on the metal content in the corn grains. Almost all of the metal contents
were lower than the standard values set by FAO/WHO for human intake (Sakai et al.,
2004).
A simulation model based on a numerical solution to equations for moisture and solute
transport in soil has been developed by the USSL (US Salinity Laboratory, 1954). These
models can be applied to a wide variety of fields such as soil and moisture control, but
forecasts by these models depend strongly on the input parameters. The soil
permeability properties that characterize water retention and infiltration, the transport
rates of chemicals, and the transport and chemical parameters that influence the
distribution of the solid and liquid phase are very important for these models (Sakai,
2002). It is very difficult to apply these models to actual test fields, as it is necessary to
measure all these values to perform calculations with these models.
Therefore, in order to evaluate this environmental reclamation technology, it is
necessary to develop effective methods for predicting salts transport in fields in China.
The objective of this study was to examine the change in hydraulic conductivity that
occurs as a result of adding the gypsum, and to examine the transport of solutes in alkali
soil reclamation. The inner hydraulic conductivity and the transport of salts such as
cations (Na+, Ca2+, Mg2+ and K+) and Cl- in a column were investigated by using a
tensiometer and a four-electrode sensor, and the amounts of these salts in soil and
leachate were measured by ICP-MS. Moreover, by taking the water balance for
evapotranspiration in test fields in China into consideration, salt leaching in fields could
be predicted using the results of the soil column experiment.
MATERIALS AND METHODS
Soil sampling and soil chemical analysis
Soil samples were collected at Kangping (42゜
70' N, 123゜
50' E), which is located about
- 122 -
Journal of Water and Environment Technology, Vol. 7, No. 2, 2009
130 km north of Shenyang in northeastern China. Alkali soil reclamation with
by-products from the flue gas desulfurization process has been performed there since
1996 (Sakai et al., 2002, 2004; Sakai, 2008). Soil samples from the surface to a depth of
20 cm were air-dried and passed through a 2 mm sieve. The pH, EC, and solution
cations were measured by using 1:5 water extracts. A pH meter (HM-14P, TOA
Electronics Ltd.) was used for the pH measurement and an electrical conductivity meter
(B-173, Horiba Ltd.) was used for EC measurement. The cations and anions in the soil
solution (1:5 water extraction) were measured by Inductively Coupled Plasma Mass
Spectroscopy (ICP-MS) (HP4500, Yokogawa Co., Ltd.) and ion chromatography
(LC-6A, Shimadzu Co., Ltd.), respectively. The cation exchange capacity (CEC) was
determined using 1N NaOAc at pH 8.2. In this research, pure gypsum was added to the
alkali soil. The amount of CaCO3 was measured by using 1.0 g of soil sample placed in
a closed flask. One milliliter of 2N H2SO4 was added to react with the CaCO3, and the
pressure of the evolved CO2 in the headspace was measured immediately using gas
chromatography (GC-8A, Shimadzu Co., Ltd.). The exchangeable sodium percentage
(ESP) was calculated from the sodium adsorption ratio (SAR) of the soil solution (US
Salinity Laboratory Staff, 1954). The soil chemical properties are given in Table 1.
Table 1- Chemical properties of Chinese soil used in the experiments.
Property
Value
pH [H2O]
10.5
EC (Electrical conductivity) [dS/m]
0.79
CEC (Cation exchange capacity) [(+) cmol/kg]
8.4
CaCO3 [g/kg]
22.5
ESP (Exchangeable sodium percentage) [%]
25
Column experiment measurements
Solute transport measurement
Soil under 2 mm in size was mixed with gypsum at application rates of 0.5 wt% and 1.0
wt%. Alkali soil and gypsum were mixed uniformly and were packed in an acrylic ring
with an outer diameter of 60 mm, inner diameter of 50 mm, and height of 20 mm at a
bulk density of 1.53 g/cm3. The acrylic rings were filled up to a height of 20 cm.
Degassed water was poured onto the top of the column at a rate of 1.0×10⁻³ to 2.0×
10-3 cm3/s using a peristaltic pump (SJ-1211L, Atto Corp.). The lower parts of the
column, the porous cup, and the experimental water had been degassed in desiccators
for about one hour.
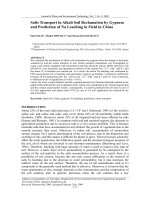
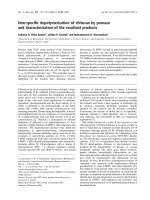
Tensiometers and four-electrode sensors (Inoue at al., 2000) were inserted into the
column at depths of 5, 9, 13 and 17 cm, and at 5 and 17 cm (where soil surface z = 0
cm), respectively. The tensiometers were equipped with a transducer (HTVN-001,
HI-NET Co., Ltd.) in order to measure the pressure (cmH2O) of the soil in the
experimental column. Transducers (TD 1 (z=5 cm), TD 2 (z=9 cm), TD 3 (z=13 cm),
and TD 4 (z=17 cm)) connected to four tensiometers and two four-electrode sensors
(FES; FES 1 (z=5 cm) and FES 2 (z=17 cm)) were connected to a data logger (CR10X,
Campbell Scientific, Inc.) with a PC (Fig.1). The measurements could be controlled in
the program by the application software (PC208W, Campbell Scientific, Inc.). Moreover,
in order to examine the soil solution that seeped from the lower part of the experimental
column, we collected the infiltration solution at constant time intervals by using a
fraction collector (CHF122SB, Advantec Toyo Kaisha, Ltd.). The water volume was
- 123 -
Journal of Water and Environment Technology, Vol. 7, No. 2, 2009
measured at each time interval. The ion concentrations (Na+, Ca2+, Mg2+, K+ and Cl-) in
the effluent solution were quantified by using ICP-MS. The soil pH and soil EC of each
solution were also measured. These experiments were performed in triplicate at 25 °C.
Electrical conductivity measurements
Direct measurement of the salinity of soil can be performed by using buried porous
electrical conductivity sensors, four-electrode probe systems, electromagnetic induction
sensors, or time domain reflectometry systems (Rhoades and Oster, 1986; Rhoades,
1992). In particular, a four-electrode probe is suitable for observing the salt
concentration in a column with a water flow because the response is good. The
four-electrode sensor developed for this study was described in detail by Inoue and
Shiozawa (Inoue and Shiozawa, 1994). In our research, a four-electrode sensor was
used as an indicator of the total salt concentration in the soil column, to observe the
runoff rate of salts.
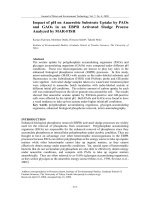
The four-electrode sensor consisted of four stainless steel rods inserted in parallel into
an acrylic column with an inner diameter of 50 mm, outer diameter of 60 mm, and a
height of 20 mm (Fig. 2). This structure exposes 18 mm of the point of the current
supply electrode and 12 mm of the point of the voltage measurement electrode while
insulating the other parts, and measures the electric conductivity of the soil in the center
of the column. The inner and outer diameters of the stainless steel rods were 8 mm and
16 mm, respectively, and the ratio (I/V2) of the current of an outer electrode (I) to the
potential difference (V2) of an inner electrode was measured. This ratio is inversely
proportional to the specific resistance of the medium, and proportional to the electric
conductivity. Because hardly any current flows to a voltage measurement electrode
inside the column, the influence of local contact resistance in the current electrode
surroundings, etc. can be avoided. However, it is necessary to have a high frequency
exchange current in the current supply electrode to avoid polarization of the electrode.
Current (I) that flows in the current supply electrode is obtained from the relation I=
V1/Rf by putting a resistance (Rf) of known value in the circuit, and measuring the
potential difference V at both ends. Therefore, the ratio (V1/V2) of the voltages V1 and
microtube
pump
data logger
(CR10X)
z=0cm
four-electrode
sensor
porous cup
+ transducer
column ring
water tank
5cm
V1
Rf
porous cup
relay
(z=5,17cm)
(z=5,9,13,17cm)
1kHz
20cm
V2
transducer
voltage measurement electrode
50.00 mm
data logger
fraction collector
electric current supply electrode
60.00 mm
PC
Fig. 1- Schematic illustration of the
experimental column setup.
Fig. 2 - Four-electrode sensor and connection
with data logger.
- 124 -
Journal of Water and Environment Technology, Vol. 7, No. 2, 2009
V2 (V1: voltage applied to reference resistance, V2: voltage applied to measurement
electrode for voltage) is proportional to the electric conductivity of the medium. This
measurement was made by a data logger CR10X and a relay controller.
RESULTS AND DISCUSSION
Change in hydraulic conductivity resulting from the addition of gypsum to the soil
In soil with salt accumulation, such as alkali soil, excessive Na carbonate or bicarbonate
cause an increase in the pH of the calcareous soil. This degrades the physical properties
such as the breakdown of aggregated soil particles, and affects the growth of plants due
to a decrease in the permeability (Suarez et al., 1984; Gupta and Abrol, 1990). Gypsum
amendment to sodic soils can increase the permeability by means of both EC and cation
exchange effects (Loveday, 1976). In alkali soil reclamation, it is very important for the
Na soil particles to form a soil aggregate, and this can be achieved by adding Ca soil
amendments such as gypsum. This can result in improved soil permeability. In our
previous research, corn production was confirmed in plots in China with 0.5 wt% and
1.0 wt% added FGDG (Sakai et al., 2002). The hydraulic conductivity was dramatically
increased with a decrease in the dry density (1.2, 1.4, and 1.6 g/cm3) and an increase in
the gypsum application rate (0, 0.5, and 1.0 wt%) (Sakai, 2003). Therefore, it has been
understood that gypsum addition and dry density have a large influence on the water
penetration.
In the column transport experiment, the change in hydraulic conductivity was
investigated in columns with both 0.5 wt% and 1.0 wt% applications, by using four
transducers (TD 1, TD 2, TD 3 and TD 4). Each hydraulic conductivity between porous
cups was determined as K1-2, K2-3, K3-4 and the total hydraulic conductivity was
determined as K1-4. The changes in K1-2, K2-3, and K3-4 were high during the initial
stage, from 0 to about 1.5 PV (pore volume, 1 PV=172.3 cm3), and decreased after that
initial stage. All hydraulic conductivities at the 1.0 wt% application rate were higher
than those at the 0.5 wt% application rate.
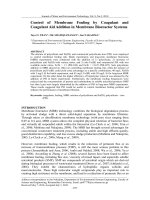
From Fig. 3, it could be confirmed that the hydraulic conductivity (K1-4) between TD 1
and TD 4 increased rapidly and then decreased, from about 0.25 PV for the 0.5 wt%
application and from about 0.76 PV for the 1.0 wt% application. It took constant values
from about 1.3 PV in both cases. Moreover, the hydraulic conductivity at the 1.0 wt%
application rate was higher than that at the 0.5 wt% one.
4.0
0.5wt%
3.5
1.0wt%
K1-4 [×10-4 cm/s]
3.0
2.5
2.0
1.5
1.0
0.5
0.0
0
1
2
3
4
5
PV [-]
6
7
8
Fig. 3 - Change in hydraulic conductivity (K1-4) in the column (0.5 wt%, 1.0 wt%).
- 125 -
Journal of Water and Environment Technology, Vol. 7, No. 2, 2009
Change in salts transport in soil column
In alkali soil improvement, it is very important to understand the cation transport
mechanism, in order to remove sodium from the surfaces of soil particles amended with
soil amendments such as gypsum. Therefore, the movement of salts obtained by pouring
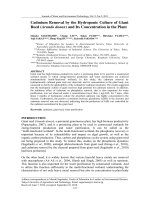
water over alkali soil with added gypsum was evaluated. Fig. 4 shows the results from
the four-electrode sensors at depths of 5 cm and 17 cm at application rates of 0.5 wt%
and 1.0 wt%. In this research, because the sensors could be used to indicate salt
movement in the column, calibration between the solution concentration and the volume
of water content (Inoue et al., 2000) could not be performed. The ECv value in the
vertical line was calculated by gradually introducing CaCl2 solution (0.00230, 0.0105,
0.0172, 0.0552, 0.100 mol/dm3) after the end of the flow experiment. From Fig. 4, the
value of ECv at the upper sensor that was 5 cm below the soil surface decreased slightly
and the lower sensor at a depth of 17 cm indicated early leaching of salts in the case of
the 0.5 wt% application. The results of the lower sensor showed that most of the salts in
the soil could be leached in 1 PV and after that the ECv only decreased slightly. These
results confirm that most of the soluble salts in the upper parts were leached past the
lower sensor at about 2 PV (about 350 cm3 of effluent) in the case of the 0.5 wt%
application. In the case of the 1.0 wt% application, the sensor value of the upper part (5
cm depth) was higher than that for the 0.5 wt% application. Moreover, the behavior of
both lower sensors looks like the EC behavior in Fig. 5. It could be confirmed that the
difference of behavior between lower sensor and EC of leachate is due to time
difference (Figs. 4, 5).
The changes in the concentrations of all the different ions can be discussed. At the
beginning of the leaching process for both the 0.5 wt% and the 1.0 wt% applications,
the Na concentration in the leachate increased and then decreased drastically (Fig. 6).
This indicates Na+ leaching due to a Na+-Ca2+ exchange reaction resulting from the
gypsum application. Moreover, a difference between the 0.5 wt% and 1.0 wt%
application rates could be confirmed. The necessary water volumes for Na+ leaching
from the 0.5 wt% and 1.0 wt% applications were about 1.2 PV (200 cm3) and about 2.3
PV (400 cm3), respectively (Fig. 6).
The Ca2+ behavior in both cases was similar (Fig. 7). Naturally, the total amount of Ca2+
was larger for the 1.0 wt% application than the 0.5 wt% one. In both cases, the Ca2+
concentration increased gradually from the beginning of leaching, decreased after a
peak, and then increased and decreased again. This behavior indicates that the initial
leaching is like Na+ leaching, and the surplus Ca2+ is drained slowly because the Ca2+
ion is divalent. Finally, almost depletion could be confirmed at about 3.0 PV (520 cm3)
and 8.1 PV (1400 cm3) of total leachate for 0.5 wt% and 1.0 wt% applications,
respectively. The complete leaching time of Ca was longer than that of Na.
The Mg2+ behavior was similar in the 0.5 wt% and 1.0 wt% cases (Fig. 8). The Mg
concentration increased gradually from the start of leaching and decreased gradually
after a peak. Almost all the Mg2+ had leached from the 0.5 wt% and 1.0 wt%
applications by about 2.3 PV (400 cm3) and about 8.1 PV (1400 cm3), respectively. In
both cases, K+ behavior was similar to that for Mg2+ (Fig. 9). Sodic soil reclamation
requires the removal of most exchangeable Na+ and its replacement by Ca2+ or Mg2+
and K+ in the soil of the root zone (Aydemir and Najjar, 2005). The Cl- ion is a
non-adsorptive solute in the presence of sulfate ions, which have higher adsorption
regardless of the soil type. Therefore, the Cl- behavior was similar to the water
movement in the column. The water volume for Cl- leaching was about 0.58 PV (100
- 126 -
Journal of Water and Environment Technology, Vol. 7, No. 2, 2009
cm3) in the 0.5 wt% application and about 0.75 PV (130 cm3) in the 1.0 wt% application
(Fig. 10).
The pH of leachate increased gradually at first, and then took a constant value from
about 2.3 PV (400 cm3) (Fig. 11). This is indicative of the behavior of the ions in the
leachate. The pH value in the 1.0 wt% application was lower than that in the 0.5 wt%
application because of the lower pH value of gypsum.
Finally, the change in leachate volume over time was determined. It was found that the
leachate volume for the 1.0 wt% case was larger than that for the 0.5 wt% one (Fig. 12).
This is in agreement with the hydraulic conductivity result (Fig. 3).
The initial increase and decrease in the FES shows leaching of mainly Na+ (Figs. 4, 6).
The constant FES value observed after the initial decrease (Fig. 4) was confirmed to be
due to Ca2+, Mg2+ and K+ (Figs. 7, 8, 9). This shows that the Na+-Ca2+ exchange
reaction on the soil colloid surface occurred by water infiltration. This indicates the
stronger adsorption power of two valence ions over single valence ions (Bresler et al.,
1982).
20
0.5wt% (z=5cm)
0.5wt% (z=17cm)
1.0wt% (z=5cm)
1.0wt% (z=17cm)
18
16
0.5wt%
1.0wt%
8
EC [dS/m]
ECv [dS/m]
14
10
12
10
8
6
4
6
4
2
2
0
0
0
1
2
3
4
5
PV [-]
6
7
0
8
Fig. 4 - Change in ECv in upper (z=5 cm)
and lower (z=17 cm) parts of the column
(0.5 wt%, 1.0 wt%).
2
3
4
5
PV [-]
6
7
8
Fig. 5 - Change in EC of leachate
(0.5 wt%, 1.0 wt%).
200
16
180
0.5wt%
160
1.0wt%
0.5wt%
14
1.0wt%
12
Ca conc. [mmol/dm3]
140
Na conc. [mmol/dm3]
1
120
100
80
60
40
10
8
6
4
2
20
0
0
0
1
2
3
4
5
PV [-]
6
7
8
0
Fig. 6 - Change in Na+ concentration
of leachate (0.5 wt%, 1.0 wt%).
1
2
3
4
5
PV [-]
6
7
8
Fig.7- Change in Ca2+ concentration
of leachate (0.5 wt%, 1.0 wt%).
- 127 -
Journal of Water and Environment Technology, Vol. 7, No. 2, 2009
25
0.3
0.5wt%
15
K conc. [mmol/dm3]
Mg conc. [mmol/dm3]
0.5wt%
0.25
1.0wt%
20
10
5
1.0wt%
0.2
0.15
0.1
0.05
0
0
0
1
2
3
4
5
PV [-]
6
7
8
0
Fig. 8 - Change in Mg2+ concentration
of leachate (0.5 wt%, 1.0 wt%).
1
2
3
4
5
PV [-]
6
7
8
Fig.9- Change in K+ concentration
of leachate (0.5 wt%, 1.0 wt%).
30
0.5wt%
1.0wt%
25
Cl conc. [mmol/dm3]
Cl conc. [mmol/dm3]
30
20
15
10
5
25
20
15
10
5
0
0
PV [-]
1
0
0
1
2
3
4
5
PV [-]
6
7
8
Fig. 10 - Change in Cl- concentration of leachate (0.5 wt%, 1.0 wt%).
8.5
350
0.5wt%
300
1.0wt%
250
pH [-]
time [h]
8
7.5
200
150
100
0.5wt%
50
1.0wt%
0
7
0
1
2
3
4
5
PV [-]
6
7
0
8
Fig. 11 - Change in pH of leachate
(0.5 wt%, 1.0 wt%).
1
2
3
4
5
PV [-]
6
7
8
Fig. 12 - Relationship between PV and
leaching time (0.5 wt%, 1.0 wt%).
- 128 -
Journal of Water and Environment Technology, Vol. 7, No. 2, 2009
1
1
0.9
0.9
0.8
0.8
0.7
0.7
0.6
0.6
C/C0 [-]
C/C0 [-]
The differences in the leaching rates of all the ions were obtained and they were leached
in the order Cl->Na+>Mg2+>Ca2+>K+ in case of 0.5 wt% and 1.0 wt% application (Figs.
13, 14). Moreover, all ion concentrations in soil before and after the infiltration
experiment were measured. The recoveries were very high (Na+: 98%, Mg2+: 94%,
Ca2+: 83%, K+: 83%, Cl-: 96%) and showed the contribution of the cation exchange
reaction.
0.5
0.4
0.5
0.4
0.3
0.3
0.2
0.2
Na
0.1
Ca
Mg
K
Cl
Na
0.1
Ca
Mg
K
Cl
0
0
0
2
4
PV [-]
6
0
8
2
4
PV [-]
6
8
10
Fig. 13 - Breakthrough curves of all ions Fig. 14 - Breakthrough curves of all ions
(0.5 wt%)
(1.0 wt%)
The correlations between pH, EC, cation (Na+, Ca2+, Mg2+, and K+) and Clconcentrations in leachate were investigated for both application rates. Regression
analysis was performed to investigate correlations using Excel Statistics 2006 (Social
Survey Research Information Co., Ltd.) and the correlation coefficient and level of
significance were calculated. Correlation coefficients were found between all
parameters, at different levels of significance (P value< 0.01) (Table 2). The pH of
leachate had a negative correlation with all other data (EC, Na+, Ca2+, Mg2+, K+ and Cl-).
In particular, the correlation coefficient between Na+ and EC was high (0.939**).
The pH, EC, and ESP of soil reclaimed after the column experiments for 0.5 wt% and
1.0 wt% application rates were 9.1, 0.11 dS/m, and 2.5% and 9.1, 0.13 dS/m, and 2.9%,
respectively. This indicates that the experimental soil was reclaimed by the gypsum.
Table 2 - Correlation coefficients between pH, EC, cation (Na+, Ca2+, Mg2+, and K+)
and Cl- ion concentrations of leachate.
pH
EC
Na+
K+
Ca2+
Mg2+
Cl-
pH
EC
Na+
K+
Ca2+
Mg2+
Cl1.000
-0.557** 1.000
-0.425** 0.939** 1.000
-0.730** 0.661** 0.659** 1.000
-0.648** 0.637** 0.267** 0.747** 1.000
-0.621** 0.691** 0.809** 0.975** 0.735** 1.000
-0.631** 0.621** 0.581** 0.441** 0.253** 0.558** 1.000
**: P<0.01, Correlation coefficients shown in table are significant at P<0.01.
Application of column experiment results to field evaluation
An alkali soil reclamation test using the addition of gypsum has been performed in a
- 129 -
Journal of Water and Environment Technology, Vol. 7, No. 2, 2009
field in China. The outflow of salts according to the amount of moisture infiltrated to
the soil was obtained from the column experiment. Therefore, if the amount of moisture
that infiltrates downward in the test field over a certain period of time can be estimated,
the completion time for leaching of salts from the field can be predicted from the salts
leaching results obtained from the column experiment.
To this end, we predicted the amount of downward or falling infiltration from the water
budget of the field. In the water budget of a SPAC (soil-plant-atmosphere continuum)
(Philip, 1966) such as a forest or a farmland, it is thought that the sphere of the root
covers a range of depths. In the case of our study field, this is assumed to be about 20
cm, from the root depth and the soil profile investigation (Sakai, 2003).
The water balance equation is as follows;
(1)
P + I + Rin = Rout + E + T + F + ΔS
P: precipitation, I: water volume for irrigation, Rin: amount of land surface water inflow,
Rout: amount of surface runoff, E: evaporation rate from ground surface, T: transpiration,
F: falling infiltration, ΔS: change in soil moisture
In equation (1), ΔS can be assumed to be 0 by making the time scale of the water budget
long (eg. 1 year). Moreover, because the irrigation volume of water (I) is assumed as 0
at this moment, the amount of falling infiltration for our test field can be expressed as
follows.
F = P + Rin − Rout − ( E + T )
(2)
Because direct measurement of the evapotranspiration (E+T) on the right of equation
(2) could not be performed, we predicted the evapotranspiration from meteorogical data
and the empirical formula. In our test field in Shenyang in China, corn was cultivated
from April to October every year. Precipitation could be estimated as 490 mm/year from
the precipitation data for Kangping and Shenyang. Moreover, the amount of land
surface water inflow is assumed to be 0. The annual surface runoff was assumed to be
200 mm/year (Tao et al., 2005), and then the Rout/P (runoff percentage, P=490 mm/year)
can be estimated to be about 0.408 in the above equation (2), and equation (2) can be
expressed as follows. In addition, E+T was changed to ET (eq. (3)).
F = 0.592 P − ( E + T ) = 0.592 P − ET
(3)
Estimation of evapotranspiration
When the amount of evapotranspiration from a plant community is estimated from
micrometeorology data, methods for estimating the evapotranspiration by empirical
formulae include the Thornthwaite method (Thornthwaite, 1948), the Blaney-Criddle
method (Blaney and Criddle, 1950), the Makkink method (Makkink, 1957), and the
Priestley and Taylor method (Priestley and Taylor, 1972). However, because these
methods contain many non-theoretical elements, it is difficult to treat these methods as
universal physical methods. Moreover, because physiological responses to the
environment by the plants can not be considered, they are not necessarily suitable for
predicting evapotranspiration in a plant community.
On the other hand, the Penman-Monteith method (Monteith, 1965) is a physical method.
In this method, evapotranspiration in a plant community can be estimated from effective
radiant quantities, dry-bulb temperatures and water vapor pressure. This is the most
widely used and researched method for estimating the amount of evapotranspiration in a
plant community. In the Penman-Monteith method, it is considered that
evapotranspiration from a plant community depends on transpiration through a plant
body.
- 130 -
Journal of Water and Environment Technology, Vol. 7, No. 2, 2009
Finally, we obtain the following equation;
( R − G ) ⋅ s (1 + W )
ET = ni
L{( s + γ *)W + s}
(4)
Rni: isothermal net radiation, G: soil heat flux, s: slope of the temperature of the saturated
steam quantity , W: difference in temperature between the plant community and air,
L: latent heat of vaporization , γ*: wet- and dry-bulb constant
In addition, F can be obtained when the value obtained by equation (4) is substituted for
ET on the right of equation (3).
Evaluation of amount of moisture infiltration in column infiltration experiment
Changes in precipitation, evapotranspiration, and falling infiltration are shown in Fig.
15. In April and May, evapotranspiration was a little higher than precipitation. Falling
infiltration could be calculated by using equation (3) (Fig. 15). As a result, water
infiltration was calculated for July, August and October, but could not be determined for
April, May, June and September (Fig. 15). Next, the sectional area of the column
(2.5×2.5×π cm2) was multiplied by (F) for the falling infiltration and the quantity of
water in the column was calculated (Fig. 16). Consequently, water infiltration from
April to October in our test field was calculated to be 133 cm3. Naturally, the necessary
water volume for the growth of plants is added to plants in semi dry land like this.
Irrigation was performed during seeding time and in the dry period of summer. The
necessary irrigation quantity, which is the amount of supplemental irrigation and
rainwater required for farming corn, has been reported to be 0.075 m3/m2 (Tian et al.,
2003). By using this necessary irrigation quantity, the required water volume in this
column infiltration experiment can be calculated to be about 147 cm3. Therefore, the
total of both the falling infiltration calculated from the precipitation and
evapotranspiration and the calculated necessary irrigation quantity for supplemental
irrigation farming is about 280 cm3. The volume of water required to complete the Na+
leaching in this infiltration experiment was about 212 cm3 in the 0.5 wt% application
and about 288 cm3 in the 1.0 wt% application (Fig. 6). Consequently, it could be
predicted that all salts in case of 0.5 wt% application and almost salts (97%) in case of
1.0 wt% application are leached by the end of October.
120.0
100.0
180
160
140
120
100
80
60
40
20
0
-20
-40
Quantity of water in column [cm 3]
P, E, F [mm]
Precipitation (P) (mm)
Evapotranspiration (ET) (mm)
Falling Infiltration (F) (mm)
Apr
May
Jun
Jul
Month
Aug
Sep
Oct
Fig. 15- Changes in precipitation (P), evapotranspiration (ET), falling infiltration (F)
in test field (F=0.592P-ET (eq. (3)))
- 131 -
80.0
60.0
40.0
20.0
0.0
-20.0
-40.0
Apr May Jun
Jul
Aug Sep Oct
Month
Fig. 16- Change in quantity of water in
column calculated by falling infitration (F)
Journal of Water and Environment Technology, Vol. 7, No. 2, 2009
CONCLUSIONS
In order to evaluate alkali soil reclamation with gypsum, changes in the hydraulic
conductivity and salts transport were examined. Expulsion of the salts after reclamation
was confirmed by the soil column experiment. The initial leaching of Na+ was faster
than the leaching of any of the other salts investigated (Ca2+, Mg2+ and K+) and occurred
during the first stage of the alkali soil reclamation. This was confirmed by the EC
results for the leachate. The Ca2+ behavior after main Na+ leaching indicated that the
movement occurring after the Na+-Ca2+ exchange reaction. Moreover, we confirmed
correlations between the different parameters by correlation analysis, and a strong
correlation was found between Na+ and EC.
We also investigated the application of the experimental data to field predictions. We
could predict the condition of Na+ leaching in a test field, and proposed a method for
predicting the soil reclamation time.
ACKNOWLEDGEMENTS
We would like to express our appreciation to Professor Sho Shiozawa, Professor Masaru
Mizoguchi and Mr. Hiromi Imoto of the University of Tokyo for their assistance in
making the experimental apparatus. This work was supported by JST (Japan Science
and Technology Agency).
REFERENCES
Aydemir S. and Najjar N.F. (2005). Application of two amendments (gypsum and
langbeinite) to reclaim sodic soil using sodic irrigation water. Aust. J. Soil Res., 43,
547-553.
Blaney H.F. and Criddle W.D. (1950). Determining water requirements in irrigated areas
from climatological and irrigation data. SCS-TP-96, USDA, Soil Conservation
Service, Washington, DC.
Bresler E. et al. (1982). Saline and Sodic soils. Principles-Dynamics-Modeling.
Springer-Verlag, New York.
Gupta R.J. and Abrol I.P. (1990). Salt-affected soils: their reclamation and management
for crop production. In: Lal, R., Steward, B.A. (Eds.), Advances in Soil Science 11,
223-288, Springer-Verlag.
Inoue M. and Shiozawa S. (1994). Measurement of Electrical Conductivity in Soil
Columns by the Four-electrode Method and its Application. J. Jpn. Soc. Soil
Physics. 70, 23-28.
Inoue M., et al. (2000). Simultaneous estimation of soil hydraulic and solute transport
parameters from transient infiltration experiments. Adv. Water Resour., 23,
677-688.
Loveday J. (1976). Relative significance of electrolyte and cation exchange effects
when gypsum is applied to a sodic clay soil. Aust. J. Soil. Res., 14, 361-371.
Makkink GF. (1957). Testing the Penman formula by means of lysimeters. J. Inst.
Water Engineers., 11, 277-288.
Massoud F.I. (1981). Salt affected soils at global scale and concepts for control. FAO.
Rome. Italy.
Monteith J.L. (1965). Evaporation and the environtment, Symp. Soc. Exp. Biol. 19,
205-234.
- 132 -
Journal of Water and Environment Technology, Vol. 7, No. 2, 2009
Philip J.R. (1966). Plant water relations: some physical aspects. Annu. Rev. Plant Phys.,
17, 245-268.
Priestley C.H.B. and Taylor R.J. (1972). On the assessment of the surface heat flux and
evaporation using large-scale parameters. Monthly Weather Review. 100, 81-92.
Quirk J.P. and Schofield R.K. (1955). The effect of electrolyte concentration on soil
permeability. J. Soil Sci., 6, 163-178.
Rhoades J.D. (1992). Instrumental field methods of salinity appraisal. In: Topp G.C.,
Reynolds W.D., Green R.E. (Eds.), Advances in measurement of soil physical
properties: bringing theory into practice. SSSA Special Pub. No. 30, 231-48.
Rhoades J.D. and Oster J.D. (1986). Solute content. In: Klute A., (Ed.) Methods of soil
analysis part 1. 2nd ed. SSSA, Madison, WI, 985-94.
Sakai Y., Matsumoto S., Nitta Y. and Sadakata M. (2002). Alkali soil reclamation in
China using gypsum produced in flue gas desulfurization process; a case study. J.
Global Env. Eng., 8, 55-66.
Sakai Y. (2003). Research on Alkali Soil Reclamation in China with Wastes from
Desulfurization Process. PhD thesis, Department of Chemical System Engineering,
The University of Tokyo.
Sakai Y., Matsumoto, S. and Sadakata M. (2004). Alkali soil reclamation with flue gas
desulfurization gypsum in China and assessment of metal content in corn grains.
Soil Sediment Contam., 13, 65-80.
Sakai Y. (2008). Reclamation Technology of Alkali Soil in China by Desulfurization
Gypsum. Journal of the Society of Inorganic Materials, Japan, 15, 242-250
Shainberg I. and Levy G.J. (1992). Physico-chemical effects of salts upon infiltration
and water movement in soils. Interacting processes in soil science. CRC Press.
Boca Raton. Fla.
Suarez D.L. et al. (1984). Effect of pH on saturated hydraulic conductivity and soil
dispersion. Soil Sci. Soc. Am. J., 48, 50-55.
Suarez D.L. and Rhoades J.D. (1991). Soil Salinity, Encyclopedia of soil system science,
Vol. 4, 251-258.
Szabolcs I. (1989). Salt affected soils. CRC Press. Boca Raton. FL.
Tao F., Yokozawa M., Hayashi Y. and Lin E. (2005). A perspective on water resources in
China: Interactions between climate change and soil degradation. Climate Change,
68, 169-197.
Tian Y., Li F. and Liu P. (2003). Economic analysis of rainwater harvesting and
irrigation methods, with an example from China. Agr. Water Manage., 60, 217-226.
Thornthwaite C.W. (1948). An Approach toward a Rational Classification of Climate.
Geogr. Rev., 38, 55-94.
US Salinity Laboratory Staff. (1954). Diagnosis and improvement of saline and alkali
soils. USDA Handbook 60. US Government Printing Office. Washington, DC.
Wang C. et al. (2009). Study on application of by-product from flue gas desulfurization
in reclamation of sodic soils. Journal of Tianjin university of science and
technology, 24, 39-43.
Wang S.J., Chen C.H., Xu X.C. and Li Y.J. (2008). Amelioration of alkali soil using flue
gas desulfurization byproducts: Productivity and environmental quality. Environ.
Pollut., 151, 200-204.
World Bank. 2004. Clean Development Mechanism in China -Taking a Proactive and
Sustainable Approach.
- 133 -