Plants and the k t boundary
Bạn đang xem bản rút gọn của tài liệu. Xem và tải ngay bản đầy đủ của tài liệu tại đây (8.01 MB, 292 trang )
This page intentionally left blank
Plants and the K–T Boundary
The Cretaceous Period of geologic time ended abruptly about 65 million years
ago with global extinctions of life in the sea and on land – most probably
caused by a catastrophic meteorite impact. Although much popular interest
has focused on the fate of the dinosaurs at that time, the plants that existed
in Cretaceous time also underwent extensive and permanent changes, and
they reveal much more about the nature of this devastating event.
In Plants and the K–T Boundary, two of the world’s leading experts in the fields
of palynology and paleobotany integrate historical records and the latest
research to provide a comprehensive account of the fate of land plants during
this ‘great extinction.’ The book begins with chapters on how the geological
time boundary between the Cretaceous and Paleogene periods (the K–T boundary) is recognized with varying degrees of resolution, and how fossil plants
can be used to understand global events some 65 million years ago. Subsequent
chapters present detailed evidence from case studies in over 100 localities
around the world, including North America, China, Russia, and New Zealand.
The book concludes with an evaluation of the various scenarios for the cause
of the K–T boundary event and its effects on floras of the past and the present.
This book is written for researchers and students in paleontology, botany,
geology, and Earth history, and will be of interest to everyone who has been
following the course of the extinction debate and the K–T boundary paradigm
shift.
D O U G L A S J . N I C H O L S is a Research Associate with the Department of
Earth Sciences at the Denver Museum of Nature & Science and a Scientist
Emeritus with the United States Geological Survey (USGS). He received his Ph.D.
in geology from The Pennsylvania State University before pursuing a career that
has included university teaching, the oil industry, and 30 years of research with
the USGS. Dr Nichols is a palynologist, with research interests in the fossil
pollen and spores of Upper Cretaceous and Paleogene rocks, with emphasis
on biostratigraphy, paleoecology, evolution, and extinction events. In 2005 he
received the Meritorious Service Award from the US Department of the Interior
for his research on the biostratigraphy of nonmarine rocks and the CretaceousPaleogene (K–T) boundary in western North America. Dr Nichols is the author
or coauthor of more than 140 scientific papers and has served as editor of
the journals Palynology and Cretaceous Research.
K I R K R . J O H N S O N is Vice President of Research & Collections and Chief Curator
at the Denver Museum of Nature & Science (DMNS). He joined the DMNS in 1991
after earning his doctorate in geology and paleobotany at Yale University.
Dr Johnson’s research focuses on Late Cretaceous and early Paleogene fossil
plants and landscapes of the Rocky Mountain region and is best known for
his research on fossil plants, which is widely accepted as some of the most
convincing support for the theory that an asteroid impact caused the extinction
of the dinosaurs. He has published many popular and scientific articles on topics
ranging from fossil plants and modern rainforests to the ecology of whales and
walruses, and coauthored the books Prehistoric Journey: A History of Life on Earth and
Cruisin’ the Fossil Freeway.
Plants and the K–T
Boundary
D O U G L A S J. N I C H O L S 1
AND
K I R K R. J O H N S O N 2
Denver Museum of Nature & Science
1
Research Associate
2
Chief Curator & Vice President for Collections and Research
CAMBRIDGE UNIVERSITY PRESS
Cambridge, New York, Melbourne, Madrid, Cape Town, Singapore, São Paulo
Cambridge University Press
The Edinburgh Building, Cambridge CB2 8RU, UK
Published in the United States of America by Cambridge University Press, New York
www.cambridge.org
Information on this title: www.cambridge.org/9780521835756
© Cambridge University Press 2008
This publication is in copyright. Subject to statutory exception and to the provision of
relevant collective licensing agreements, no reproduction of any part may take place
without the written permission of Cambridge University Press.
First published in print format 2008
ISBN-13 978-0-511-39856-8
eBook (EBL)
ISBN-13
hardback
978-0-521-83575-6
Cambridge University Press has no responsibility for the persistence or accuracy of urls
for external or third-party internet websites referred to in this publication, and does not
guarantee that any content on such websites is, or will remain, accurate or appropriate.
Dedicated in loving memory to
Beatrice Olmstead Nichols
who never doubted her son would go far
but perhaps did not envision travels eons back in time
and
Katie Jo Johnson
who was always amused that the son of a Katie
would study the K–T boundary
Contents
Preface
PART I
page ix
BACKGROUND
1 Introduction
1
3
2 Resolution of the K–T boundary
13
3 Using fossil plants to study the K–T boundary
27
4 Brief history of K–T boundary paleobotany
and palynology 34
5 Overview of latest Cretaceous and early
Paleocene vegetation 46
PART II REGIONAL CASE STUDIES
67
6 Williston Basin – the most complete K–T sections
known 69
7 Other North American records
8 Eurasia
104
159
9 The remnants of Gondwana
195
vii
viii
Contents
PART III
INTERPRETATIONS
215
10 Assessment of the K–T boundary event
217
11 Evaluation of scenarios for the K–T boundary event
12 Floral effects of the K–T boundary event
Appendix 231
References 254
Index 278
229
222
Preface
We both have been fascinated by the Cretaceous–Paleogene (K–T)
boundary since the late 1970s. The Alvarez discovery galvanized our individual
research efforts and we have worked together on this problem since we met in
1983. Our research has focused on western North America, so our data
and interpretations are largely based on field work and laboratory analyses in
this region. We have also studied terrestrial K–T boundary sections in Russia,
China, and New Zealand and searched, unsuccessfully, for them in Mongolia,
Patagonia, and India.
In preparation for writing this book, we made a comprehensive survey of the
world’s scientific literature through 2006 pertaining to plants and the K–T
boundary. Our bibliographic database includes more than 500 references, but
we have chosen to cite only those most relevant to understanding the effects of
the terminal Cretaceous event on plants. We sought to interpret objectively the
data available in those publications rather than simply to repeat the conclusions
of the original authors. In many instances we agree with the original authors,
but in some we do not. In the latter instances, we trust we have fairly presented
their views and that we have given no reason for offense in our reinterpretation.
To present a major conclusion at the outset, we deduce that the changes in
plant communities that took place at the K–T boundary are inextricably and
causally linked to the impact of an extraterrestrial body on the Earth in the
Caribbean region – the Chicxulub impact. The events that transpired in latest
Cretaceous and earliest Paleogene time are much more complex than this
statement suggests, however. We invite the reader to explore this fascinating
subject with us.
We gratefully acknowledge the support and assistance of many colleagues
over the last 25 years for their insights, inspiration, and collaborations in reference to the terrestrial K–T boundary. Specifically, we thank Walter Alvarez, David
Archibald, Frank Asaro, Moses Attrep Jr., Richard Barclay, Edward Belt, Samuel
ix
x
Preface
Bowring, Dennis Braman, William Cobban, Philip Currie, Robyn Burnham,
Steven D’Hondt, Erling Dorf, Beth Ellis, David Fastovsky, Farley Fleming, Joseph
Hartman, Leo Hickey, Jason Hicks, Brian Huber, Steven Manchester, Edward
Murphy, John Obradovich, Carl Orth, Dean Pearson, Herman Pfefferkorn,
Charles Pillmore, Robert Raynolds, Michele Reynolds, Eugene Shoemaker,
Arthur Sweet, Louis Taylor, Alfred Traverse, Robert and Bernadine Tschudy,
Gary Upchurch Jr., Vivi Vajda, Wesley Wehr, Peter Wilf, Scott Wing, and Jack
Wolfe. Our field efforts outside of North America were supported or enlightened
by Joan Esterle, Elizabeth Kennedy, Jane Newman, Ian Raine, Khishigjav
Tsogtbataar, Mahito Watabe, Makoto Manabe, Masaki Matsukawa, Harufumi
Nishida, Kaz Uemura, Rube´n Cu´neo, Alejandra Gandolfo, Rosendo Pascual, Pablo
Puerta, Raminder Loyal, Ashok Sahni, Chen Pei-ji, Sun Chunlin, Sun Ge, Rahman
Ashraf, Mikhail Akmetiev, Eugenia Bugdaeva, Lena Golovneva, Alexei Herman,
Tatiana Kezina, Tatiana Kodrul, Valentin Krassilov, and Valentina Markevich. Beth
Ellis prepared many of the maps and plates; Dennis Braman of the Royal Tyrrell
Museum reviewed data on Canadian localities summarized in the Appendix; Ian
Miller reviewed the final manuscript. We are grateful to the editorial staff of
Cambridge University Press for their patience, support, and guidance.
DOUGLAS J. NICHOLS
KIRK R. JOHNSON
PART I
BACKGROUND
1
Introduction
1.1
The K–T controversy and the Alvarez challenge
A paper published in 1980 in the journal Science revolutionized the
science of geology. Coauthored by Nobel laureate in physics Luis Alvarez, his
geophysicist son Walter, and two colleagues, the paper presented data from
the esoteric field of neutron activation analysis. These data suggested that the
Earth had been struck by a large extraterrestrial object (an asteroid or possibly
a comet) some 65 million years ago, precisely at the moment in time that
marked the boundary between the Mesozoic and Cenozoic eras (Figure 1.1).
The time line, on a smaller scale also the boundary between the Cretaceous
and Paleogene periods, was widely known as the K–T boundary (‘‘K’’ being the
internationally accepted abbreviation for Cretaceous and ‘‘T’’ being the corresponding abbreviation for either Tertiary or Paleogene, according to nomenclatural preference). The paper (Alvarez et al. 1980) also proposed that this
extraterrestrial impact had been responsible for one of the greatest episodes
of extinction in Earth history. The K–T extinctions, which eradicated 70% or
more of species on land and in the sea, ended the Mesozoic Era, the second of the
three great subdivisions of life recognized by paleontologists. The cause of the
K–T extinctions had long been argued in paleontology. The impact hypothesis
had now been put forward as the explanation.
The asteroid impact hypothesis, involving as it does a causative agent from
outside the Earth and also an instantaneous catastrophic event (an anathema in
geology in 1980), immediately became enormously controversial in paleontology and geology. To no small extent the controversy may have arisen also
because an explanation for the great extinction had been presented not by
paleontologists, who were inclined toward ownership of the phenomenon of
3
Introduction
Era
Period
Epoch
Age
Ma
33.9 +_ 0.1
Cenozoic
(part)
Priabonian
Eocene
Paleogene
(part)
Bartonian
Lutetian
Ypresian
55.8 +_ 0.2
Thanetian
"T"
Paleocene
Selandian
Danian
Maastrichtian
"K"
Mesozoic
(part)
4
61.7 +_ 0.2
65.5 +_ 0.3
70.6 +_ 0.6
Campanian
Santonian
Cretaceous
(part)
Late
Coniacian
Turonian
Cenomanian
99.6 +_ 0.9
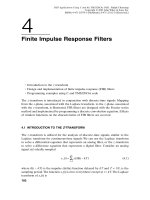
Figure 1.1 Part of the geologic time scale centered on the K–T boundary. Selected
radiometric ages provide calibration (Ma ¼ mega-annum, million years). Age data
from Gradstein et al. (2004).
extinction, but by a physicist and his colleagues, outsiders as it were. Not all
paleontologists took umbrage, but many did. The asteroid impact hypothesis
soon became widely known in the popular press because the best known of all
fossil creatures – the dinosaurs – top the long list of organisms whose geologic
history ended at the K–T boundary (indeed, the Mesozoic Era is popularly known
as the Age of Dinosaurs). In the best tradition of the natural sciences, however,
the impact hypothesis quickly generated a wide variety of studies designed to
investigate its possible validity, or in many instances, intending to disprove it.
These studies, far too numerous to be reviewed here, were responses to what we
call the Alvarez challenge: to prove or disprove the impact hypothesis of the K–T
extinctions. Because the matter of extinction largely concerns the field of
paleontology, paleontologists – we among them – were those primarily challenged. The Alvarez asteroid impact hypothesis posed a specific question: did an
extraterrestrial impact cause extinction? The challenge to us was to determine
whether the fossil record of plants in terrestrial rocks could answer this
question.
Throughout the 1980s, the evidence for the hypothesized impact grew.
Anomalous concentrations of the metallic element iridium (Ir) at the K–T
boundary, the Alvarez team’s primary evidence, were located at dozens of new
K–T sites and cores in marine and nonmarine (terrestrial) rocks around the
world. The discovery of impact-sourced shock-metamorphosed mineral grains
1.2 The central role of plants as evidence
at numerous K–T boundary sections overwhelmed the competing idea that
volcanism in India was responsible for the iridium anomalies. The impact
crater itself was eventually located and identified (Hildebrand et al. 1991).
A full review of the fascinating story of the evolution of the impact hypothesis
to the status of a scientific theory is beyond the scope of this book; the best
accounts are Alvarez (1997) and Powell (1998), both eminently readable books in
the history of science.
This book is our answer to the Alvarez challenge. Popular interest in dinosaurs notwithstanding, fossil plants yield the most information about the
effects of the K–T extinction event on the land. Our goal is to summarize
evidence from fossil plants that bears on the impact extinction theory.
1.2
The central role of plants as evidence
As succinctly stated by Hickey (1984), land plants form a central element in any comprehensive inquiry into possible causes of extinctions at the
K–T boundary because they are a conspicuous and exposed part of the terrestrial
biota. Plants are speciose and common on terrestrial landscapes. They are
primary producers, composing the base of the food chain. The fate of terrestrial
animals depends upon them, either directly or indirectly, as food sources and
for shelter; thus, the collapse of plant communities would cause the collapse of
entire ecosystems. Unlike animals, plants are fixed in position on the landscape
and cannot escape sudden deleterious changes in the environment. They are
directly linked to atmospheric chemistry, temperature, and humidity and hence
they reflect climate and are exquisitely sensitive to changes in it. Add to these
essential aspects the fact that plants tend to be commonly preserved as fossils.
Fossil plants also have biostratigraphic utility and they can be used to locate the
stratigraphic position of the K–T boundary with great accuracy and precision.
Thus, fossil plants are available for study, and they are the very organisms that
have enormous potential for revealing critical information about the nature and
effects of the K–T extinctions.
Plant fossils are preserved most often in two forms: as relatively large parts of
whole plants ranging from leaves to tree trunks (plant megafossils); and as
microscopic bodies such as pollen grains and spores (plant microfossils). Plant
megafossils are common in the geologic record and plant microfossils are nearly
ubiquitous in unoxidized, fine-grained, sedimentary rocks. As is discussed at
greater length in Sections 3.1 and 3.2, plant megafossils – principally leaves –
yield much valuable data about their geologic age, depositional environment,
source vegetation, paleoclimate (especially temperature and humidity), and
their insect herbivores; and plant microfossils, by virtue of their near ubiquity,
5
6
Introduction
leaves 25 cm
Scale:
pollen 25 µm
g
j
h
k
d
c
b
a
i
l
e
m
n
f
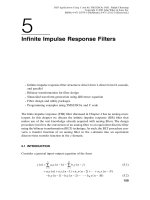
Figure 1.2 Sketches of typical fossil leaves and pollen from Maastrichtian,
Paleocene, and lower Eocene strata in Montana and Wyoming, USA (from Nichols
et al. 1988). a – Paranymphaea crassifolia, b – aff. Averrhoites, c – Lauraceae, d – Pterocarya
glabra, e – Metasequoia occidentalis, f – ‘‘Carya’’ antiquorum, g – Aquilapollenites quadrilobus,
h – Tricolpites microreticulatus, i – Taxodiaceaepollenites hiatus, j – Polyatriopollenites vermontensis, k – Momipites leboensis, l – Momipites triorbicularis, m – Caryapollenites veripites,
n – Platycarya platycaryoides. Reprinted with permission.
Figure 1.3 Photograph of a representative outcrop of the kinds of rocks of varied
fine- to coarse-grained lithology that can yield plant microfossils and megafossils. The
exposure has enough lateral and vertical extent to yield several sections for analysis.
This outcrop, at Clear Creek North in the Raton Basin (see Section 7.2), actually
contains the K–T boundary (see arrow). Photo by C. L. Pillmore, US Geological Survey.
1.3 How plants should respond
excel at stratigraphic age determination and correlation. Even though a given
source vegetation produces both megafossils and microfossils, the resulting
fossil records often contain strikingly different information. Where it is possible
to employ both of these major kinds of plant fossils in investigations of the K–T
boundary, each group supplements the other in revealing the nature of ancient
plant communities and their fate as a consequence of the K–T boundary impact
event. Figure 1.2 illustrates some plant megafossils (leaves) and microfossils
(pollen) as generalized examples. Figure 1.3 shows an outcrop section that
has yielded both plant megafossils and microfossils near and at the K–T boundary, bearing evidence of events that affected plants in latest Cretaceous and
earliest Paleocene time.
1.3
Expectations of how plants should respond to a global
catastrophe
In analyzing the differences between the evolutionary history of plants
and animals, Traverse (1988a) asserted that major plant extinctions have not
been synchronous with animal extinctions in the geologic past, and that
changes in floras through time have been due to gradual replacement, not
mass extinction. He cogently argued that this is because as a group, plants are
resilient organisms able to survive extrinsic stresses much better than animals.
Reasons for this include plants’ ubiquity on landscapes, their indeterminant
growth, their ability to sprout new shoots from rootstocks, and the long temporal persistence of seed banks. Traverse (1988a) concluded that major extinction events among plants and animals might not be attributable to the same
causes. The extrinsic stresses that Traverse referred to were defined by
DiMichele et al. (1987) as those caused by external agents that alter prevailing
conditions locally to globally; they cited the K–T impact as an example.
Although we agree with many of Traverse’s observations and conclusions, we
must disagree with him about the K–T extinctions, which we assert simultaneously affected both plants and animals on land as well as diverse marine
organisms.
The first requirement in substantiating our claim is to consider how plants
would have responded to an extrinsic stress of global proportions, a disaster
such as the impact of a large extraterrestrial body on the Earth. Following the
publication of Alvarez et al. (1980), many scenarios were developed that proposed various dire effects of a large impact on the terrestrial environment. We
evaluate some of these ancillary effects in Section 11.5. That impact–extinction
model is: impact followed immediately by shock waves and possibly by extensive wildfires; an enormous cloud of dust raised by the impact reached a low
7
8
Introduction
Earth orbit and spread around the Earth, severely reducing solar radiation for a
period of a few years; loss of sunlight causing supression of photosynthesis,
which created an ecological catastrophe resulting in major extinction. This
mechanism would appear to be adequate to explain the extinction of a vast
number of those plant taxa (species or genera) that could not regenerate from
seeds or rootstocks.
It is reasonable to assume that within a certain proximity to the impact site,
possibly thousands of kilometers, forest vegetation would have been razed by
shock waves emanating from the impact blast, and perhaps much of the fallen
vegetation would have been set afire (Wolbach et al. 1990, Melosh et al. 1990). As
the impact dust eventually settled and the sky cleared, a devastated landscape
would have been revealed. It is likely that some plants survived in refugia, places
protected from blast effects and forest fires. Those plants could begin to revegetate the landscape, but quite likely the first plants to appear and proliferate would
have been ferns, which are able to grow quickly from spores or buried rhizomes.
Ferns were ‘‘disaster species’’ in the sense of Harries et al. (1996) and Kauffman and
Harries (1996), able quickly to colonize disturbed terrain. After the K–T impact
event, they would take temporary advantage of the absence of seed plants and
would dominate the landscape as the pioneer plant community. This is essentially the scenario envisioned by Tschudy et al. (1984) and DiMichele et al. (1987).
The geologic record of such an event or series of events could be expected to
be unmistakable. Plant extinctions would be indicated by the disappearance
from the fossil record of a significant number of taxa. Assuming not just mass
kill but also mass extinction, megafossil floras on either side of the K–T boundary would be strikingly different in composition, as would the corresponding
microfossil floras. The microfossils would be expected to exhibit their most
profound changes coincident with the deposits representing impact debris.
Pioneer communities of ferns would be recorded in the stratigraphic record
by unusual abundances of fern spores just above the level of pollen extinction.
Although not all plant taxa were driven to extinction, some might be expected
to show sharp changes in abundance, either reductions or (like the ferns)
increases. Plant communities on continents farther removed from the impact
site might suffer less than those in closer proximity. Long-term effects on
the Earth’s vegetation would be expected to involve permanent changes in the
composition of the surviving flora on a regional to global scale and reflect the
nature and rate of ecosystem recovery. The record of the event might well be
clearer in some locations than in others, although a truly global catastrophe
could be expected to have some truly global effects. Our survey of the record of
plant fossils across the K–T boundary is worldwide so that this issue can begin to
be addressed.
1.3 How plants should respond
Figure 1.4 Diagram of a hypothetical, fossil-bearing stratigraphic section to illustrate the Signor–Lipps effect. Tick marks represent sample levels, vertical lines
represent stratigraphic ranges of different fossil species having variable frequencies
of occurrence in the section, and black dots represent presence of fossils (one or more
specimens of a species) in samples. The dashed horizontal line represents the level at
which abrupt and total extinction will be assumed to occur (compare Figure 1.5).
A most important consideration is not only how plants would respond to
such a global catastrophe, but also how plant fossils would leave an interpretable record of the event. We speak here not of modes of preservation of plant
fossils (those are briefly summarized in Sections 3.1 and 3.2), but of observations
that have been made on the occurrence of fossils in general. It is well known
that within any taxonomic group preserved in the fossil record, some taxa are
abundant, others are less common, and some are rare. Stratigraphic occurrences
of abundant, common, and rare taxa of any group of fossils within a stratigraphic interval create predictable patterns when plotted sample-by-sample.
Figure 1.4 is a hypothetical example.
In Figure 1.4, the vertical column at the left represents a stratigraphic section
from which fossils have been collected; tick marks show sample positions.
Occurrences of individual taxa (species or genera) are shown by the black dots
at the stratigraphic levels where they were found; each dot represents one
or more specimens recovered at that level. The vertical lines represent the
9
10
Introduction
Figure 1.5 Diagram based on Figure 1.4 illustrating the Signor–Lipps effect. The
solid horizontal line represents the extinction level after an extinction event.
Compare Figure 1.4 and see text for further explanation.
stratigraphic ranges of the taxa in this section – note that all taxa range to the
top or nearly to the top of the section. The taxa are arranged in order of
abundance with some occurring at all or most levels (left side of diagram),
others at fewer levels, and rare ones at very few levels (right side of diagram).
In Figure 1.4, the horizontal dashed line within the stratigraphic sequence
indicates the level at which a theoretical mass extinction of all the taxa will
take place. In Figure 1.5, the pattern among the abundantly occurring taxa
clearly shows that, at the level of the solid line, an abrupt and total extinction
has occurred. However, the pattern among the less abundant and rare taxa fails
to show clearly the level of extinction because the last occurrences of these taxa
are well before the theoretical extinction level. Furthermore, the occurrences of
the rare taxa, taken together, suggest that the mass extinction was not abrupt,
but that it occurred gradually.
Signor and Lipps (1982) considered this phenomenon and formulated the
concept that artificial range truncations (by which they meant the abrupt
terminations of the stratigraphic ranges of taxa), especially among uncommon
taxa, give the appearance of a gradual extinction even if the extinction is abrupt
1.3 How plants should respond
Figure 1.6 Diagram based on Figure 1.5 showing the actual extinction level (solid
horizontal line) and apparent ‘‘stepwise’’ levels of extinction (dashed horizontal
lines).
and catastrophic. The phenomenon has come to be known as ‘‘the Signor–Lipps
effect.’’ The Signor–Lipps effect makes it appear that even an abrupt and total
extinction was to some extent gradual. Signor and Lipps noted that more
extensive sampling could fill in some gaps in the stratigraphic ranges of some
taxa, making a curve drawn on the last occurrences closer to a straight line that
coincides with the extinction level; however, the curve would never flatten
entirely.
Figure 1.6 is based on Figure 1.5, but in addition to the solid line marking the
level of extinction as in Figure 1.5, dashed lines mark where it appears that
substantial numbers of the taxa died out at levels or steps below the final
extinction. However, this ‘‘stepwise’’ extinction pattern is merely an artifact of
the varied relative abundances of the fossil taxa, as is the deceptive pattern of
gradual extinction.
The Signor–Lipps effect, although a theoretical concept, was shown to be
valid by Meldahl (1990). Meldahl conducted an experiment in which he used
specimens of extant species of marine mollusks collected from Holocene beach
11
12
Introduction
sediments. The presence or absence of specimens at each sampling level was
determined by the actual abundance of each species within the sampled interval. The surface of the beach represented a total catastrophic extinction because
no specimens of any species were present above that level. When Meldahl
plotted the data, he found that rare extant species seemed to disappear gradually below the simulated extinction level, the present-day beach surface.
Meldahl’s taxa were marine mollusks and his extinction level imaginary
(because all his taxa are extant species), but the same Signor–Lipps effect can
be anticipated for plant-fossil taxa at the actual extinction level of the K–T
boundary. This is an important principal that we will return to later in discussing the plant fossil record at specific localities.
Our primary assertion is that, given an understanding of the preservation
modes of plants and of the sampling effects involved in recovering extinctions
from fossils, the plant fossil record, including both megafossils (especially
leaves) and microfossils (especially pollen and spores), can yield invaluable
information about Earth history. We believe that plant fossils are a largely
unexploited key to understanding one of the most fascinating questions in
geology, the nature of terminal Cretaceous extinctions. To comprehend the
significance of plant fossils as they relate to the K–T boundary, it is necessary
to appreciate how they are used to identify the boundary in conjunction with
other geologic evidence, how these methods developed historically, and what
paleobotany (the study of plant megafossils) and palynology (the study of plant
microfossils) tell us about the vegetation of the Earth in Late Cretaceous and
early Paleogene time. The chapters in Part I of this book address these essential
matters, Part II presents case studies from those regions of the world for which
data are available, and Part III covers broad-scale interpretations based on the
data presented.
2
Resolution of the K–T boundary
We perceive three increasingly precise scales of temporal resolution of
the K–T boundary. Stage-level resolution is on the order of millions of years;
subchron-level resolution is on the order of tens to hundreds of thousands of
years; and impactite-level resolution, while not directly measurable, is on the
order of one to a few years. At the resolution of stage, the boundary between the
Cretaceous and Paleogene periods is the boundary between the Maastrichtian
Stage (5.1 Ma in duration) and the Danian Stage (3.8 Ma in duration). At the time
of the Alvarez discovery, the resolution of most K–T boundary paleontological
studies was at the stage level, at best. For most terrestrial K–T sections outside of
North America, this level of temporal resolution is still prevalent today. At the
subchron level of temporal resolution, the K–T boundary event occurred within
the polarity subchron C29r, whose duration was between 570 and 833 thousand
years, depending on which calibration is chosen. Resolution at the subchron
level often brings recognition of paleontological events to the outcrop scale on
the order of tens to hundreds of meters of section. Biostratigraphic zones can
have similar durations to subchrons and thus may fall into this category of
resolution. The third level of resolution is the impact layer, where physical
and biological observations can be directly related to the K–T boundary impactite. At this level, events are resolved at the centimeter, or even millimeter,
scale. A great deal of confusion and misunderstanding about the K–T boundary
stems from the fact that different workers are mixing results and interpretations from different scales of temporal and stratigraphic resolution.
2.1
Stage-level resolution
Stages, the shortest formal chronostratigraphic units, are defined by
paleontological content delimited at a stratotype. Stages are typically a few to
13