Nghiên cứu xử lý hiệu quả DDT bằng phương pháp quang xúc tác sử dụng vật liệu nano compozit fe cuox GO SBA 15 tt tiếng anh
Bạn đang xem bản rút gọn của tài liệu. Xem và tải ngay bản đầy đủ của tài liệu tại đây (1.01 MB, 26 trang )
MINISTRY OF
EDUCATION AND TRAINING
VIETNAM ACADEMY OF SCIENCE AND
TECHNOLOGY
GRADATE UNIVERSITY OF SCIENCE AND TECHNOLOGY
------------------
NGUYEN THANH TUAN
RESEARCH ON EFFECTIVE TREATMENT OF DDT BY
PHOTOCATALYTIC METHOD USING Fe-CuOx/GO;
SBA – 15 NANOCOMPOSITE MATERIALS
Major: Theoretical Chemistry and Physical Chemistry
Code : 62.44.01.19
SUMMARY OF DOCTOR THESIS
Hanoi - 2019
The thesis was completed at Institute of Chemistry, Vietnam
Academy of Science and Technology.
Supervisors:
1. Prof. PhD. Vu Anh Tuan
2. PhD. Trịnh Khac Sau
Reviewer 1:
Reviewer 2:
Reviewer 3:
The dissertation defended at Graduate University of Science and
Technology, 18 Hoang Quoc Viet street, Hanoi.
Time: hour, date /month/2019
The thesis could be found at:
- National Library of Vietnam
- Library of Graduate University of Science and Technology
- Library of Institute of Chemistry
INTRODUCTION
* The thesis necessity
Along with the economic development, Vietnam has been facing
pollution problems arising from agricultural and industrial production
activities. In particular, Persistent Organic Pollutants (POPs) are
halogenated organic compounds that are environmentally toxic and
stable compounds. They are capable of bioaccumulation through the
food chain and stored for long periods of time with potential adverse
impacts on human health and the environment. Due to the hazardous
potential of these compounds, 92 countries signed the Convention on
May 22, 2001 in Stockholm (Sweden), commonly known as the
Stockholm Convention to place a global ban on these particularly
harmful and toxic compounds. Initially, the Stockholm convention
was designed to reduce and eliminate the 12 most dangerous POPs
out of human life. Among of the 12 POPs in the Stockholm
Convention, up to 8 types of POPs-pesticides include Aldrin,
chlordane, DDT, Dieldrin, Endrin, Hetachlor, Mirex and Toxaphene.
Then, at the sixth meeting (May 2013), the convention added a list of
POPs up to the total 28 of persistent organic pollutants.
In Vietnam, persistent organic pollutants such as Dioxin (due to
war consequences, the burning of hazardous wastes, PVC,...),
pesticides such as Chlordane, DDT, 2,4-D; 2,4,5-T as well as PCBs
(from waste oil in transformers) cause serious pollution affecting
human health, the environment and sustainable development.
To remove these pollutants in water environment, many methods
have been used such as: adsorption, biodegradation, chemical
decomposition, advanced oxidation ... In which the adsorption
method causes secondary pollution, biodegradation method requires
1
long time and low efficiency. Therefore, the advanced oxidation
processes
(AOPs)
improved
the
removal
efficiency
using
photochemical nanocatalysts such as Fe2O3, Fe3O4, FeOOH, Feo ... is
being studied throughly. Advanced oxidation processes (AOPs) refer
to an oxidation process through the formation of hydroxyl radicals
(•OH) which is a promising approach to degrade primarily organic
chemical contaminants in water treatment. Advanced oxidation
processes (AOPs) have shown many advantages such as costeffectiveness, high efficiency, low toxicity and simple operation.
Several
recent
studies
have
shown
that
the
simultaneous
incorporation of different metals and metal oxides onto the same
carrier to enhance efficiency of these composite catalysts. Among the
carriers, graphene and graphene oxide (GO) have been received a
great interest due to their unique structure and physical-chemical
properties such as high conductivities at room temperature, high
specific surface and chemical stability, and high visible light
absorption ability. Unlike graphene, graphene oxide (GO) contains
functional groups like hydroxyl, carbonyl, epoxi, carboxylic on the
surface, so it is easy to form covalent bonds, strong chemical bonds
with transition metal ions. Therefore, GO is an ideal carrier in the
synthesis of new composite nanomaterials. Meanwhile, SBA-15 is a
material with well-ordered hexagonal mesoporous silica structure
which has a very large surface area (600 - 1000m2/g). However, the
purely siliceous SBA-15 has a lack of functionality due to its
electrically neutral framework, it can be used as adsorbent but not as
acidic or redox catalysts. In order to use as catalysts, SBA-15 can be
modified by incorporation of transition metals into framework by
direct synthesis and post-synthesis. In this thesis, we focus on
2
studying how to incorporate of Fe and Cu atoms into GO and SBA15 frameworks by atomic implantation method to create new,
advanced and highly efficient nanocomposite catalysts for DDT
treatment. From the above arguments, we choose the thesis topic:
"Research on effective treatment of DDT by photocatalyst method
using Fe - CuOx /GO; SBA – 15 nanocomposite materials" to
research and evaluate the catalytic activity of these new catalytic
systems for DDT degradation.
* Objectives of the study
Focusing on studying how to incorporate of Fe and Cu atoms into
GO and SBA-15 frameworks by atomic implantation method to
create new, advanced and highly efficient nanocomposite catalysts
for DDT treatment.
* Main research contents of the thesis
- Synthesize some new and advanced nanocomposite materials
based on metalic oxide combination with GO and SBA-15 as highefficiency photocatalysts for toxic and persistent organic pollutants
treatment by various methods such as co-precipitation, hydrothermal
and especially atomic implantation method.
- Study on structural characteristics, morphology and physicchemical properties of synthesized materials by modern methods
such as XRD, FTIR, TEM, XPS, BET, UV-Vis ...
- The photocatalytic activity of these novel materials under visible
light for the removal of DDT from aqueous solution was investigated
and discussed.
- Study on the influencing factors such as pH, H2O2 concentration,
DDT concentration, catalytic concentration to the DDT degradation
efficiency.
3
- Research and propose reaction mechanism, decompose DDT
through intermediate products formed in the process of DDT
decomposition on synthesized catalytic systems.
* Thesis structure
This thesis consists of 136 pages, 78 figures, 25 tables and 143
references including these main parts: introduction, three chapters in
content and conclusion. The main results were published on 6
journals: 02 articles was published on international journals, 04
article was published on national journals.
Chapter 1. Literature review
Chapter 1 is presented in 36 pages, in which general introduction
of persistent organic pollutants (POPs), structure and toxicity of DDT
as representative for research in this thesis. Also in this chapter,
technologies to treat persistent organic substances in the world and in
Vietnam are also explored. Among the methods, Advanced Oxidation
Processes (AOPs) have shown many advantages such as costeffectiveness, high degradation efficiency, low toxicity and simple
operation. Therefore the advanced oxidation processes (AOPs) was
mentioned in this chapter includes the theoretical basis and
classification of the AOP, the theoretical basis of Fenton processes
(Fenton homogeneous process, Fenton heterogeneous process,
Fenton photo process). Chapter 1 also introduces some highly
effective nanocomposite catalysts based on graphene, GO and SBA15 in the treatment of persistent organic pollutants in water
environment. Overview of synthetic methods, research and
application of nanocomposite catalysts for advanced oxidation
4
processes to treat persistent organic substances in water environment
was introduced. Evaluation and analysis of the applicability of these
catalysts in environmental treatment: dye treatment; toxic organic
substances and DDT.
Chapter 2. Experimental
Chapter 2 is presented in 20 pages including:
2.1. Process of synthesizing materials
- Synthesis of Fe3O4, Fe3O4/GO nanocomposite materials by coprecipitation method.
- Synthesis of TiO2/GO and Fe-TiO2/GO nanocomposite materials by
hydrothermal method.
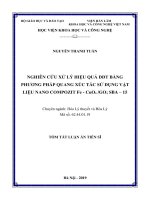
- Synthesis of Fe-Cu/SBA-15 and Fe-Cu/GO nanocomposite
materials by atomic implantation method. The equipment for
synthesis of Fe-Cu/GO nanocomposite by atomic implantation
method is illustrated in Figure 2.6.
Figure 2.6. Schematic illustrating the equipment for synthesis of
Cu/Fe/GO nanocomposite by atomic implantation method.
- Study on photocatalytic process in the decomposition reaction of
DDT by these synthesized catalysts.
- Analysis and evaluation of intermediate products formed in the
5
process of decomposing DDT on some of the most effective catalytic
systems.
2.2. Characterisation Techniques
- Techniques for characterisation are approached from the modern
method using research facilities in Vietnam and Korea: XRD, XPS,
EDX, SEM, HR-TEM, BET, FT-IR, UV-Vis.
2.3. Methods of evaluating the photocatalytic ability of materials
in the photocatalytic process of decomposing DDT
- Develop a model to assess the photocatalytic activity of materials in
the reaction of DDT decomposition.
- Methods of analysis and determination of removal efficiency in
DDT decomposition process: GC-MS, TOC.
Chapter 3. Results and Discussions
Chapter 3 is presented in 60 pages including:
3.1. Characteristics of structure and morphology of catalytic
systems
3.1.1. X-ray diffraction (XRD)
Results of XRD for Fe3O4 and Fe3O4/GO samples (Figure 3.3)
appear typical peaks of Fe3O4 at values of 2θ: 30.1 ° (220), 35.4 °
(311), 43, 05 ° (400), 54o (422), 62.51 ° (511) and 6395 ° (553) [88].
Meanwhile, XRD patterns of GO, Fe/GO and Fe-Cu/GO samples
(Figure 3.5) shows that the peak at position 2Ɵ ~ 11o is belong to GO
material [42]. When Fe3+ and Cu2+ was delivered on GO, the peak of
GO in this position decreased sharply. As shown in XRD diagram of
Fe/GO and Fe-Cu/GO, there are typical peaks such as: 24.1 ° (012),
33.1 ° (104), 36.5 ° (110), 40, 8 ° (113), 49.4 ° (024), 54.1 ° (116),
6
57.5 ° (018), 62.3 ° (214) and 64 ° (300) which fit the standard data
for the structure of Fe2O3.
Figure 3.3. XRD patterns of Fe3O4
và Fe3O4/GO nanocomposite
material
Figure 3.5. XRD patterns of GO,
Fe/GO và Fe-Cu/GO
nanocomposite material
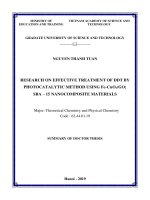
Figure 3.6. Small-angle X-ray scattering patterns (a) and wide-angle X-ray
scattering patterns (b) of SBA-15, 5Fe-2Cu/SBA-15, 10Fe-2Cu/SBA-15 and
15Fe-2Cu/SBA-15 samples.
In figure 3.6, small-angle X-ray scattering patterns showed
that all samples has three peaks, in which the peak intensity is
sharp and strong at 2 0.8o and two peaks are smaller at 2
1.5o và 2 1.7o that can be indexed as the (100), (110), and
(200) diffractions of 2D hexagonal p6mm symmetry of SBA15, respectively [20,28,32]. The peak intensity of these samples
7
was slightly changed according to the different Cu-Fe loading
amounts into SBA-15 framework.
3.1.2 Scanning electron microscopy (SEM) and Transmission
electron microscopy (TEM)
Figure 3.9. FE-SEM image of
Fe3O4/GO.
Figure 3.10. HR-TEM image of
Fe3O4/GO
Figure 3.11. TEM images of Fe-TiO2 (a) and Fe-TiO2/GO (b).
SEM image (Figure 3.9) and HR-TEM image (Figure 3.10) show
that Fe3O4 nanoparticles have a spherical shape with the size of 15-20
nm which dispersed well on GO carriers. From TEM images of FeTiO2/GO and Fe-TiO2 nanocomposite materials shown in Figure
3.11, we can see that Fe-TiO2 nanotubes are dispersed on the layers
of GO. Fe-TiO2 nanotube structure has 8 - 12 nm diameter and the
tube length is about 100-200 nm. There are some bundles of Fe-TiO2
8
nanotubes. SEM images and HR-TEM images of Fe-Cu/GO and FeCu/SBA-15 (Figures 3.12, 3.13 and 3.14) all showed good dispersion
of nanoparticles on the carrier. TEM and HR-TEM images
determined that the size of Fe and Cu nanoparticles is in the range of
5 - 10 nm.
Figure 3.12. SEM image of
nanocomposite Fe-Cu/GO
Figure 3.13. HR-TEM image of
nanocomposite Fe-Cu/GO
Figure 3.14. SEM and HR-TEM images of SBA-15(a); 5Fe-2Cu/SBA-15(b);
10Fe-2Cu/SBA-15(c) and 15Fe-2Cu/SBA-15(d).
9
3.1.3. Energy-dispersive X-ray spectroscopy (EDX)
EDX mapping images and EDX analysis for the elemental
composition (Figure 3.18 and 3.19) of nanocomposite Fe-Cu/GO
showed that Fe content accounted for 17.87% by weight and Cu
content only accounted for 1.84% by weight.
Figure 3.18. EDX mapping images and Figure 3.19. EDX analysis
for the elemental composition of nanocomposite Fe-Cu/GO
EDX analysis of Fe-Cu/SBA-15 nanocomposite materials with
different Fe/Cu ratios showed that when Fe, Cu with content <10%
by weight, content of Fe,Cu in Fe-Cu/SBA-15 nanocomposite is
nearly equal to the caculated amount. However, when Fe content is
increased too much, Fe content in EDX ananlysis is lower than initial
calculated amount.
3.1.4. Fourier transform infrared spectroscopy (FTIR)
As seen in Figure 3.23, FTIR spectra of Cu-Fe/GO nanocomposite
material showed the existence of carbonyl group C = O (in the range
1500 - 1730 cm-1) [109]. The intense peak at 1230 cm−1 is related to
10
the aromatic stretching vibration of C–O bond. The peaks at about
2925 cm-1, 2850 cm-1 characterize the existence of the link –CH2–..23
In additional, peaks at 630 cm-1, 570 cm-1, 480 cm-1 corresponding to
the formation of Fe-GO and Fe2O3-GO binding to the functional
groups of GO. Thus, these results revealed the interaction between
Feo, Fe2O3 and GO. FTIR spectra of Cu-Fe/GO also showed low
intensity peaks at 506 cm-1 and 430 cm-1 which assigned to the Cu2O,
Cu and CuO in the structure of Fe-Cu/GO composite [113].
SBA-15
GO
3+
C=O
Cu/Fe/GO
C-O
15Fe-2Cu/SBA-15
2-
Fe O
O-H
Si-O
CO2
CuO
-CH2
Si-O-Si
Cu2O
4000
3500
3000
2500
2000
1500
1000
500
4000
-1
Wavenumber (cm )
Figure 3.23. FTIR spectra of
GO, Fe/GO and Cu-Fe/GO
nanocomposite material
Cu-O
Si-OH
3500
3000
2500
2000
Fe-O
Fe/GO
-OH
10Fe-2Cu/SBA-15
Intensity (a.u)
Intensity (a.u)
5Fe-2Cu/SBA-15
1500
1000
500
Wavenumber (cm-1)
Figure 3.24. FTIR spectra of
SBA-15, Fe-Cu/SBA-15 samples
with different Fe/Cu ratio
The FTIR spectra of SBA-15 and Fe-Cu/SBA-15 nanocomposite
materials in Figure 3.24 are shown the stretching vibrations of the
associated silanol groups (Si-OH) at 3,437 cm-1 and 1632 cm-1. The
vibration bands centered at 1080 cm-1; 815 cm-1; 459 cm-1 were
corresponded to Si-O-Si bending vibration of the silica frameworks
[48,49,136]. Observation of the FTIR spectra of Fe-Cu/SBA-15
nanocomposite samples revealed that the large peak at 660 cm-1 also
attributed to the presence of Fe2O3 and CuO bound into SBA-15
frameworks [128].
11
3.1.5. N2 adsorption–desorption isotherms (BET)
It can be seen from the nitrogen adsorption–desorption isotherms
in figure 3.28, the graphs displayed type IV (according to IUPAC
classification) which are featured of mesoporous structured materials.
Table 3.7 shows the structural parameters of the synthesized
materials based on GO samples. Table 3.11 shows the structural
parameters of Fe-Cu/SBA-15 nanocomposite materials with different
Fe/Cu ratio. It can be seen that SBET surface area for the Fe-Cu/SBA15 samples slightly decreased with the increase of Fe and Cu content.
The capillary diameter (DBJH) and wall thickness (Wt) remarkably
increased in the presence of Fe and Cu. This clearly revealed that the
substitution of metal ions (Fe or Cu) for Si in the SBA-15 network
changed the formation of mesopores of nanocomposite materials.
Figure 3.28. N2 adsorption–desorption isotherms (a) and pore
distribution (b) of Fe-Cu/GO nanocomposite material.
Table 3.7. Structural parameters of synthesized materials based on
GO samples
Sample
parameters
SBET
(m2/g)
Vmicro
(cm3/g)
GO
Fe3O4
Fe3O4/GO
FeTiO2/GO
Fe/GO
FeCu/GO
331
105
173
180
161
130
0.0015
0.005
0.003
0.004
0.0075
0.0034
12
Vpore
(cm3/g)
1.7190
0.33
0.500
0.5234
0.6500
0.4100
DBJH (nm)
7.820.5
12.413.2
8.8-11.5
8 -11
8.3-23
8.626.6
Table 3.11. Structural parameters of SBA-15, 5Fe-2Cu/SBA-15,
10Fe-2Cu/SBA-15 and 15Fe-2Cu/SBA-15 samples.
Sample
SBET
Smeso
Smicro
2
(m /g)
2
(m /g)
2
(m /g)
SBA-15
668
485
5Fe-2Cu/SBA-15
667
10Fe-2Cu/SBA-15
15Fe-2Cu/SBA-15
Vpore
DBJH
Wt
(cm /g)
(nm)
(nm)
182
0.70
5.87
4.80
418
248
0.72
7.04
4.85
623
427
195
0.78
7.36
4.84
571
457
113
0.94
7.23
4.94
3
3.1.6. X-ray Photoelectron Spectroscopy (XPS)
As seen in Figure 3.31, XPS spectra showed that the occurrence
of peaks at binding energy of 931 eV; 943 eV and 951 eV ascribed to
the formation of CuO in the material [44,88]. The peak at 934 eV
assigned to Cu2O [113,135]. Moreover, the binding energy of Fe2p3/2
of the hybrid was located at 710 eV while the peak of Fe2p1/2
appeared at 724 eV which indicated the existence of Fe2O3 [107]. The
peaks with low intensity at 715 eV and 730 eV could ascribe the
formation of FeO in the material [32,135]. The deconvolution of the
C1s peak was consisted of three peaks at 284.4 eV, 285.6 eV and
288.3 eV, which were ascribed to the C-C, C-O, and C(O)O bonding
in GO sheets. The XPS spectra in Figure 3.32 demonstrated the
13
formation of simultaneous formation of CuO, Fe2O3 phases in
composite Fe-Cu/SBA-15 nanomaterials.
Figure 3.31. XPS spectra of the Fe-Cu/GO
Figure 3.32. XPS spectra of the 10Fe-2Cu/SBA-15
14
3.1.7. Ultraviolet - Visible spectra (UV-Vis)
Results of UV-Vis spectroscopic analysis showed absorption
expansion towards visible light range with nano composite materials
based on GO and SBA-15 carriers. The enhanced light absorption is
able to increase the photocatalytic activity of the nano composite
material under the visible light illumination conditions.
3.2. Evaluation of photocatalytic activity of synthesized materials
3.2.1. Comparison of photocatalytic activity of DDT degradation
on synthesized catalysts
Figure 3.36. Comparison of
photocatalytic activity of
synthesized catalysts
Figure 3.37. TOC measurements and
DDT removal efficiency of Cu-Fe/GO
and Fe-Cu/SBA-15 catalysts
Evaluation of photocatalytic activity of synthesized catalysts
includes: Fe3O4, Fe3O4/GO, Fe-TiO2/GO, Fe/GO, Fe-Cu/GO and FeCu/SBA-15. The DDT degradation process is carried out under the
same conditions: initial DDT concentration is 10 mg/L; The catalytic
concentration is 0,2 g/L; H2O2 concentration is 15 mg/L; pH = 5;
temperature T = 30oC and reaction time of 3 hours. The comparison
result of DDT removal efficiency is shown in Figure 3.36. The
catalysts reached the removal efficiency after 3 hours of reaction time
in the order of Fe3O4 < Fe-TiO2/GO < Fe-Cu/SBA-15 < Fe3O4/GO <
Fe/GO < Fe-Cu/GO with the corresponding value of 86,5% < 88% <
15
88,1% <93,2% < 95% < 99,2%. In order to comparison, Fe-Cu/GO
and Fe-Cu/SBA-15 catalysts were evaluated by DDT degradation
efficiency of these catalysts through TOC measurements. The result
of TOC measurements are shown in Figure 3.37.
3.2.2. Propose some DDT decomposition pathways of different
catalytic systems
GO-based catalysts show the high DDT removal efficiency due to
the contribution of a part of GO. GO also plays an important role in
enhancing optical absorption under light irradiation [86,87]. The
intermediate products of Photo Fenton reaction process decomposing
DDT were determined through analysis on GC-MS equipment. The
reaction mechanism of Fe-Cu/GO catalyst in Photo Fenton reaction
decomposing DDT can be proposed as follows:
3
2
FeSurface
H 2O2 Fesurface
HOO H
2
Fe3Surface Cu H 2O FeSurface
Cu 2 H 2 OH
3
3
FeSurface
GO Fesurface
GO(e )
H 2O2 hv 2OH
3
2
FeSurface
H 2O2 hv Fesurface
OH H
3
2
FeSurface
HOO Fesurface
O2 H
2
3
FeSurface
H 2O2 Fesurface
OH OH
2
3
FeSurface
OH Fesurface
OH
GO + hv→ GO (h+ + e-)
Fe3+ → Fe2+ + GO
GO(h+) + Fe3+ → Fe4+ + GO
Fe4+ + OH- → Fe3+ + OH
GO(e-) +
OH + DDT → Intermediate decomposition products → CO2+H2O
16
Figure 3.45. Intermediate products of
Figure 3.46. DDT
DDT decomposition process
decomposition pathway
determined through GC-MS analysis.
3.2.3. Effects of parameters on the degradation of DDT using FeCu/GO nanocomposite catalyst
Figure 3.47. Effect of solution pH
Figure 3.48. Effect of H2O2 dosage
on the degradation of DDT using
on the degradation of DDT using
Fe-Cu/GO nanocomposite catalyst
Fe-Cu/GO nanocomposite catalyst
17
Figure 3.49. Effect of catalyst
Figure 3.50. Effect of inital DDT
dosage on the degradation of
concentration on the photo-Fenton
DDT using Fe-Cu/GO
degradation of DDT using Fe-
nanocomposite catalyst
Cu/GO nanocomposite catalyst
The investigation of the effect of pH, H2O2 dosage, catalyst dosage
and the initial DDT concentration on DDT photo-Fenton degradation
process using Fe-Cu/GO catalyst is shown on Figure 3.47, Figure
3.48, Figure 3.49 and Figure 3.50. To study the stability of Fe-Cu/GO
catalyst, we re-use Fe-Cu/GO catalyst after each reaction by recovery
using magnet, then filter and dry at 60oC for 12 hours. The amount of
catalyst was weighed and used for the next experiments. The catalytic
loss is negligible (<5%). As observed in Figure 3.51, the removal
efficiency reached a value of 99.2% at the first time. After the fourth
cycle, the removal efficiency reached a value of 90.4%. As shown on
the diagram of XRD (Figure 3.52) and SEM (Figure 3.53), there is no
obvious change in the phase structure and morphology of the samples
after the recycling experiments. From this result, it can be proved that
the reuse of Fe-Cu/GO catalyst can be possible.
18
Intensity (a.u)
Cu-Fe/GO 1st
*
*
*
10
20
30
40
*
50
60
70
*
*
Cu-Fe/GO 4th
10
20
30
40
50
60
70
2 degree
Figure 3.51. DDT removal
efficiency on Fe-Cu/GO catalyst
after different reaction times
Figure 3.52. XRD patterns of
Fe-Cu/GO photocatalyst after 1st
and 4th reaction time
Figure 3.53. FE-SEM images of Fe-Cu/GO photocatalyst after 1st and 4th
reaction time
3.2.4. Effects of parameters on the degradation of DDT using FeCu/SBA-15 nanocomposite catalyst
The influencing factors such as pH, Fe/Cu ratio, H2O2 dosage,
catalyst dosage and the initial DDT concentration in DDT photoFenton degradation process using Fe-Cu/SBA-15 catalyst were
studied. Figure 3.54 shows that the 10Fe-Cu/SBA-15 catalyst has the
most efficient photocatalytic activity. DDT removal efficiency
increased from 2Cu/SBA-15 < 5Fe-2Cu/SBA-15 < 10Fe-2Cu/SBA15. Figure 3.55 shows that DDT removal efficiency increases from
67.8 to 92.3% when catalyst dosage increases from 10 mg/L - 40
mg/L with an initial concentration of DDT of 10 mg/L. However,
19
when the catalyst dosage increases from 40 mg/L - 50 mg/L, the
reaction efficiency decreases. This can be explained by the fact that
too much catalyst will occur Fe2+ + •OH = Fe3+ + OH- reaction which
reduces catalytic activity [96]. Therefore the catalyst dosage of 40
mg/L catalyst is selected. Figure 3.56 shows that pH = 5 should be
selected for further research processes.
Figure 3.54. The removal efficiency of
Figure 3.55. Effect of catalyst
DDT loading on Fex-Cuy/SBA-15
dosage on the degradation of DDT
nanocomposite catalyst with different
using 10Fe-2Cu/SBA-15
Fe/Cu components ratio
nanocomposite catalyst.
Figure 3.56. Effect of solution pH on
Figure 3.57. Effect of H2O2 dosage on
the degradation of DDT using 10Fe-
the degradation of DDT using 10Fe-
2Cu/SBA-15 nanocomposite catalyst
2Cu/SBA-15 nanocomposite catalyst
20
3.2.5. Comparison of photocatalytic activity of our synthesized
materials with other published catalysts
In our synthesized and investigated catalysts in the degradation of
DDT, Fe-Cu/GO nanocomposite catalyst is the highest photocatalytic
activity which achieves DDT removal efficiency upto 99.2% after 3 h
under illumination conditions. The best conditions were found to be:
initial DDT concentration is 10 mg/L; the catalyst dosage is 0.2 g/L;
H2O2 dosage is 15 mg/L; pH = 5; temperature T=30oC. The high
photocatalytic activity of the Fe-Cu/GO sample can be explained by
the formation of nanoparticles with very small particle size (5 - 10
nm), uniformly distributed on GO carrier which acts as the active
site. Therefore, they increase the formation of free radicals •OH
which is the main contribution of catalytic activity in Photo-Fenton
reaction. The Fe-Cu/GO catalyst (layer structure) has a higher
removal efficiency than Fe-Cu/SBA-15 catalyst (tube structure). It
can be explained that the diffusion of DDT to the surface of FeCu/GO catalyst is more favorable than that of Fe-Cu/SBA-15
catalyst. The comparison of photocatalytic activity of our synthesized
materials with other published catalysts is given in Table 3.13.
However, the results are hardly comparable because the conditions
for the catalytic reaction are not quite the same. The results of our
DDT degradation achieved were higher than some other published
catalytic material systems such as nZVI-B (92%), nZVI-T (78%) of
Yehia S. El-Temsah et al [14] or Ni/Fe (90%) of Hua Tian et al.
[142] and Ni@FeOx of Z. Xie et al [143]. From the above
comparison, it can be confirmed that the Fe-Cu/GO nanocomposite
catalyst synthesized by atomic implantation method in this thesis
have much higher photocatalytic activity.
21
CONCLUSION
1. Has successfully synthesized nano-composite catalytic materials
based on iron oxide and graphene oxide (GO) or SBA-15
including: Fe3O4/GO; Fe-TiO2/GO; Fe-Cu/GO and Fe-Cu/SBA-15
by co-precipitation, hydrothermal and atomic implantation
method. For Fe3O4/GO by co-precipitation method, the results of
XRD and TEM analysis showed a relatively uniform distribution
of Fe3O4 particles with a spherical shape with the size of 12-17nm
on GO carriers. For Fe-Cu/GO or Fe-Cu/SBA-15 nanocomposite
materials by atomic implantation method at high temperature, the
results of XRD, SEM, TEM, XPS and FTIR showed the
simultaneous existence of Cu2+ and Fe3+ on GO or SBA-15
carriers. From the results of SEM and TEM analysis,
nanoparticles with a size of about 5-10 nm were found to be
dispersed well on GO carriers. In Fe-Cu/SBA-15 material, a small
fraction of Fe3+ or Cu2+ ion replace into Si4+ ion in the SBA-15
framework and other fraction mainly exists in the form of nanosized clusters (<10nm ) evenly dispersed on the capillary wall of
SBA-15.
2. Photocatalytic activity of decomposition of DDT pesticide using
nano composite catalytic materials based on metal oxide and
graphene oxide (GO) is highly effective. Among our synthesized
materials, Fe-Cu/GO reached the highest photocatalytic activity of
the DDT removal efficiency upto 99.2% after 3 h under
illumination conditions. The best conditions were found to be:
initial DDT concentration is 10 mg/L; the catalyst dosage is 0.2
22
g/L; H2O2 dosage is 15 mg/L; pH = 5; temperature T=30oC. The
rapid decomposition rate is due to the interaction between GO and
Fe3+ together with Cu2+, which has created active centers to
accelerate the decomposition process of DDT. The presence of Cu
plays a very important role in increasing the formation of free
radicals •OH in the Fenton reaction. Moreover, CuO itself is also
a highly active photocatalyst contributing to enhance the activity
of Fe-Cu/GO composite catalytic system.
3. In the synthetic catalytic systems, the Fe-Cu/GO catalyst (layer
structure) has a higher photocatalytic activity than Fe-Cu/SBA-15
catalyst (tube structure). It can be explained that the diffusion of
DDT to the surface of Fe-Cu/GO catalyst is more favorable than
that of Fe-Cu/SBA-15 catalyst.
4. Investigation of the influencing factors such as pH, H2O2 dosage,
catalyst dosage and the initial DDT concentration showed that pH
has little effect on DDT removal efficiency while H2O2 dosage
has a great influence. The catalyst concentration plays an
important role in DDT removal efficiency especially when the
initial DDT concentration is high.
5. The mechanism of decomposing DDT pesticides on Fe-Cu/GO
catalyst has been proposed through dechlorination, breaking the
carbon chains and followed by decyclization. Intermediate
products of DDT decomposition process determined through GCMS analysis supported our proposed DDT decomposition
pathway
23