Estimation of river discharge loadings of PAHs in a suburban river in Hiroshima Prefecture, Japan
Bạn đang xem bản rút gọn của tài liệu. Xem và tải ngay bản đầy đủ của tài liệu tại đây (934.41 KB, 12 trang )
Journal of Water and Environment Technology, Vol. 7, No. 2, 2009
Estimation of river discharge loadings of PAHs in a
suburban river in Hiroshima Prefecture, Japan
Koji IWASAKI*, Noriatsu OZAKI*, Keisuke KOJIMA** and Tomonori KINDAICHI*
*Graduate school of Engineering, Hiroshima University, 1-4-1 Kagamiyama Higashiroshima
739-8527 Japan.
**Graduate school of Engineering, The University of Tokyo, 7-3-1 Hongo, Bunkyo-ku, Tokyo
113-8656, Japan
ABSTRACT
The PAHs loadings on river discharge was estimated based on consecutive measurements during
rainfall and non-rainfall periods at a river in a suburban area in Hiroshima Prefecture, Japan. The
PAH concentrations ranged from 12 to 58 ng L-1 for dissolved PAHs, and from 8 to 105 ng L-1
for particulate PAHs on rainy periods. In non-rainy periods, they ranged from 10 to 58 ng L-1 for
dissolved PAHs, and from 4 to 418 ng L-1 for particulate PAHs. PAH concentrations on
non-rainy periods were stable for diurnal and seasonal terms. The dissolved PAH concentration
was negatively correlated with EC and the particulate PAH concentration was negatively
correlated with SS concentration. The yearly loading amount of PAHs was calculated with the
data of river flow rate and PAH concentration, and the calculated yearly PAHs specific loading in
the River on rainy days was 37 µg m-2 year-1 and the loading in non-rainy days was 29 µg m-2
year-1. The total loading was 66 µg m-2 year-1. From these estimations and our previous studies,
the atmospheric loadings and river discharge were compared. From the comparison, the order of
the loading from river basin area was comparable to this from atmospheric loadings.
Keywords: atmospheric deposition, PAHs, rainfall, river discharge.
INTRODUCTION
PAHs are a group of organic compounds consisting of two or more fused benzene rings,
and they are noticed due to carcinogenicity and mutagen city (Dipple 1985; Vinggaard
et al, 2000; Xue and Warshawsky, 2005). PAHs are mostly produced in the combustion
process of fossil fuels and are emitted into the atmosphere. After dispersion, PAHs
accumulate on ground surfaces and discharge into water bodies with rain. The behavior
of PAHs has been extensively studied in atmospheric and aquatic environments (Takada
et al, 1990; Baek et al, 1991; Sharma et al, 1994; Lee et al, 1995; Wan et al, 2006;
Kumata et al, 2006). Still, the relation of the source and environmental fate has not been
well clarified yet. In our previous study (Ozaki, 2006; Ozaki et al (2006, 2007)), the
behavior of PAHs in Hiroshima Bay area was quantitatively investigated, and it was
found that there was a major difference in PAHs loadings between the road traffic
emission and the atmospheric deposition or the particle sedimentation on seabed. In
order to consider the gap in PAHs loadings between road traffic loadings and
environmental discharges, PAHs river discharges were investigated in this study. At a
river in suburban areas in Hiroshima Prefecture, PAH concentrations were measured in
rainy days and non-rainy days to examine the short- or long- term variations in PAH
concentrations. Flow rate and other basic water qualities were also measured in the river,
and their dependencies on PAH concentrations were investigated. From the
measurements, the factors affecting the discharges were modeled for daily basis, and the
total loadings were summed for one year. Further, from the comparison of the loadings
Address correspondence to Noriatsu Ozaki, Graduate school of Engineering, Hiroshima University,
Email:
Received January 6th, 2009, Accepted March 25th, 2009
- 109 -
Journal of Water and Environment Technology, Vol. 7, No. 2, 2009
of river discharge and other environmental loading stages, PAHs behaviors in
atmospheric and water environments were discussed.
MATERIALS AND METHODS
Sampling campaigns
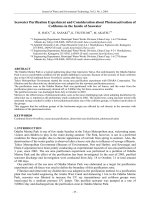
Water samples were taken at a point of Kurose River in Higashihiroshima City
(population: 110,000, population density: 400 person km2, average temperature:
13~14 ℃, precipitation amount: 1200~1700 mm year-1), Hiroshima Prefecture, Japan
(Figure 1).
Namitakiji Lake
Furukawa River
Matsuzaka River
0
2km
4km
Sampling Point
Figure 1 - The River Water Sampling Point and its basin area
The river basin area discharging into this sampling point was 121.45 km2
(Higashihiroshima City, 2000). On rainy days in 2006, the samplings were performed
on Jul. 23 and 24, Oct. 22 and 23, Nov. 10 and 12, Dec. 13 and 14, and in 2007 they
were carried out on Jan. 16~18, Feb. 22 and 23, Apr. 30 and May 1, May 25 and 26, Jul.
20 and 21. For non-rainy samplings, samples taken before starting the rain were
regarded as the non-rainy samples. And in addition to them, samples were taken on Dec.
11~17 and on Dec. 21~22 for non-rainy samplings. Those samplings were performed in
order to know the diurnal and weekly fluctuations. For diurnal sampling, the sampling
was started at 13:00 and conducted every three hours, and for weekly, the sampling was
generally conducted at 13:00 everyday.
At every sampling, 2 to 4 L of water was taken for measuring the dissolved and
particulate PAHs. Samples of the river were classified into dissolved and particulate
phases by filtering with a glass fiber filter (pore size: 0.7 μm, GF/F, Whatman co. ltd.),
which was precombusted at 450℃ for 4 hours. After suction filtration, the glass fiber
filter was dried for one week at room temperature in a desiccator in dark condition.
Besides the PAHs, flow rate, EC, DOC, and SS were measured. Flow rate was
determined by the H-Q curve method leading from flow velocity and depth.
PAHs extraction and concentration analysis
For dissolved PAHs, a surrogate spike with acenaphthene-d10, perylene-d10,
chrysene-d10, and phenanthrene-d10 was added into the filtered water sample and
entrapped at the rate of 1mL min-1 with a silica column (Sep Pak tC18, Waters). After
entrapment and dehydration dryness of the silica column, dichloromethane was passed
10 mL for extraction at the rate of 1 mL min-1. The dichloromethane was subsequently
concentrated into 1.5 mL by N2-gas, and a syringe spike with p-terphenyl-d14 and
- 110 -
Journal of Water and Environment Technology, Vol. 7, No. 2, 2009
2-fluorobiphenyl were added into it. For particulate PAHs, the glass fiber filter with
suspended solids was put in a cellulose fiber cylindrical filter, and dropped into a 50 mL
screw cap bottle. Dichloromethane was added to the screw cap bottle until the samples
were soaked, and the PAHs were extracted with dichloromethane in an ultrasonic water
bath for one hour without temperature rise. For the extraction, a surrogate spike of
acenaphthene-d10, perylene-d10, chrysene-d10, and phenanthrene-d10 was added. The
extract was concentrated into 2 mL by N2-gas.
For both dissolved and particulate extracts, the PAH concentration was analyzed by
using a gas chromatograph equipped with a mass spectrometer (GC-17A/MS-QP5050;
SHIMADZU) and operated in the single-ion monitoring mode. Injection was split with
the detector, and the inlet temperature was set at 230℃. The initial temperature was
80℃ held for 2 min, ramped at 30℃ min-1 to 210℃, ramped at 5℃ min-1 to 295℃,
and ramped at 2℃ min-1 to 315℃. In this study, the 16 PAHs were determined (Table
1).
Table 1 - 16 PAHs Analyzed in This Study.
The following presented PAHs values were the sums of these 16 PAHs. The detection
limit was set at the level of 3 in the SN ratio. Detection limits ranged from 1 to 5 ng for
individual PAHs. Within this level, the CV ratio of each of the compounds was less than
20 %. Quality of extraction was checked using dried marine sediments (HS-3B,
National Research Council of Canada Institute for Marine Biosciences). The recovery
averaged 40~70% for all PAHs, and the repetition error was 5~10%.
RESULTS AND DISCUSSION
Flow rate and runoff ratio
Flow rate and PAH concentrations were measured in rainy days and non-rainy days. The
precipitation conditions and PAH concentrations and loadings were summarized in
Table 2.
Table 2 - Precipitation Conditions, PAH concentration and Loading.
EMC: event mean concentration
- 111 -
Journal of Water and Environment Technology, Vol. 7, No. 2, 2009
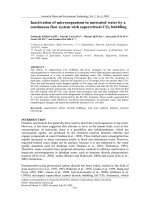
Prior to the PAHs sampling, flow velocity and depth rate were measured during several
precipitation events, and from the measurements, the H-Q curve was determined for
Kurose River. Based on the obtained H-Q curve, the river flow at each sampling
campaign was determined from the measurements of water depth. An example of the
precipitation and flow rate was shown in Figure 2.
-1
Flow rate (m s )
Flow rate
Precipitation amount
2
3
4
8
6
4
8
-1
12
Rain precipitation (mm h )
0
16
0
10
2006/12/13 2006/12/13 2006/12/13 2006/12/14 2006/12/14 2006/12/14 2006/12/14
6:00
12:00
18:00
0:00
6:00
12:00
18:00
Figure 2 - Change in Flow Rate with Time (Dec. 13~14, 2006).
Based on the change of flow rate with time, specific discharge was calculated for
estimating runoff ratio of each measured precipitation event. Specific discharge is
defined as the ratio of runoff loadings to the area of a river basin, and runoff ratio is
defined as the ratio of specific discharge to precipitation amount. Runoff loadings were
obtained by the subtraction of base flow from total flow in a rainfall event. For
separation of base flow from the total river flow in the rainfall time, base flow was
supposed to be constant throughout a precipitation event, and the level was thought to
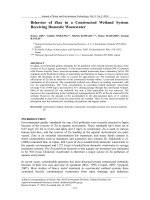
be equal to that measured just before precipitation began. Figures 3 and 4 showed the
dependence of specific discharge and runoff ratio on precipitation amount for all the
measured precipitation events. The obtained runoff ratio values increased with
precipitation amounts, and maximum runoff ratio value was 55% at 40 mm of
precipitation (Jul. 23~24 in 2006), although it was less than 15% when precipitation was
less than 15 mm. It was suggested that the outflow would decrease almost into the
negligible level owing to the percolation of the rainfall into the subsurface layer through
permeable surface areas (forests, rice fields, and other fields), which accounts for 60
percent of the total land use in Kurose River basin area (Higashihiroshima City, 2000).
Figure 3 - Specific Discharge for Each Precipitation Event.
- 112 -
Journal of Water and Environment Technology, Vol. 7, No. 2, 2009
Figure 4 - Runoff Ratio for Each Precipitation Event.
100
0
80
2
60
4
6
40
PAH concentration
20
Precipitation amount
8
Rain precipitation (mm h-1)
PAH concentration (ng L-1)
PAH concentrations
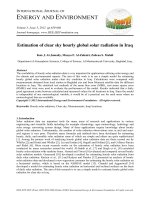
PAH concentrations were measured several times during each precipitation event.
Figure 5 shows an example of measurement results at a precipitation event. The graph
shows the results of the sum of 16 PAHs concentration (sum of particulate and
dissolved PAHs) changed through a precipitation. The PAH concentration was stable
before precipitation began, and the PAH concentration increased with flow rate.
10
0
2006/12/13 2006/12/13 2006/12/13 2006/12/14 2006/12/14 2006/12/14 2006/12/14
6:00
12:00
18:00
0:00
6:00
12:00
18:00
Time and data
Figure 5 - Change in PAH concentration with Time (Dec. 13~14, 2006).
From all the measurements, the event-mean concentration (EMC) of PAHs was
calculated for all the rainfall and non-rainfall samplings (Figure 6). On rainy days, the
PAH concentrations ranged from 12 to 58 ng L-1 for dissolved PAHs, and from 8 to 105
ng L-1 for particulate PAHs. In non-rainy days, they ranged from 10 to 58 ng L-1 for
dissolved PAHs, and from 4 to 418 ng L-1 for particulate PAHs.
- 113 -
Journal of Water and Environment Technology, Vol. 7, No. 2, 2009
(a) Rainfall (EMC)
(b) Non-rainfall
(For the samplings of Dec. 11~17 and 21~22, the simple average was taken.)
Figure 6 - PAHs concentration on Each Sampling Date.
In non-rainy days, besides the samplings before the precipitation, a 24-hours sampling
(Dec. 21~22) and one-week sampling (Dec. 11~17) were conducted. From the
measurements, PAH concentrations in non-rainy days were clarified to be stable for
diurnal and weekly terms (Figures 7 and 8). During one-week samplings, it rained once
(Dec. 13~14; corresponds to at 48 hours in Figure 7) and the higher concentration of
particulate PAHs at this time would be due to this rainfall.
Figure 7 - PAH concentration on Dec. 11~17 (‘06).
Figure 8 - PAH concentration on Dec. 21~22 (‘06).
- 114 -
Journal of Water and Environment Technology, Vol. 7, No. 2, 2009
Relation to the basic water qualities
The relation of dissolved 16 PAHs concentration and EC, DOC was shown in Figures 9
and 10. The relation of particulate PAH contents (=PAH concentration/SS
concentration) and SS concentration was shown in Figure 11. In this graph, the plots
were separated into four seasons, and summer (Jun.~Aug.) and winter season
(Dec.~Feb.) were shown. Firstly, dissolved PAHs were significantly negatively
correlated to EC (P<0.05; Pearson correlation test), but not to DOC. For particulate
PAHs also, clear negative correlation with the SS concentration (Figure 11). Higher SS
concentration occurred mostly during heavier rains, and this suggests rain soil SS
discharges did not mainly contribute to the particulate PAHs loading. For seasonal
variations, the particulate PAHs contents in winter season were higher than those of
summer season in Figure 11. This result shows that particulate PAHs were contained
more in winter season. For dissolved PAHs, on the other hand, significant differences in
seasons were not observed in the measurements.
Figure 9 - Relation of EC and Dissolved PAH concentration.
Figure 10 - Relation of DOC and Dissolved PAH concentration.
- 115 -
Journal of Water and Environment Technology, Vol. 7, No. 2, 2009
-1
Particulate PAHs content (ng g )
100000
Summer season
Winter season
10000
1000
100
1
10
100
1000
-1
SS (mg L )
Figure 11 - Relation of SS and Particulate PAHs Content.
60
50
50
30
Ind
B(ghi)P
B(a)P
D(ah)A
B(k)F
B(e)P
Chr
B(b)F
B(a)A
Flt
Pyr
Ind
B(ghi)P
B(a)P
D(ah)A
B(k)F
B(e)P
Chr
B(b)F
B(a)A
Flt
Pyr
Ant
Flu
0
Phe
0
Act
10
Ant
20
10
Flu
20
40
Phe
30
Act
40
Ace
Composition ratio (%)
60
Ace
Composition ratio (%)
PAH concentration profile
Averaged composition ratio of individual PAHs for all the samplings was shown in
Figure 12. For both dissolved and particulate PAHs, the composition ratio of lower
molecular PAHs (Ace~Pyr) was higher than that of higher molecular PAHs (Chr~Ind),
and for particulate PAHs, higher molecular PAHs concentration was higher than that of
dissolved PAHs.
(a) Dissolved PAHs
(b) Particulate PAHs
Figure 12 - Averaged Composition Ratio of Individual PAH
(Error bar represents standard deviation)
Loadings of PAHs
The loadings of PAHs for each precipitation event was calculated with the change in
PAH concentration and flow rate with time. An example of the calculation scheme was
shown in Figure 13.
- 116 -
Journal of Water and Environment Technology, Vol. 7, No. 2, 2009
1.4
Load of PAHs (mg s-1)
1.2
Load of PAHs at rainfall
1.0
0.8
0.6
0.4
0.2
Load of PAHs at no rainfall
0.0
2006/12/13 2006/12/13 2006/12/13 2006/12/14 2006/12/14 2006/12/14 2006/12/14
6:00
12:00
18:00
0:00
6:00
12:00
18:00
Time and data
Figure 13 - Change in Load of Particulate PAHs with Time (Dec. 13~14, 2006).
From the calculations, the total runoff load of PAHs in each rainfall event was
calculated and the relation between precipitation and the load of PAHs during each
rainfall event was shown in Figure 14. This tendency was basically similar to that of the
runoff ratio (Figure 4). So it could also be deduced that the outflow of PAHs did not
happen easily when there was less than a certain amount of precipitation. The load of
PAHs increased with precipitation amount and reached 130 g at 40 mm of precipitation.
Similarly, the load of PAHs on non-rainy days was calculated for all samplings (Figure
15). The range of them was from 4 to 18 g day-1 (average: 9.6 g day-1). The load of
PAHs was fairly stable throughout the measurements, and no clear seasonal fluctuation
was observed. From the obtained load of PAHs, the yearly PAHs loadings were
estimated using the meteorological data of 2006. The meteorological data was obtained
from the Japan Meteorological Agency, and the data at Higashihiroshima was used for
this calculation. The daily precipitation data was used for this calculation. For the
summation of PAHs loadings of rainfall, the loadings were supposed to follow the
precipitation amount with a linear relation depicted in Figure 14. In this relation,
loading becomes less than zero at <3.5 mm of precipitation. In this case, loading was
assumed to be zero. Also, this relation is not validated more than 40 mm of precipitation
experimentarily. Since there were 12 precipitation events more than 40 mm occurred in
this period, the calculation should include this uncertainty. For the calculation of each
rainfall event, one rainfall event was hypothesized to continue one day, and even in the
case when the actual rainfall continued over two days, it was regarded as two different
rainfall events occur in each day (in 2006, 53 days of rainfall occurred, and consecutive
rainfall occurred 11 times, and the maximum duration of consecutive rainfall was 2
days).
For the summation of the loadings of non-rainfall days, the loadings were supposed to
be constant throughout each day, and the mean PAHs loadings were obtained by the
average of all the measurements (Figure 16). The non-rainy loading was supposed to
occur at rainy days, also.
- 117 -
Journal of Water and Environment Technology, Vol. 7, No. 2, 2009
Figure 14 - Relation of Load of PAHs on Each Rainy Day and Precipitation Amount.
Figure 15 - Load of PAHs on Each Non-rainy Day.
The calculated yearly PAHs specific loading in the Kurose River was 37 µg m-2 year-1
on rainy days, and 29 µg m-2 year-1 on non-rainy days. The total loading was 66 µg m-2
year-1.
For comparing the river discharge loading, the yearly loadings arisen from road traffic
and atmospheric deposition were estimated in this river basin area. The road traffic
loadings and atmospheric deposition were investigated in our previous studies (Ozaki et
al 2006 and 2007). In these studies, road traffic loading was calculated for this river
basin area with an atmospheric diffusion simulation model developed by the National
Institute of Advanced Industrial Science and Technology (AIST-ADMER).
Atmospheric deposition was calculated for the same area for dry and wet deposition for
one year (2003) by our group. From these calculations, the PAHs river discharge
obtained in this investigation can be compared to the road traffic and the atmospheric
deposition in this area (Figure 17; in order to compare with the road traffic loading, the
loading for 10 PAHs (Pyr~Ind) was also calculated similarly because the road traffic
was calculated was only for 10 PAHs). The load of the Kurose River was higher than
that of the traffic loading, and comparable to that of the atmospheric deposition. From
the comparison, the underestimation of the road traffic, or the existence of other major
sources than traffic activities was suggested.
- 118 -
Journal of Water and Environment Technology, Vol. 7, No. 2, 2009
1000
Rainy days
Non-rainy days
800
600
400
200
0
Jan. Feb. Mar. Apr. May Jun. Jul. Aug. Sep. Oct. Nov. Dec.
2006
Figure 16 - Estimated Monthly PAHs Loading in Kurose River Basin Area.
Figure 17 - Yearly PAHs Loadings in Kurose River Basin Area.
CONCLUSIONS
This study primarily obtained flow rate of water and change in PAH concentration with
time measured on rainy and non-rainy days in the Kurose River. On rainy days, the
PAH concentrations ranged from 12 to 58 ng L-1 for dissolved PAHs, and from 8 to 105
ng L-1 for particulate PAHs. On non-rainy days, they ranged from 10 to 58 ng L-1 for
dissolved PAHs, and from 4 to 418 ng L-1 for particulate PAHs. From the results of
non-rainy samplings, it was shown that PAH concentrations were stable during the
non-rainy periods through a year. For the relations to the basic water qualities, the
negative correlation was obtained between EC and dissolved PAH concentration. For
particulate PAHs, their content was negatively correlated with SS concentration,
suggesting that PAHs were not included mainly in soil particles running into rivers on
rainy days. Using flow rate of water and change in PAH concentration with time, yearly
PAHs loadings were calculated. This study obtained 66 µg m-2 year-1 of PAHs loading
in the Kurose River, and loading on rainy days and that on non-rainy days was clarified
to be in the same order. The yearly PAHs loadings were compared to road traffic and
atmospheric deposition in the river basin area. The value of the yearly load was
comparable with that of atmospheric deposition. From the comparison, the
underestimation of the road traffic, or the existence of other major sources than traffic
activities was suggested.
REFERENCES
Baek S. O., Field R. A., Goldstone M. E., Kirk P. W., Lester J. N. and Perry R. (1991). A
- 119 -
Journal of Water and Environment Technology, Vol. 7, No. 2, 2009
review of atmospheric polycyclic aromatic hydrocarbons: Sources, fate and behavior,
Water, Air, and Soil pollut., 60, 279-300.
Dipple A., (1985). Polycyclic aromatic hydrocarbon carcinogenesis, ACS. Symp. Ser.
(Am.Chem.Soc), 283-285.
Higashihiroshima City (2000). Kurose River living drainage measures promotion plan
(in Japanese), Higashihiroshima City, Japan.
Japan Meteorological Agency. />Kumata H., Uchida M., Sakuma E., Uchida T., Fujiwara K., Tsuzuki M., Yoneda M. and
Shibata Y. (2006). Compound class specific 14C analysis of polycyclic aromatic
hydrocarbons associated with PM10 and PM1.1 aerosols from residential areas of
suburban Tokyo, Environmental Science & Technology, 40, 3474-3480.
Lee W., Wand Y., Lin T., Chen Y., Lin W., Ku C. and Cheng J. (1995). PAH
characteristics in the ambient air of traffic-source, The Science of Total Environment,
159, 185-200.
Ozaki N., Nitta K., Sugihara T., Fukushima T. and Komatsu T. (2003). Emission and
dispersion of PAHs from heavy traffic road, Air Pollution, Ⅺ, 623-632.
Ozaki N. (2006). Integrative estimation of total mass flux of trace toxic chemicals on a
scale of river basin area, Journal of Japan Society on Water Environment, 9,
145-146 (in Japanese)
Ozaki N., Nitta K. and Fukushima T. (2006). Dispersion and dry and wet deposition of
PAHs in an atmospheric environment, Water Science & Technology, 53(2), 215-224.
Ozaki N., Tokumitsu H., Kojima K. and Kindaichi T. (2007). Estimation of the emission
factors of PAHs by traffic with the model of atmospheric dispersion and deposition
from heavy traffic road, Water Science & Technology, 56(1), 233-242.
Sharma M., Marsalek J. and McBean E. (1994). Migration pathways and remediation of
urban runoff for PAH control, J. Environ. Manage., 41, 325-336.
Takada H., Onda T. and Ogura N. (1990). Determination of polycyclic aromatic
hydrocarbons in urban street dusts and their source materials by capillary gas
chromatography, Environmental Science & Technology, 24, 1179-1186.
Vinggaard A. M., Hnida C. and Larsen J.C. (2000). Environmental polycyclic aromatic
hydrocarbons affect androgen receptor activation in vitro, Toxicology, 145, 159-169.
Wan X., Chen J., Tian F., Sun W., Yang F. and Saiki K. (2006). Source apportionment of
PAHs in atmospheric particulates of Dalian: Factor analysis with nonnegative
constraints and emission inventory analysis, Atmospheric Environment, 40,
6666-6675.
Xue W. and Warshawsky D. (2005). Metabolic activation of polycyclic and heterocyclic
aromatic hydrocarbons and DNA damage: A review, Toxicology and Applied
Pharmacology, 206, 73-93.
- 120 -