Selection and Evaluation of Potential Reference Genes for Gene Expression Analysis in the Brown Planthopper, Nilaparvata lugens (Hemiptera: Delphacidae) Using ReverseTranscription Quantitative PCR
Bạn đang xem bản rút gọn của tài liệu. Xem và tải ngay bản đầy đủ của tài liệu tại đây (248.35 KB, 10 trang )
Selection and Evaluation of Potential Reference Genes
for Gene Expression Analysis in the Brown Planthopper,
Nilaparvata lugens (Hemiptera: Delphacidae) Using
Reverse-Transcription Quantitative PCR
Miao Yuan1., Yanhui Lu1., Xun Zhu1, Hu Wan1, Muhammad Shakeel1, Sha Zhan1, Byung-Rae Jin2,
Jianhong Li1*
1 Laboratory of Pesticide, College of Plant Science & Technology, Huazhong Agricultural University, Wuhan, China, 2 Laboratory of Insect Molecular Biology and
Biotechnology, Department of Applied Biology, College of Natural Resources and Life Science, Dong-A University, Busan, Korea
Abstract
The brown planthopper (BPH), Nilaparvata lugens (Hemiptera, Delphacidae), is one of the most important rice pests.
Abundant genetic studies on BPH have been conducted using reverse-transcription quantitative real-time PCR (qRT-PCR).
Using qRT-PCR, the expression levels of target genes are calculated on the basis of endogenous controls. These genes need
to be appropriately selected by experimentally assessing whether they are stably expressed under different conditions.
However, such studies on potential reference genes in N. lugens are lacking. In this paper, we presented a systematic
exploration of eight candidate reference genes in N. lugens, namely, actin 1 (ACT), muscle actin (MACT), ribosomal protein
S11 (RPS11), ribosomal protein S15e (RPS15), alpha 2-tubulin (TUB), elongation factor 1 delta (EF), 18S ribosomal RNA (18S),
and arginine kinase (AK) and used four alternative methods (BestKeeper, geNorm, NormFinder, and the delta Ct method) to
evaluate the suitability of these genes as endogenous controls. We examined their expression levels among different
experimental factors (developmental stage, body part, geographic population, temperature variation, pesticide exposure,
diet change, and starvation) following the MIQE (Minimum Information for publication of Quantitative real time PCR
Experiments) guidelines. Based on the results of RefFinder, which integrates four currently available major software
programs to compare and rank the tested candidate reference genes, RPS15, RPS11, and TUB were found to be the most
suitable reference genes in different developmental stages, body parts, and geographic populations, respectively. RPS15
was the most suitable gene under different temperature and diet conditions, while RPS11 was the most suitable gene under
different pesticide exposure and starvation conditions. This work sheds light on establishing a standardized qRT-PCR
procedure in N. lugens, and serves as a starting point for screening for reference genes for expression studies of related
insects.
Citation: Yuan M, Lu Y, Zhu X, Wan H, Shakeel M, et al. (2014) Selection and Evaluation of Potential Reference Genes for Gene Expression Analysis in the Brown
Planthopper, Nilaparvata lugens (Hemiptera: Delphacidae) Using Reverse-Transcription Quantitative PCR. PLoS ONE 9(1): e86503. doi:10.1371/journal.
pone.0086503
Editor: Xiao-Wei Wang, Zhejiang University, China
Received June 27, 2013; Accepted December 10, 2013; Published January 23, 2014
Copyright: ß 2014 Yuan et al. This is an open-access article distributed under the terms of the Creative Commons Attribution License, which permits
unrestricted use, distribution, and reproduction in any medium, provided the original author and source are credited.
Funding: This research was supported by China Hubei Province Science & Technology Department (No. 2009BFA011). The funders had no role in study design,
data collection and analysis, decision to publish, or preparation of the manuscript.
Competing Interests: The authors have declared that no competing interests exist.
* E-mail:
. These authors contributed equally to this work.
resistance to pesticides, N. lugens infestations are difficult to control
[6].
Quantitative real-time reverse-transcription polymerase chain
reaction (qRT-PCR) is the most sensitive and accurate method to
measure variations in mRNA expression levels of a single gene in
different experimental and clinical conditions [7,8]. At present,
RNA interference (RNAi) is an effective tool to control important
insect pests via gene silencing [9,10,11,12,13]. Interestingly,
several studies have shown that injection or ingestion of dsRNAs
in N. lugens can reduce the transcript levels of target genes
[14,15,16]. On the other hand, the sequencing of N.lugens genome
has been recently included in the 5000 insect genome initiative
( somehow reflecting the
economic importance of this pest. Meanwhile, enormous progress
Introduction
The brown planthopper (BPH), Nilaparvata lugens (N. lugens), is
the most devastating rice pest in extensive areas throughout Asia
[1]. The BPH ingests nutrients specifically from the phloem of rice
plants with its stylet, causing the entire plant to become yellow and
dry rapidly, a phenomenon referred to as hopperburn [2]. In
addition, BPH is a vector of viruses that cause diseases in rice, such
as Rice ragged stunt virus (RRSV) and Rice grassy stunt virus (RGSV)
[3]. In recent years, N. lugens outbreaks have occurred more
frequently in the Yangtze River Delta areas and in the South of
China [4,5]. Because of its long-distance migration, quick
adaptation to resistant rice varieties and development of high
PLOS ONE | www.plosone.org
1
January 2014 | Volume 9 | Issue 1 | e86503
Study of Reference Genes in Nilaparvata lugens
has been made by means of the sequencing of N. lugens ESTs from
various tissues [17], transcriptome analysis [18], and pyrosequencing the midgut transcriptome [19]. These data provided
comprehensive gene expression information at the transcriptional
level that could facilitate our understanding of the molecular
mechanisms underlying various physiological aspects including
development, wing dimorphism and sex difference in BPH. For
precise and reliable gene expression results, normalization of
quantitative real-time PCR data is required against a control gene,
which is typically a gene that shows highly uniform expression in
living organisms during various phases of development under
different environmental or experimental conditions [20]. Quantitative assays frequently use housekeeping genes such as b-actin,
glyceraldehyde-3-phosphate dehydrogenase (GAPDH), tubulin,
and 18S ribosomal RNA (rRNA) because they are necessary for
survival and are synthesized in all nucleated cell types. It is often
considered that there are only a few fluctuations in the
transcription of these genes compared to others [21,22,23].
However, numerous studies show that the expression levels of
these housekeeping genes also vary in different situations [24,25].
Although qRT-PCR is a highly reliable method for measuring
gene transcript levels, if the reference genes are not selected
properly, it will result in inaccurate calculation of the normalization factor and consequently obscure actual biological differences
among samples. Therefore, it is necessary to validate the
expression stability of control genes under specific experimental
conditions before using them for normalization. Reference genes
in qRT-PCR studies on BPH have often been selected based on
consensus and experience in other species rather than empirical
evidence in support of their efficacy [1,14,15,16]. There is
therefore a definite need to analyze the expression of these genes
in different body parts in different populations, under different
experimental conditions, and at different stages of development.
This study examined the stability of eight reference genes, actin 1
(ACT), muscle actin (MACT), ribosomal protein S11 (RPS11),
ribosomal protein S15e (RPS15), alpha 2-tubulin (TUB), elongation factor 1 delta (EF), 18S ribosomal RNA (18S), and arginine
kinase (AK), in N. lugens in terms of different factors (developmental
stage, body part, geographic population, temperature variation,
pesticide treatment, diet change, and starvation).
(3)
(4)
(5)
Materials and Methods
Insects
Unless stated, the laboratory population of N. lugens was
originally collected from Changsha, Hunan, People’s Republic of
China in 2009 and artificially maintained in our lab since. The
laboratory strain and other populations used in this experiment are
from different fields which no specific permissions were required,
because these fields are the experimental plots of Huazhong
Agricultural University, Wuhan, Hubei, China. The insects were
reared on rice (Shanyou 63) in a thermostatic chamber. The
chamber was maintained at 80% relative humidity, 25uC62uC
temperature and a 14:10 h light:dark cycle.
(6)
Treatments
(1) Developmental stage: For each treatment group, 6 samples
each of about 50 one-day-old eggs, 50 1st instar nymphs, 30
2nd instar nymphs, 20 3rd instar nymphs, 20 4th instar
nymphs, 20 5th instar nymphs, 20 adult females, and 20 adult
males of N. lugens were collected.
(2) Body part: A dissection needle and a tweezer (Dumont, World
Precision Instruments, USA) were used to obtain head,
thorax, and abdomen from virgin adult males and females
PLOS ONE | www.plosone.org
(7)
2
from the N. lugens laboratory population. Besides, virgin adult
males and females were collected as whole-body samples. For
each treatment group, 6 samples of 20 insects each were
collected.
Geographic population: One geographic population was
originally collected from Changsha, Hunan, China, which
was maintained with no exposure to insecticides. The other
population was generously provided by Dr. Manqun Wang
(Huazhong Agricultural University), which was originally
collected from Wuhan, Hubei, China. These two places are
approximately 310 kilometers apart. Both these populations
have been maintained for more than 3 years in our
laboratory. Third instar nymphs and adults were collected.
For each treatment group, 6 samples of 20 insects each were
collected.
Temperature-induced stress: Third instar nymphs were
divided into 10 groups and then each group was exposed
for 5 min to each temperature: extremely low temperatures
(4uC, 8uC, and 12uC), low temperatures (16uC and 20uC),
average temperatures (24uC and 28uC), and high temperatures (32uC, 36uC and 40uC). For each treatment group, 6
samples of 20 insects each were collected. There was no
mortality in response to the temperature treatment.
Pesticide-induced stress: The stability of candidate reference
genes was tested in 3rd instar nymphs subjected to 6 different
pesticide treatments: compound pesticide (abamectin 3.6 mg/
L+nitenpyram 0.2 mg/L), nitenpyram (0.4 mg/L), pymetrozine (42.08 mg/L), buprofezin (1.19 mg/L), isoprocarb
(34.91 mg/L), and chlorpyrifos (52.27 mg/L). The concentration of pesticide was LC50 and opted by the results of
bioassay (Table S1). The testing pesticide solutions were made
using water containing 0.1% w/v Triton X-100 (Beijing
Solarbio Science and Technology Co. Ltd., China). The roots
of the rice seedlings were tightly packaged by the absorbent
cotton. The seedlings were completely dipped in the testing
solutions for 5 s and then air dried for 10–15 min depending
on the ambient relative humidity (c-online.
org/content/uploads/2009/09/Method_005_v3_june09.
pdf). Third instar nymphs were collected from the laboratory
population and then transferred into the transparent plastic
tube which contained the testing seedlings. Water containing
0.1% w/v Triton X-100 was used as a separate control group
for each pesticide treatment. Because of the different
mechanism of action of the testing pesticide, the living insects
were collected after 4, 4, 7, 5, 3 and 3 days for compound
pesticide, nitenpyram, pymetrozine, buprofezin, isoprocarb,
and chlorpyrifos treatments, respectively [26,27,28]. For each
treatment group, 6 samples of 50 insects each were collected.
Diet-induced stress: Our third treatment condition involved
the stability of reference gene expression in N. lugens
challenged with different diets: artificial diet [29], Taichung
Native 1 rice (TN1), Minghui 63 rice (MH63), transgenic rice
Huahui 1 rice (HH1), Shanyou 63 rice (SY63), and transgenic
rice Bt Shanyou 63 rice (BTSY63). The seeds of TN1, MH63,
HH1, SY63, and BTSY63 were generously provided by Dr.
Yongjun Lin (Huazhong Agricultural University). Newly
hatched nymphs were collected and then reared on different
diets. From each diet group, 3rd instar nymphs and adults
were collected. For each treatment group, 6 replications of 20
insects each were collected.
Starvation-induced stress: Third instar nymphs and adults
were collected in separate glass cylinders (15.0 cm in length
and 2.5 cm in diameter) covered by Parafilm M (Bemis, USA)
January 2014 | Volume 9 | Issue 1 | e86503
Study of Reference Genes in Nilaparvata lugens
Table 1. Function, primer sequence and amplicon characteristics of the candidate reference genes used in this study.
Gene symbol Gene name
(putative) Function
Gene ID
Primer sequences [59R39]
L (bp)a
E (%)b
R2c
ACT
Involved in cell motility,
ABY48093.1
For 59 TGCGTGACATCAAGGAGAAG 39
283
96.7
0.997
179
101.7
0.997
159
93.5
0.997
150
101.5
0.999
174
101.7
0.995
150
103.9
0.996
170
107.2
0.990
186
98.3
0.998
actin 1
structure and integrity
MACT
muscle actin
Involved in cell motility,
Rev 59 GTACCACCGGACAGGACAGT 39
ADB92676.1
structure and integrity
RPS11
ribosomal protein S11
Structural constituent of
Rev 59 ACTTCTCCAGGGAGGTGGAGGCG 39
ACN79505.1
ribosome
RPS15
ribosomal protein S15
Structural constituent of
a-tubulin
Cytoskeleton structural
ACN79501.1
elongation factor 1 delta Structural constituent of
ACN79512.1
18S ribosomal RNA
Cytosolic small ribosomal
DQ445523.1
arginine kinase
Key enzyme for cellular
For 59 GAAGTAGCTCTGGCACAGGA 39
Rev 59 TTGACGAGCCTTTGCTACCT 39
JN662398.1
subunit
AK
For 59 ACTCGTTCGGAGGAGGCACC 39
Rev 59 GTTCCAGGGTGGTGTGGGTGGT 39
ribosome
18S
For 59 TAAAAATGGCAGACGAAGAGCCCAA 39
Rev 59 TTCCACGGTTGAAACGTCTGCG 39
protein
EF
For 59 CCGATCGTGTGGCGTTGAAGGG 39
Rev 59 ATGGCCGACATTCTTCCAGGTCC 39
ribosome
TUB
For 59 CTTGGCTGGTCGTGACTTGACCGA 39
For 59 GTAACCCGCTGAACCTCC 39
Rev 59 GTCCGAAGACCTCACTAAATCA 39
AAT77152.1
For 59 ACCACAACGACAACAAGACCTTCC 39
Rev 59 TGGGACAGAAAGTCAGGAATCCCA 39
energy metabolism
a
Length of the amplicon.
Real-time qPCR efficiency (calculated by the standard curve method).
Reproducibility of the real-time qPCR reaction.
doi:10.1371/journal.pone.0086503.t001
b
c
with no food in a thermostatic chamber; they were kept there
for two days. We used a satiation group (3rd instar nymphs
and adults fed on SY63) as the control group. For each
treatment group, 6 samples of 50 insects each were collected.
The mortality rate was approximately 30%.
Primer Design
The sequences of all candidate reference genes were downloaded from GenBank ( and
UNKA (BPH) EST BLAST database (.
jp/). The PCR primer sequences used for quantification of the
expression of the genes encoding ACT, MACT, RPS11, RPS15,
TUB, EF, 18S, and AK are shown in Table 1. The secondary
structure of the template was analyzed with UNAFold using
the DNA folding form of the mfold web server (.
albany.edu/?q = mfold/DNA-Folding-Form) [30] with the following settings: melting temperature, 60uC; DNA sequence, linear;
Na+ concentration, 50 mM; Mg2+ concentration, 3 mM. The
other parameters were set by default. The primers were designed
on the NCBI-Primer-BLAST website (.
gov/tools/primer-blast/index.cgi?LINK_LOC = BlastHome). The
settings in NCBI-Primer-BLAST were as follows: primer melting
temperature, 57–63uC; primer GC content, 40–60%; and PCR
product size, 150–300 base pairs. The excluded regions were
determined using mfold, and the other parameters were set by
default. Four primer pairs were designed for each gene. The
length of PCR products was assessed using gel electrophoresis,
and the identity of the PCR products was confirmed by
sequence analysis. Only primers which could not amplify nonspecific products and dimmers were employed. A 10-fold
dilution series of cDNA from the whole body of adults was
employed as a standard curve, and the reverse-transcription
qPCR efficiency was determined for each gene and each
treatment, using the linear regression model [31]. The
corresponding qRT-PCR efficiencies (E) were calculated according to the equation: E = (10[21/slope]21)6100 [32]. After
detecting the efficiencies of the chosen primers, the primers
which displayed a coefficient of correlation greater than 0.99
and efficiencies between 95% and 108% were selected for the
next qRT-PCR (Table 1).
Total RNA Extraction and cDNA Synthesis
All collected insects were preserved in a clean micro-centrifuge
tube (1.5 ml) and stored at 280uC after freezing in liquid nitrogen.
Six total RNA samples were prepared for each developmental and
treatment group. Subsequently, total RNA was extracted using a
SV Total RNA Isolation System (Promega, USA). According to
the manufacturer’s protocol, total RNA was incubated for 15 min
at 20–25uC after adding 5 ml DNase I enzyme (Promega, USA).
The quality and quantity of RNA were assessed with a UV-1800
spectrophotometer (SHIMADZU, Japan). Only samples with a
260/280 ratio of 1.9 to 2.1, which indicates no protein
contamination, and a 260/230 ratio of 2.0 to 2.4, which indicates
no guanidine thiocyanate contamination were considered. Total
RNA concentration ranged from 447 to 1071 ng/ml according to
spectrophotometric determination. The A260:A280 values of the
isolated total RNA ranged from 1.914 to 1.966, indicating the high
purity of the total RNA. The integrity of total RNA was confirmed
by 1% agarose gel electrophoresis. CDNA was produced using
the PrimeScript 1st Strand cDNA Synthesis Kit (TAKARA, Japan)
in a total volume of 20 ml, with 4 ml 56PrimeScript Buffer,1 mg
of total RNA, 1 ml oligo dT primer, 1 ml PrimeScript RTase
(200 U/ml), and 0.5 ml RNase Inhibitor (40 U/ml). Following the
manufacturer’s protocol, the 20 ul mixture was incubated for
60 min at 42uC. No-template and no-reverse-transcription controls were included for each reverse-transcription run for the
control treatment. CDNA was stored at 220uC for later use.
PLOS ONE | www.plosone.org
3
January 2014 | Volume 9 | Issue 1 | e86503
Study of Reference Genes in Nilaparvata lugens
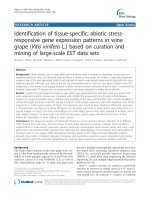
Figure 1. Expression levels of candidate reference genes. The expression level of candidate N. lugens reference genes in the total samples is
shown in terms of the cycle threshold number (Ct-value). The data are expressed as whisker box plots; the box represents the 25th–75th percentiles,
the median is indicated by a bar across the box, the whiskers on each box represent the minimum and maximum values.
doi:10.1371/journal.pone.0086503.g001
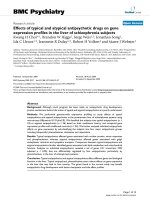
gene was set to 1) were used as input data for geNorm and
NormFinder. geNorm algorithm first calculates an expression
stability value (M) for each gene and then compares the pairwise
variation (V) of this gene with the others. Reference genes are
ranked according to their expression stability by a repeated process
of stepwise exclusion of the least stably expressed genes. The
geNorm program also indicates the minimum number of reference
genes for accurate normalization by the pairwise variation value.
The value of Vn/n+1 under 0.15 means that no additional genes
are required for normalization [35]. NormFinder provides a
stability value for each gene which is a direct measure for the
estimated expression variation enabling the user to evaluate the
systematic error introduced when using the gene for normalization
[36]. The delta Ct method compares relative expression of pairs of
genes within each sample to confidently identify useful housekeeping genes [37]. A user-friendly web-based comprehensive tool,
RefFinder
( />php?type = reference) was used, integrating four currently available major software programs to compare and ranking the tested
candidate reference genes. Based on the rankings from each
program, RefFinder assigns an appropriate weight to an individual
gene and calculates the geometric mean of their weights for the
overall final ranking. According to the results of RefFinder,
candidate genes with the lower ranking were considered to be
most stably expressed under tested experimental conditions, and
thus could be selected as ideal reference genes.
Reverse-transcription qPCR Assays
st
Triplicate 1 -strand DNA aliquots for each treatment served as
templates for qRT-PCR using SsoFastTM EvaGreenH Supermix
(Bio-Rad) on a Bio-Rad iQ2 Optical System (Bio-Rad). Amplification reactions were performed in a 20 ml volume with 1 ml of
cDNA and 100 nM of each primer, in iQTM 96-well PCR plates
(Bio-Rad) covered with Microseal ‘‘B’’ adhesive seals (Bio-Rad).
Thermal cycling conditions were as follows: initial denaturation
temperature, 95uC for 30 s, followed by 40 cycles at 95uC for 5 s
and 60uC for 10 s. After the reaction, a melting curve analysis
from 65uC to 95uC was applied to ensure consistency and
specificity of the amplified product.
Data Mining and Selection of Reference Genes
Expression levels were determined as the number of cycles
needed for the amplification to reach a fixed threshold in the
exponential phase of the PCR reaction [33]. The number of cycles
is referred to as the threshold cycle (Ct) value. The threshold was
set at 500 for all genes. Four freely available software tools,
BestKeeper [34], geNorm version3.5 [35], NormFinder version
0.953 [36], and the delta Ct method [37] were used to evaluate
gene expression stability. The Excel based tool Bestkeeper, uses
raw data (Ct values) and PCR efficiency (E) to determine the bestsuited standards and combines them into an index by the
coefficient of determination and the P value [34]. Quantities
transformed to a linear scale (the highest relative quantity for each
PLOS ONE | www.plosone.org
4
January 2014 | Volume 9 | Issue 1 | e86503
Study of Reference Genes in Nilaparvata lugens
Interestingly, RPS15 showed high instability in the adults of
both different populations, and was ranked one of the least
stable genes in the 3rd instar nymphs of two different
populations (Table S6). GeNorm analysis revealed that all
the pairwise variation values were below the proposed 0.15
cut-off, except for V2/3 (Figure 2). According to geNorm,
three reference genes (RPS11, EF, and RPS15) should be
required for a suitable normalization in these two different
geographic populations.
(4) Temperature: All four programs identified RPS15 and TUB
as the most stable genes, and identified ACT as the least stable
gene (Table 2). From the results of RefFinder, the stability
ranking from the most stable to the least stable gene in the
temperature-stressed samples was RPS15, TUB, EF, RPS11,
AK, MACT, 18S, and ACT (Table S2). Under extremely low
temperature stress, AK was ranked one of the most stable
genes, while it was ranked one of the least stable genes under
low temperature stress (Table S7). TUB was the most stable
gene at average temperatures (Table S7). MACT, which was
ranked one of the least stable genes under extremely low
temperature, low temperature, and average temperature,
showed high expression stability under high-temperature
stress (Table S7). ACT was ranked as the least stable gene
in all temperature conditions (Table S7). GeNorm analysis
revealed that all the pairwise variation values were below the
proposed 0.15 cut-off (Figure 2). According to geNorm, three
reference genes (RPS15, TUB, and EF) should be required for
a suitable normalization in the different temperature treatment samples.
(5) Pesticide treatment: The stability ranking generated by the
Delta Ct method was same as the results obtained from
NormFinder and geNorm. The stability ranking generated by
BestKeeper was largely similar with the one obtained by the
other three methods. All four programs identified RPS11 and
EF as the most stable genes (Table 2). According to
RefFinder, the stability ranking from the most stable to the
least stable in the pesticide-stressed samples was RPS11, EF,
TUB, RPS15, 18S, AK, MACT, and ACT (Table S2). As can
be noticed, RPS11 was also the most stable gene in all
pesticide-treated samples (Table S2), compound-pesticidetreated samples, buprofezin-treated samples, and isoprocarbtreated samples (Table S8). EF and TUB were the most stable
genes in the nitenpyram-treated samples and chlorpyrifostreated samples (Table S8), respectively. MACT, which was
ranked one of the least stable genes in other pesticide
treatments, showed the highest stability in pymetrozinetreated samples (Table S8). GeNorm analysis revealed that
all the pairwise variation values were below the proposed 0.15
cut-off value (Figure 2). According to geNorm, three reference
genes (RPS11, EF, and TUB) should be required for a suitable
normalization in the pesticide-stressed samples.
(6) Diet: All four programs identified RPS15 as the most stable
gene, and identified ACT and MACT as the least stable genes
(Table 2). According to RefFinder, the stability ranking from
the most stable to the least stable in the different diets
treatments was RPS15, TUB, RPS11, EF, AK, 18S, ACT,
and MACT (Table S2). RPS15 was the most stable gene in N.
lugens reared on artificial diet, TN1, HH1 and SY63, and was
ranked second in the N. lugens reared on MH63 (Table S9).
However, RPS15 was the least stable gene in N. lugens reared
on BTSY63 (Table S9). The results also showed that RPS15
and RPS11 were the most stable genes in N. lugens reared on
non-genetically modified rice and genetically modified rice,
Results
Expression Profiles of Candidate Reference Genes
In order to evaluate gene expression levels of all studied
housekeeping genes within the whole sample set of N.lugens,
mRNA expressions for every gene were measured. Gene
expression levels showed a broad range of variance between Ctvalue 12.99 (ACT) and 26.43 (MACT) (Figure 1). Out of eight
studied genes, ACT (mean Ct-value 15.71) and 18S (mean Ctvalue 16.16) were expressed at the highest levels; TUB (mean Ctvalue 22.79) and EF (mean Ct-value 23.25) at the lowest levels.
The lowest expression variability within all samples was observed
for the gene RPS11 (mean Ct-value6SD, 20.6560.58) and
RPS15 (17.7460.69). ACT (15.7161.36) and MACT
(19.3761.39) showed the most variable expression within the
sample set.
Analysis of Gene Expression Stability
(1) Developmental stage: The stability ranking generated by the
Delta Ct method was largely similar with the results obtained
from BestKeeper and NormFinder. However, the most stable
genes ranking by geNorm analysis were different to the results
generated by the other three methods. All four programs
identified ACT and MACT as the least stable genes, and
RPS11, RPS15, and EF as the most stable genes except
geNorm (Table 2). According to the results of RefFinder, the
stability ranking from the most stable to the least stable in the
developmental stages was RPS15, RPS11, TUB, EF, 18S,
AK, ACT, and MACT (Table S2). As can be noticed, TUB
was the most stable gene across different nymphal stages and
across different sexes (Table S3). With geNorm, the V value of
0.154 obtained for the RPS15-RPS11 pair was near the
proposed cut-off value of 0.15. Moreover, the inclusion of
additional reference genes did not lower the V value below the
proposed 0.15 cut-off value until the fourth gene was added
(Figure 2). According to geNorm, four reference genes
(RPS15, TUB, 18S, and EF) should be required for a suitable
normalization in the different developmental stages.
(2) Body part: All four programs, except BestKeeper, identified
RPS11, RPS15, and 18S as the most stable genes (Table 2).
According to the results of RefFinder, the stability ranking
from the most stable to the least stable gene in different body
parts was RPS11, TUB, RPS15, 18S, ACT, MACT, EF, and
AK (Table S2). RPS11 was the most stable gene across the
different body parts of female and male adults (Table S4).
TUB was the most stable gene between males and females in
the head, thorax, and whole body (Table S5). However, TUB
displayed high instability between males and females in the
abdomen (Table S5). GeNorm analysis revealed that the
pairwise variation values were all above the cut-off value and
decreased with the added reference genes (Figure 2). These
results indicated that normalization with three stable reference
genes (RPS11, 18S, and RPS15) was required (as suggested by
the geNorm manual).
(3) Population: The stability ranking generated by the Delta Ct
method was largely similar with the results obtained by
NormFinder. All four programs, except geNorm, identified
TUB as the most stable gene (Table 2). According to the
results of RefFinder, the stability ranking from the most stable
to the least stable gene in the two different populations was
TUB, RPS11, EF, RPS15, AK, ACT, 18S, and MACT
(Table S2). EF and TUB showed high expression stability in
the nymphs and adults of these two populations, respectively.
PLOS ONE | www.plosone.org
5
January 2014 | Volume 9 | Issue 1 | e86503
Study of Reference Genes in Nilaparvata lugens
respectively (Table S10). In N. lugens nymphs reared on nongenetically modified rice, TUB was the most stable gene
(Table S10), while in N. lugens adults reared on non-genetically
modified rice, RPS15 was still the most stable gene (Table
S10). RPS15 and 18s were the most stable genes in the N.
lugens nymphs and adults reared on genetically modified rice,
respectively (Table S10). With geNorm, the V value of 0.176
obtained by the RPS15 and TUB pair was near the proposed
0.15 cut-off value. Moreover, the inclusion of additional
reference genes did not lower the V value below the proposed
0.15 cut-off until the 4th gene was added (Figure 2). According
to geNorm, four reference genes (RPS15, TUB, EF and
RPS11) should be required for a suitable normalization in the
different diets treatments.
(7) Starvation: The gene stability of the starvation group
compared to a satiation group (SY63) was analyzed. All four
programs identified ACT and MACT as the least stable
genes, and identified RPS11 as the most stable gene except
BestKeeper (Table 2). According to RefFinder, the stability
ranking from the most stable to the least stable in the
starvation treatments was RPS11, TUB, RPS15, AK, 18S,
EF, ACT, and MACT (Table S2). RPS11 was the most stable
gene both in starved nymphs and starved adults (Table S11).
GeNorm analysis revealed that all the pairwise variation
values were below the proposed 0.15 cut-off (Figure 2).
According to geNorm, three reference genes (RPS11, AK,
and EF) should be required for a suitable normalization in the
starvation treatments.
Discussion
This work analyzed the expression stability of eight candidate
reference genes in N. lugens across different treatments and
developmental stages using qRT-PCR. A major result of this
study is that 18S showed unacceptable variation in response to
certain treatments. Previously, 18S ribosomal RNA has been
considered as an ideal reference gene due to its apparent relatively
invariable rRNA expression levels with respect to other genes [38].
18S rRNA was found to be one of the most suitable housekeepers
in the different developmental stages of Lucilia cuprina [39], in
different organs of Rhodnius prolixus under diverse conditions
[40,41], and in the planthopper Delphacodes kuscheli infected by the
plant fijivirus Mal de Rı´o Cuarto virus (MRCV) [42]. However, in our
study, 18S ranked as one of the least stable genes in the total
samples and almost in all experimental conditions indicating that
18S was not suitable as a reference gene for N. lugens under our
experimental conditions (Tables S2, S3, S4, S5, S6, S7, S8, S9,
S10, S11). This result is in line with the earlier studies indicating
that 18S rRNA is not stable enough in Bactrocera dorsalis under
specified experimental conditions [43]. The transcription by a
separate RNA polymerase is proposed to be a reason why rRNA
could not be considered as a suitable reference gene [44]. On the
other hand, one of the major limitations of using the 18S gene as a
normalizer in qRT-PCR is that an imbalance of rRNA and
mRNA fractions can occur between samples [38]. Our study
suggests that 18S rRNA could not be used for correcting sampleto-sample variation of mRNA quantity in N. lugens.
Like 18S rRNA, actin is another commonly used reference gene
which encodes a major component of the protein scaffold that
supports the cell and determines its shape, and is expressed at
moderately abundant levels in most cell types. Actin has been
highly ranked as a suitable reference gene in studies of gene
expression in Apis mellifera [45], Schistocera gregaria [46], Drosophila
melanogaster [47], Plutella xylostella [48], and Chilo suppressalis [48].
Actin gene has as well been selected as reference gene in gene
expression studies in N. lugens [12,13,14]. However, compared with
the other candidate genes examined here, the expression levels of
ACT and MACT were highly variable across the different
treatments (Tables S2, S3, S4, S5, S6, S7, S8, S9, S10, S11).
ACT and MACT, which participate in many important cellular
processes including muscle contraction, cell motility, cell division
and cytokinesis, ranked one of the least stable genes in the total
Ranking of N. lugens Reference Genes Over all
Treatments
All four programs identified ACT and MACT as the least stable
genes, and RPS11 and RPS15 as the most stable genes except
geNorm (Table 2). According to RefFinder, the stability ranking
from the most stable to the least stable across the different
developmental stages, body parts, populations, and stressors was
RPS11, RPS15, EF, TUB, AK, 18S, ACT, and MACT (Table
S2).
Figure 2. Determination of the optimal number of reference genes for accurate normalization calculated by geNorm. The value of Vn/
Vn+1 indicates the pairwise variation (Y axis) between two sequential normalization factors and determines the optimal number of reference genes
required for accurate normalization. A value below 0.15 indicates that an additional reference gene will not significantly improve normalization.
doi:10.1371/journal.pone.0086503.g002
PLOS ONE | www.plosone.org
6
January 2014 | Volume 9 | Issue 1 | e86503
Study of Reference Genes in Nilaparvata lugens
Table 2. Ranking order of the candidate reference genes of N. lugens in different experimental conditions.
Delta Ct
BestKeeper
NormFinder
geNorm
Experimental
conditions
Rank
Gene
name
Standard
deviation
Gene
name
Standard
deviation
Gene
name
Stability
value
Gene
name
Stability
value
Different
1
RPS11
1.190
RPS11
0.380
RPS11
0.407
RPS15/TUB
0.425
0.480
developmental
2
RPS15
1.204
RPS15
0.520
RPS15
0.705
stages
3
EF
1.274
EF
0.541
EF
0.827
18S
4
TUB
1.355
18S
0.557
AK
0.876
EF
0.566
5
18S
1.401
TUB
0.605
TUB
1.069
RPS11
0.614
6
AK
1.532
AK
0.816
18S
1.144
AK
0.915
7
ACT
2.047
MACT
1.539
ACT
1.864
ACT
1.309
8
MACT
2.148
ACT
1.582
MACT
2.004
MACT
1.519
1
RPS11
1.096
RPS15
0.465
RPS11
0.203
RPS11/18S
0.620
2
RPS15
1.210
TUB
0.501
18S
0.628
3
18S
1.212
RPS11
0.557
RPS15
0.741
RPS15
0.717
4
ACT
1.427
AK
0.928
TUB
1.093
TUB
0.935
5
TUB
1.455
EF
0.953
ACT
1.100
EF
1.149
6
MACT
1.458
18S
0.963
MACT
1.152
ACT
1.193
7
EF
1.610
ACT
1.001
AK
1.411
MACT
1.294
Different body parts
8
AK
1.703
MACT
1.013
EF
1.421
AK
1.396
Different geographic
1
TUB
0.708
TUB
0.590
TUB
0.145
RPS11/EF
0.212
populations
2
RPS11
0.728
EF
0.637
RPS11
0.362
3
RPS15
0.774
RPS15
0.637
RPS15
0.412
RPS15
0.440
4
EF
0.785
RPS11
0.706
EF
0.506
TUB
0.501
5
AK
0.922
ACT
0.756
AK
0.709
AK
0.594
6
ACT
0.936
AK
0.794
ACT
0.750
ACT
0.707
7
MACT
1.122
MACT
0.824
18S
1.016
MACT
0.803
8
18S
1.156
18S
0.980
MACT
1.017
18S
0.891
Temperature-stress
1
RPS15
0.433
RPS15
0.204
RPS15
0.221
RPS15/TUB
0.287
treatments
2
TUB
0.450
TUB
0.235
TUB
0.265
3
EF
0.478
RPS11
0.277
EF
0.305
EF
0.356
4
RPS11
0.500
AK
0.282
MACT
0.342
AK
0.379
5
AK
0.501
MACT
0.325
AK
0.345
RPS11
0.408
6
MACT
0.505
18S
0.345
RPS11
0.351
MACT
0.429
7
18S
0.544
ACT
0.357
18S
0.414
18S
0.454
8
ACT
0.688
EF
0.547
ACT
0.608
ACT
0.512
Pesticide-stress
1
RPS11
0.435
EF
0.245
RPS11
0.253
RPS11/EF
0.277
treatments
2
EF
0.435
RPS11
0.248
EF
0.257
3
TUB
0.439
TUB
0.267
TUB
0.271
TUB
0.318
4
RPS15
0.445
RPS11
0.296
RPS15
0.277
RPS15
0.328
5
18S
0.518
MACT
0.465
18S
0.391
18S
0.379
6
AK
0.544
AK
0.473
AK
0.430
AK
0.430
7
MACT
0.557
ACT
0.539
MACT
0.443
MACT
0.469
8
ACT
0.557
18S
0.583
ACT
0.443
ACT
0.491
Different diet
1
RPS15
0.730
RPS15
0.490
RPS15
0.362
RPS15/TUB
0.421
treatments
2
TUB
0.792
RPS11
0.527
TUB
0.485
3
RPS11
0.850
EF
0.565
RPS11
0.559
EF
0.513
4
EF
0.851
AK
0.584
AK
0.578
RPS11
0.603
5
AK
0.872
TUB
0.603
EF
0.626
18S
0.670
6
18S
0.906
18S
0.639
18S
0.666
AK
0.723
7
ACT
0.989
ACT
0.658
ACT
0.778
ACT
0.814
PLOS ONE | www.plosone.org
7
January 2014 | Volume 9 | Issue 1 | e86503
Study of Reference Genes in Nilaparvata lugens
Table 2. Cont.
Delta Ct
Experimental
conditions
BestKeeper
NormFinder
geNorm
Rank
Gene
name
Standard
deviation
Gene
name
Standard
deviation
Gene
name
Stability
value
Gene
name
Stability
value
8
MACT
1.106
MACT
0.812
MACT
0.957
MACT
0.887
Starvation-stress
1
RPS11
0.680
TUB
0.247
RPS11
0.282
RPS11/AK
0.372
treatments
2
TUB
0.720
RPS15
0.283
TUB
0.304
3
RPS15
0.778
RPS11
0.379
18S
0.480
EF
0.446
4
18S
0.804
18S
0.506
RPS15
0.506
RPS15
0.521
5
AK
0.826
AK
0.585
AK
0.624
TUB
0.573
6
EF
0.896
EF
0.595
EF
0.767
18S
0.645
7
ACT
0.952
ACT
0.621
ACT
0.785
ACT
0.759
8
MACT
1.102
MACT
0.736
MACT
1.009
MACT
0.845
RPS15/EF
0.488
All above conditions
1
RPS11
0.946
RPS11
0.463
RPS11
0.370
2
RPS15
1.011
RPS15
0.504
RPS15
0.655
3
TUB
1.037
TUB
0.524
TUB
0.671
TUB
0.611
4
EF
1.107
EF
0.549
AK
0.806
RPS11
0.666
5
AK
1.174
AK
0.672
EF
0.832
18S
0.788
6
18S
1.203
18S
0.694
18S
0.900
AK
0.914
7
ACT
1.354
ACT
0.842
ACT
1.146
ACT
1.077
8
MACT
1.372
MACT
0.869
MACT
1.175
MACT
1.151
The expression stability was also measured using the Delta Ct method, BestKeeper, NormFinder, and geNorm and ranked from the most stable to the least stable.
doi:10.1371/journal.pone.0086503.t002
role in translation by catalyzing the GTP-dependent binding of
aminoacyl-tRNA to the acceptor site of the ribosome exhibited the
second most stable expression in the BPH under pesticide-stress
(Table S2). EF was found to be the most stable genes for the labial
gland and fat body of Bombus lucorum [53] and for reliable
normalization of qRT-PCR assays studying density-dependent
behavioral change in Chortoicetes terminifera [54]. However, arginin
kinase and elongation factor didn’t show acceptable stable
expression in most treatments (Table S2). Even for housekeeping
genes, whose products are indispensable for every living cell and
are relatively stably expressed, there are tissue-specific differences
based upon extra demands in the required rate at which new
housekeeping proteins need to be produced to maintain cell
function [55].
Multiple reference genes are increasingly used to analyze gene
expression under various experimental conditions, because one
reference gene is usually insufficient to normalize the expression
results of target genes [56]. After measuring the expression of 20
candidate reference genes and 7 target genes in 15 Drosophila head
cDNA samples using qRT-PCR, 20 reference genes exhibited
sample-specific variation in their expression stability and the most
stable normalizing factor variation across samples did not exhibit a
continuous decrease with pairwise inclusion of more reference
genes; these results suggest that either too few or too many
reference genes may detriment the robustness of data normalization [57]. When several reference genes are used simultaneously in
a given experiment, the probability of biased normalization
decreases. GeNorm determines the pairwise variations (V) in
normalization factors (the geometric mean of multiple reference
genes) using n or n +1 reference genes. Our results showed that the
best-suited reference genes were different across different experimental conditions (Figure 2). This implies that the expression
samples and under almost all experimental conditions. And not
surprisingly, its transcript level varies among developmental stages
and different cell types, since it has functions in various cellular
processes. In N. lugens, ACT and MACT should not be used as
reference genes under certain treatments.
Our results also demonstrated that the best-suited reference
genes can be different in response to diverse factors (Table S2).
Reference genes need to be appropriately selected under different
experimental conditions. However, the expression of several
reference genes from N. lugens were comparatively stable across
selected experimental conditions. Ranking of the genes differed
somewhat for geNorm, NormFinder, BestKeeper, and the delta Ct
method probably because the programs have different algorithms
and different sensitivities toward co-regulated reference genes. In
spite of the slight discrepancies, all the programs identified both
RPS11 and RPS15 as the same ideal reference genes for most of
the experimental conditions assessed here (Table S2). Ribosomal
proteins compose the ribosomal subunits involved in the cellular
process of translation in conjunction with rRNA. RPS11 and
RPS15 encode the component of the 40S ribosomal subunit which
is the small subunit of eukaryotic 80S ribosomes [49]. Considering
the function of ribosomal proteins, it is not surprising that their
transcription level varies among different cell types and developmental stages in the brown planthopper. Our result is in line with
the earlier studies on ribosomal protein genes in A. mellifera [45], S.
gregaria [46], Tribolium castaneum [50,51], D. melanogaster [47], B. mori
[48], C. suppressalis [48], and Bemisia tabaci [52].
Arginine kinase, which is the only phosphagen kinase in two
major invertebrate groups, namely arthropods and mollusks, was
one of the most stable genes in Bombus terrestris [53]. In our study,
AK was also the most stable gene in BPH under extremely low
temperature stress (Table S7), and the second most stable gene in
nymphs (Table S3). Elongation factor which plays an important
PLOS ONE | www.plosone.org
8
January 2014 | Volume 9 | Issue 1 | e86503
Study of Reference Genes in Nilaparvata lugens
stability of putative control genes needs to be verified before each
qRT-PCR experiment.
populations. The average expression stability of the reference
gene was measured using the Geomean method of RefFinder
( = reference). A
lower rank indicates more stable expression.
(DOC)
Conclusion
To our knowledge this is the first study to evaluate candidate
reference genes for gene expression analyses in N. lugens. Most
importantly, we identified reference genes which should be used
for accurate elucidation of the expression profiles of functional
genes. We concluded that RPS15, RPS11, and TUB were the
most suitable reference genes for the analysis of developmental
stage, body part, and geographic population, respectively (Table
S2). And that RPS15, RPS11, RPS15, and RPS11 were the most
suitable reference genes under temperature, pesticide, diet, and
starvation stress, respectively (Table S2). This work emphasizes the
importance of establishing a standardized reverse-transcription
quantitative PCR procedure following the MIQE guidelines in N.
lugens, and serves as a resource for screening reference genes for
expression studies in other insects.
Table S7 Expression stability of the candidate reference genes across different temperatures. The average
expression stability of the reference gene was measured using the
Geomean method of RefFinder ( />referencegene.php?type = reference). A lower rank indicates more
stable expression.
(DOC)
Table S8 Expression stability of the candidate reference genes under different pesticide stresses. The average
expression stability of the reference gene was measured using the
Geomean method of RefFinder ( />referencegene.php?type = reference). A lower rank indicates more
stable expression.
(DOC)
Supporting Information
Table S9 Expression stability of the candidate reference genes of N. lugens fed on different diets. The average
expression stability of the reference gene was measured using the
Geomean method of RefFinder ( />referencegene.php?type = reference). A lower rank indicates more
stable expression.
(DOC)
Table S1 Insecticides toxicity to 3rd instar N. lugens
larvae.
(DOC)
Table S2 Expression stability of the candidate reference genes in the total samples. The average expression
stability of the reference genes was measured using the Geomean
method of RefFinder ( />php?type = reference). A lower rank indicates more stable
expression.
(DOC)
Table S10 Expression stability of the candidate reference genes of N. lugens fed on non-genetically modified
rice and genetically modified rice. The average expression
stability of the reference gene was measured using the Geomean
method of RefFinder ( />php?type = reference). A lower rank indicates more stable
expression.
(DOC)
Table S3 Expression stability of the candidate reference genes across different nymphal stages and across
different sexes. The average expression stability of the
reference gene was measured using the Geomean method of
RefFinder
( />php?type = reference). A lower rank indicates more stable
expression.
(DOC)
Table S11 Expression stability of the candidate reference genes of straved N. lugens. The average expression
stability of the reference gene was measured using the Geomean
method of RefFinder ( />php?type = reference). A lower rank indicates more stable
expression.
(DOC)
Table S4 Expression stability of the candidate reference genes different body parts of female and male
adults. The average expression stability of the reference gene was
measured using the Geomean method of RefFinder (http://www.
leonxie.com/referencegene.php?type = reference). A lower rank
indicates more stable expression.
(DOC)
Acknowledgments
Special thanks go to Dr. Mariana del Vas (Instituto de Biotecnologı´a,
CICVyA, Instituto Nacional de Tecnologı´a Agropecuaria (IB-INTA),
Argentina) for comments on an earlier draft, to Prof. Manqun Wang
(Huazhong Agricultural University, China) for supplying the insects, and to
Prof. Yongjun Lin (Huazhong Agricultural University, China) for
supplying the rice seeds of TN1, HH1, MH63, SY63, and BTSY63.
Table S5 Expression stability of the candidate refer-
ence genes across males and females in the heads,
thoraxes, abdomens, and whole bodies. The average
expression stability of the reference gene was measured using the
Geomean method of RefFinder ( />referencegene.php?type = reference). A lower rank indicates more
stable expression.
(DOC)
Author Contributions
Conceived and designed the experiments: MY XZ YL JL. Performed the
experiments: MY. Analyzed the data: MY YL. Contributed reagents/
materials/analysis tools: SZ BJ HW MS. Wrote the paper: MY.
Table S6 Expression stability of the candidate reference genes across two different N. lugens geographic
References
2. Otake A (1978) Population characteristics of the brown planthopper, Nilaparvata
lugens (Hemiptera: Delphacidae), with special reference to differences in Japan
and the tropics. J Appl Ecol 15: 385–394.
1. Dong XL, Zhai YF, Zhang JQ, Sun ZX, Chen J, et al. (2012) Fork head
transcription factor is required for ovarian mature in the brown planthopper,
Nilaparvata lugens (sta˚l). BMC Mol Biol 12: 53.
PLOS ONE | www.plosone.org
9
January 2014 | Volume 9 | Issue 1 | e86503
Study of Reference Genes in Nilaparvata lugens
32. Radonic A, Thulke S, Mackay I, Landt O, Siegert W, et al. (2004) Guideline to
reference gene selection for quantitative real-time PCR. Biochem Bioph Res Co
313: 856–862.
33. Walker NJ (2002) A technique whose time has come. Science 296: 557–559.
34. Pfaffl MW, Tichopad A, Prgomet C, Neuvians TP (2004) Determination of
stable housekeeping genes, differentially regulated target genes and sample
integrity: BestKeeper––Excel-based tool using pairwise correlations. Biotechnology Letters 26: 509–515.
35. Vandesompele J, De Preter K, Pattyn F, Poppe B, Van Roy N, et al. (2002)
Accurate normalization of real-time quantitative RT-PCR data by geometric
averaging of multiple internal control genes. Genome Biol 3: RESEARCH0034.
36. Andersen CL, Ledet-Jensen J, Ørntoft T (2004) Normalization of real-time
quantitative RT-PCR data. a model-based variance estimation approach to
identify genes suited for normalization, applied to bladder and colon cancer data
sets. Cancer Res 64: 5245–5250.
37. Nicholas Silver SB, Jiang J, Thein SL (2006) Selection of housekeeping genes for
gene expression studies in human reticulocytes using realtime PCR. BMC
Molecular Biology 7: 33.
38. Bustin SA (2000) Absolute quantification of mRNA using real-time reversetranscription polymerase chain reaction assays. J Mol Endocrinol 25: 169–193.
39. Bagnall NH, Kotze AC (2010) Evaluation of reference genes for real-time PCR
quantification of gene expression in the Australian sheep blowfly, Lucilia cuprina.
Med Vet Entomol 24: 176–181.
40. Majerowicz D, Alves-Bezerra M, Logullo R, Fonseca-de-Souza AL, MeyerFernandes JR, et al. (2011) Looking for reference genes for real-time quantitative
PCR experiments in Rhodnius prolixus (Hemiptera: Reduviidae). Insect Mol Biol
20(6): 713–722.
41. Paim RM, Pereira MH, Ponzio RD, Rodrigues JO, Guarneri AA, et al. (2012)
Validation of reference genes for expression analysis in the salivary gland and the
intestine of Rhodnius prolixus (Hemiptera, Reduviidae) under different experimental conditions by quantitative real-time PCR. BMC Research Notes 5: 128.
42. Maroniche GA, Sagadı´n M, Mongelli VC, Truol GAM, del Vas M (2011)
Reference gene selection for gene expression studies using RT-qPCR in virusinfected planthoppers. Virology J 8: 308–315.
43. Shen GM, Jiang HB, Wang XN, Wang JJ (2010) Evaluation of endogenous
references for gene expression profiling in different tissues of the oriental fruit fly,
Bactrocera dorsalis (Diptera: Tephritidae). BMC Mol Biol 11: 76.
44. Tricarico C, Pinzani P, Bianchi S, Paglierani M, Distante V, et al. (2002)
Quantitative real-time reverse transcription polymerase chain reaction: normalization to rRNA or single housekeeping genes is inappropriate for human tissue
biopsies. Anal Biochem 309: 293–300.
45. Scharlaken B, Graaf DC, Goossens K, Brunain M, Peelman LJ, et al. (2008)
Reference gene selection for insect expression studies using quantitative real-time
PCR: the head of the honeybee, Apis mellifera, after a bacterial challenge. J Insect
Sci 8: 33.
46. Hiel MBV, Wielendaele PV, Temmerman L, Soest SV, Vuerinckx K, et al.
(2009) Identification and validation of housekeeping genes in brains of the desert
locust Schistocerca gregaria under different developmental conditions. BMC Mol
Biol 10: 56.
47. Ponton F, Chapuis MP, Pernice M, Sword GA, Simpson SJ (2011) Evaluation of
potential reference genes for reverse-transcription-qPCR studies of physiological
responses in Drosophila melanogaster. J Insect Physiol 57: 840–850.
48. Teng XL, Zhang Z, He GL, Yang LW, Li F (2012) Validation of reference genes
for quantitative expression analysis by real-time RT-PCR in four lepidopteran
insects. J Insect Sci 12: 60.
49. Campbell MG, Karbstein K (2011) Protein-Protein Interactions within Late Pre40S Ribosomes. PLoS ONE 6(1): e16194.
50. Lord JC, Hartzer K, Toutges M, Oppert B (2010) Evaluation of quantitative
PCR reference genes for gene expression studies in Tribolium castaneum after
fungal challenge. J Microbiol Meth 80: 219–221.
51. Toutges MJ, Hartzer K, Lord J, Oppert B (2010) Evaluation of reference genes
for quantitative polymerase chain reaction across life cycle stages and tissue types
of Tribolium castaneum. J Agric Food Chem 58: 8948–8951.
52. Li R, Xie W, Wang S, Wu Q, Yang N, et al. (2013) Reference Gene Selection
for qRT-PCR Analysis in the Sweetpotato Whitefly, Bemisia tabaci (Hemiptera:
Aleyrodidae). PLoS ONE 8(1): e53006.
53. Hornˇa´kova´ D, Matousˇkova´ P, Kindl J, Valterova´ I, Pichova´ I (2010) Selection of
reference genes for real-time polymerase chain reaction analysis in tissues from
Bombus terrestris and Bombus lucorum of different ages. Anal Biochem 397: 118–120.
54. Chapuis MP, Donya TE, Dodgson T, Blodin L, Ponton F, et al. (2011)
Assessment and validation of a suite of reverse-transcription-quantitative PCR
reference genes for analyses of density-dependent behavioral plasticity in the
Australian plague locust. BMC Mol Biol 12: 7.
55. Thorrez L, Van Deun K, Tranchevent L-C, Van Lommel L, Engelen K, et al.
(2008) Using Ribosomal Protein Genes as Reference: A Tale of Caution. PLoS
ONE 3(3): e1854.
56. Kylee J, Veazey, Michael C (2011) Golding selection of stable reference genes
for quantitative RT-PCR comparisons of mouse embryonic and extraembryonic stem cells. PLoS ONE 6: 27592.
57. Lin DJ, Salvaterra PM (2011) Robust RT-qPCR data normalization: validation
and selection of internal reference genes during post-experimental data analysis.
PLoS ONE 6(3): e17762.
3. Hibino H (1996) Biology and epidemiology of rice viruses. Annu Rev
Phytopathol 34: 249–274.
4. Wang YH, Wang MH (2007) Factors affecting the outbreak and management
tactics of brown planthopper, Nilaparvata lugens (Sta˚l) in China in recent years (in
Chinese). Pestic Sci Admin 29: 49–54.
5. Wang Y, Chen J, Zhu YC, Ma C, Huang Y, et al. (2008) Susceptibility to
neonicotinoids and risk of resistance development in the brown planthopper,
Nilaparvata lugens (Sta˚l) (Homoptera: Delphacidae). Pest Manag Sci 64: 1278–
1284.
6. Zhang Y, Fan HW, Huang HJ, Xue J, Wu WJ, et al. (2012) Chitin synthase 1
gene and its two alternative splicing variants from two sap-sucking insects,
Nilaparvata lugens and Laodelphgax striatellus (Hemiptera: Delphacidae). Insect
Biochem Mol Bio 42(9): 637–646.
7. Gibson UEM, Heid CA, Williams PM (1996) A novel method for real-time
quantitative RT-PCR. Genome Methods 6: 995–1001.
8. Heid CA, Stevens J, Livak KJ, Williams PM (1996) Real-time quantitative PCR.
Genome Methods 6: 986–994.
9. Baum AJ, Bogaer T, Clinton W, Heck GR, Feldmann P, et al. (2007) Control of
coleopteran insect pests through RNA interference. Nat Biotechnol 25: 1322–
1326.
10. Mao YB, Cai WJ, Wang JW, Hong GJ, Tao XY, et al. (2007) Silencing a cotton
bollworm P450 monooxygenase gene by plant-mediated RNAi impairs larval
tolerance of gossypol. Nat Biotechnol 25: 1307–1313.
11. Price DRG, Gatehouse JA (2008) RNAi-mediated crop protection against
insects. Cell 26 (7): 393–400.
12. Whyard D, Singh AD, Wong S (2009) Ingested double-stranded RNAs can act
as species-specific insecticides. Insect Biochem Mol 39 (11): 824–832.
13. Huvenne H, Smagghe G. (2010) Mechanisms of dsRNA uptake in insects and
potential of RNAi for pest control: A review. J Insect Physiol 56 (3): 227–235.
14. Chen J, Zhang D, Yao Q, Zhang J, Dong X, et al. (2010) Feeding-based RNA
interference of a trehalose phosphate synthase gene in the brown planthopper,
Nilaparvata lugens. Insect Mol Biol 19 (6): 777–786.
15. Liu SH, Ding ZP, Zhang CW, Yang BJ, Liu ZW (2010) Gene knockdown by
intro-thoracic injection of double-stranded RNA in the brown planthopper,
Nilaparvata lugens. Insect Biochem Mol 40 (9): 666–671.
16. Zha WJ, Peng XX, Chen RZ, Du B, Zhu LL, et al. (2011) Knockdown of
midgut genes by dsRNA-transgenic plant-mediated RNA interference in the
Hemipteran Insect Nilaparvata lugens. PLoS ONE 6 (5): e20504.
17. Hiroaki N, Sawako K, Yoko K, Kageaki M, Qaing Z, et al. (2008) Annotated
ESTs from various tissues of the brown planthopper Nilaparvata lugens: A genomic
resource for studying agricultural pests. BMC Genomics 9: 117.
18. Xue J, Bao YY, Li BL, Cheng YB, Peng ZY, et al. (2010) Transcriptome analysis
of the brown planthopper Nilaparvata lugens. PLoS ONE 5(12): e14233.
19. Peng X, Zha W, He R, Lu T, Zhu L, et al. (2011) Pyrosequencing the midgut
transcriptome of the brown planthopper, Nilaparvata lugens. Insect Mol Biol 20(6):
745–762.
20. Jain M, Nijhawan A, Tyagi AK, Khurana JP (2006) Validation of housekeeping
genes as internal control for studying gene expression in rice by quantitative realtime PCR. Biochem Biophys Res Co 345: 646–651.
21. Thellin O, Zorzi W, Lakaye B, Borman BD, Coumans B, et al. (1999)
Housekeeping genes as internal standards: use and limits. J Biotechnol 75: 291–
295.
22. Schmittgen TD, Zakrajsek BA (2000) Effect of experimental treatment on
housekeeping gene expression: validation by real-time, quantitative RT-PCR.
J Biochem Biophys Methods 46: 69–81.
23. Provenzano M, Mocellin S (2007) Complementary techniques: validation of
gene expression data by quantitative real-time PCR. Eurekah Bioscience 2 (6):
510–513.
24. Selvey S, Thompson EW, Matthaei K, Lea RA, Irving MG, et al. (2001)
b-Actin–an unsuitable internal control for RT-PCR. Mol Cell Probe 15: 307–
311.
25. Radonic´ A, Thulke S, Mackay IM, Landt O, Siegert W, et al. (2004) Guideline
to reference gene selection for quantitative real-time PCR. Biochem Biophys Res
Co 313: 856–862.
26. Yanhua W, Jin C, Zhu YC, Chongyong M, Yue H, et al. (2008) Susceptibility to
neonicotinoids and risk of resistance development in the brown planthopper,
Nilaparvata lugens (Sta˚l) (Homoptera: Delphacidae). Pest Manag Sci 64: 1278–
1284.
27. Liu F, Li H, Qiu J, Zhang Y, Huang L, et al. (2010) Monitoring of resistance to
several insecticides in brown planthopper (Nilaparvata lugens) in Huizhou. Chinese
Bulletin of Entomology 47(5): 991–993.
28. Ling Y, Huang F, Long L, Zhong Y, Yin W, et al. (2011) Studies on the pesticide
resistant of Nilaparvata lugens (Sta˚l) in China and Vietnam. Chinese Journal of
Applied Entomology 48(5): 1374–1380.
29. Fu Q, Zhang ZT, Hu C, Lai FX, Sun ZX (2001) A chemically defined diet
enables continuous rearing of the brown planthopper, Nilaparvata lugens (Sta˚l)
(Homoptera: Delphacidae). Appl Entomol Zool 36 (1): 111–116.
30. Markham NR, Zuker M (2005) DINAMelt web server for nucleic acid melting
prediction. Nucleic Acids Res 33: W577–581.
31. Pfaffl MW (2001) A new mathematical model for relative quantification in realtime RT-PCR. Nucleic Acids Res 29: 9.
PLOS ONE | www.plosone.org
10
January 2014 | Volume 9 | Issue 1 | e86503