Atmospheric mercury dispersion modelling from two nearest hypothetical point sources
Bạn đang xem bản rút gọn của tài liệu. Xem và tải ngay bản đầy đủ của tài liệu tại đây (691.91 KB, 14 trang )
INTERNATIONAL JOURNAL OF
ENERGY AND ENVIRONMENT
Volume 3, Issue 2, 2012 pp.181-194
Journal homepage: www.IJEE.IEEFoundation.org
Atmospheric mercury dispersion modelling from two
nearest hypothetical point sources
Khandakar Md Habib Al Razi, Moritomi Hiroshi, Kambara Shinji
Environmental and Renewable Energy System (ERES), Graduate School of Engineering, Gifu
University, Yanagido, Gifu City, 501-1193 Japan.
Abstract
The Japan coastal areas are still environmentally friendly, though there are multiple air emission sources
originating as a consequence of several developmental activities such as automobile industries, operation
of thermal power plants, and mobile-source pollution. Mercury is known to be a potential air pollutant in
the region apart from SOX, NOX, CO and Ozone. Mercury contamination in water bodies and other
ecosystems due to deposition of atmospheric mercury is considered a serious environmental concern.
Identification of sources contributing to the high atmospheric mercury levels will be useful for
formulating pollution control and mitigation strategies in the region. In Japan, mercury and its
compounds were categorized as hazardous air pollutants in 1996 and are on the list of "Substances
Requiring Priority Action" published by the Central Environmental Council of Japan. The Air Quality
Management Division of the Environmental Bureau, Ministry of the Environment, Japan, selected the
current annual mean environmental air quality standard for mercury and its compounds of 0.04 µg/m3.
Long-term exposure to mercury and its compounds can have a carcinogenic effect, inducing eg,
Minamata disease. This study evaluates the impact of mercury emissions on air quality in the coastal area
of Japan. Average yearly emission of mercury from an elevated point source in this area with background
concentration and one-year meteorological data were used to predict the ground level concentration of
mercury. To estimate the concentration of mercury and its compounds in air of the local area, two
different simulation models have been used. The first is the National Institute of Advanced Science and
Technology Atmospheric Dispersion Model for Exposure and Risk Assessment (AIST-ADMER) that
estimates regional atmospheric concentration and distribution. The second is the Hybrid Single Particle
Lagrangian Integrated trajectory Model (HYSPLIT) that estimates the atmospheric concentration
distribution in the vicinity of industrial facilities.
Copyright © 2012 International Energy and Environment Foundation - All rights reserved.
Keywords: Dispersion modelling; Atmospheric mercury concentration; Environment; Mercury
emission; Coastal area of Japan.
1. Introduction
In Japan, mercury and its compounds were categorized as hazardous air pollutants in 1996 and are on the
list of "Substances Requiring Priority Action" published by the Central Environmental Council of Japan.
[1]. The Central Environmental Council published its second report entitled “Future Direction of
Measures against Hazardous Air Pollutants” in October 1996, which also proposed that voluntary action
to reduce emission, as well as investigation of hazards, atmospheric concentration, and sources of
ISSN 2076-2895 (Print), ISSN 2076-2909 (Online) ©2012 International Energy & Environment Foundation. All rights reserved.
182
International Journal of Energy and Environment (IJEE), Volume 3, Issue 2, 2012, pp.181-194
pollutants, should be promoted. Although the industrial emission of mercury and its compounds in Japan
has decreased in recent years, primarily due to voluntary reduction from industrial sources, the risks of
exposure to this pollutant have remained largely unknown.
Mercury is a natural trace component in the environment. Notwithstanding, the bioaccumulation of ethyl
mercury via the food chain, especially through fish, concentrates the mercury and poses serious toxicity
hazards in the biosphere. [2]. For that reason, natural and anthropogenic emissions of mercury in the
environment, [3] its transportation and fate, [4, 5] and its adverse effect on human health and the
ecosystem [6] have all attracted great attention as aspects of a major environmental problem. Stack
emissions from coal-combustion power industry include both vapour and particle-bound phases. Hg (II)
[7] can be inorganic (eg, mercuric chloride, HgCl2) or organic (eg, methyl mercury, MeHg). It can also
be present as particulate mercury (eg, mercuric oxide, HgO, or mercury sulphide, HgS). In the global
atmosphere, Hg (0) is the dominant form. Hg (II) typically constitutes a small percentage of total
mercury and is predominantly in the gas phase. The MeHg concentration in the atmosphere is negligible,
about a factor of 10%–30% lower than the Hg (II) concentration, according to analysis of precipitation
samples. [8]. However, Hg (II) becomes methylated in water bodies, where it cans bioaccumulate in the
food chain. Hg (0) is sparingly soluble and is not removed significantly by wet deposition, and its dry
deposition velocity is also believed to be low. As a result, Hg (0) has a long atmospheric lifetime. On the
other hand, Hg (II) is quite soluble, so is removed rapidly by wet and dry deposition processes.
Particulate mercury is mostly present in the fine fraction of particulate matter, although some particulate
mercury may be present in coarse particulate matter. [9].
The exposure concentration of mercury and its compounds should be estimated both on a regional scale
as well as on a local scale, not only because the concentration of mercury and its compounds in the
general environment is important (ie, the area which includes most of the total population), but also
because those in the vicinity of industrial sources (ie, areas of high concentration) are expected to be
associated with relatively high-risk areas. In this study, two different models were used to assess the
extent of exposure, ie, AIST-ADMER (National Institute of Advanced Science and Technology
Atmospheric Dispersion Model for Exposure and Risk Assessment), which estimates regional
concentration and distribution of hazardous chemical substances, [10, 11] and HYSPLIT (Hybrid Single
Particle Lagrangian Integrated trajectory model) which estimates the concentration and distribution in the
vicinity of facilities. [12, 13].
Gaseous mercury, including both (Hg (0) and Hg (II), were considered as input data for total mercury
emission for this two air pollutant dispersion models, whereas more than 99.5% of the mercury in the
stack emissions was in gaseous form and the proportion in particulate form was extremely low in Japan.
[14]. Since the flue gas treatment systems of the coal combustion facilities are very excellent in Japan,
Hg (II) concentration from the stack is also very low.
This study was designed to estimate the concentration of mercury and its compounds in the coastal area
of Japan, whereas the above two models were used for the assessment of exposure to mercury and its
compounds. The present study demonstrates the use of NCEP–NCAR (National Centres for
Environmental Prediction–National Centre for Atmospheric Research) reanalysis data [15] as input to
the HYSPLIT atmospheric dispersion model to calculate atmospheric mercury concentration episode for
year 2006 from two nearest hypothetical point sources in the coastal area of Japan.
2. Methods
Two air dispersion models are described in this section.
2.1 AIST-ADMER model
AIST-ADMER [10, 11] version 1.5e is a series of models and systems designed for estimating
atmospheric concentration of chemicals and assessing their exposure, developed by the National Institute
of Advanced Industrial Science and Technology. The functions include:
• Generation and confirmation of meteorological data
• Generation and confirmation of chemical substance emission data
• Calculation of atmospheric concentration and deposition of chemicals
• Graphical images of calculation results
• Calculation result histogram
• Population exposure assessment
ISSN 2076-2895 (Print), ISSN 2076-2909 (Online) ©2012 International Energy & Environment Foundation. All rights reserved.
International Journal of Energy and Environment (IJEE), Volume 3, Issue 2, 2012, pp.181-194
183
The purpose of this model is to estimate a long-term, average distribution of chemical concentration in a
relatively wide region, such as the Kanto and Kansai areas of Japan. Exposure assessment data of a 5 km
× 5 km square spatial grid with a resolution of six time zones for an average of one month can be
calculated. Generally, using models requires preparation of various data, such as obtaining
meteorological data, creating target substance emission data, and setting calculation parameters, in order
to estimate the atmospheric concentration of chemicals and assess their exposure.
Meteorological input data edited for AIST-ADMER is required for calculating its simulation. In this
study, basic meteorological data, calculated monthly for a year, ie, from January to December 2006, have
been used for AIST-ADMER calculations. Basic meteorological data were produced from AMeDAS
data, whereas solar radiation and cloud amount were obtained from individual weather stations.
Simulation calculated by the AIST-ADMER needs information on target substances, such as the amount
of emission and location of emission. AIST-ADMER contains a function for creating the emission grid
data required for calculation. The methods used for creating emission grid data can be classified mainly
into two types, ie, point sources, which specify a location using latitude and longitude, and enter the
emission generated from the location, and area sources, which specify emission for each prefecture or
city, and allocate the emission to calculation grids according to indices such as population, area,
industrial statistics, and traffic volume.
The AIST-ADMER calculation range consists of a number of calculation grids. A unit of calculation
range always carries out AIST-ADMER operations, such as creation of AIST-ADMER meteorological
and emission grid data and performing the calculations. During the simulation period, it is recommended
to select a calculation range. In total, 11 calculation ranges are obtained by dividing the overall Japanese
region preregistered in AIST-ADMER. In addition, an arbitrary calculation range can also be created.
The general flow process for analysis using AIST-ADMER is shown in Figure 1.
Preparation for calculation
Creation and selection of calculation range
Creation of meteorological data in calculation range
Creation of emission grid data for selected chemical substance
Performing calculation
Confirmation of data and parameters to be used for calculation
Creation of a calculation case
Performing calculation
Confirmation and analysis of calculation results
Confirmation of calculation results
Analysis using calculation results
Figure 1. General flow of analysis process using National Institute of Advanced Science and Technology
Atmospheric Dispersion Model for Exposure and Risk Assessment (AIST-ADMER).
2.2 HYSPLIT model
A Hybrid Single-Particle Lagrangian Integrated Trajectory (HYSPLIT) model developed by Air
Resources Laboratory, NOAA is used to simulate the dispersion of airborne pollutant releases. HYSPLIT
ISSN 2076-2895 (Print), ISSN 2076-2909 (Online) ©2012 International Energy & Environment Foundation. All rights reserved.
184
International Journal of Energy and Environment (IJEE), Volume 3, Issue 2, 2012, pp.181-194
computes simple trajectories to complex dispersion and deposition simulations using puff or particle
approaches. The dispersion computation consists of three components: particle transport by the mean
wind, a turbulent transport component, and the computation of air concentration. Pollutant particles are
released at the source location and passively follow the wind field. The mean particle trajectory is the
integration of the particle position vector in space and time. The turbulent component of the motion
defines the dispersion of the pollutant cloud and it is computed by adding a random component to the
mean advection velocity in each of the three-dimensional wind component directions. The vertical
turbulence is computed from the wind and temperature profiles and the horizontal turbulence is
computed from short-range similarity theory. The meteorological fields needed in the model are u, v, w
(horizontal, vertical wind components), T (temperature), Z (height) or P (pressure), surface pressure (Po)
and the optional field’s moisture and vertical motion. These gridded three dimensional fields are linearly
interpolated in space and time to the particle’s position. The advection of a particle or puff is computed
from the grid scale three dimensional velocity vectors obtained from the meso-scale model. A random
component to the motion is added at each step according to the atmospheric turbulence at that time. The
horizontal turbulent velocity components at any given time are computed from the turbulent velocity
components at the previous time, an auto-correlation coefficient that depends upon the time step, the
Lagrangian time scale, and a computer generated random component. The lagrangian time scales TLw
(vertical) = 100 s and TLu (horizontal) = 10800 s are assumed to be constant for convenience. These
values result in a random walk vertical dispersion for most of the longer time steps. Turbulent mixing is
calculated using a diffusivity approach based upon vertical stability estimates and the horizontal wind
field deformation. The ratio of vertical to the horizontal turbulence (0.18) is used in the model as default
setting. Pollutant concentrations are estimated as integrated mass of individual particles as they pass over
the concentration grid which is a matrix of cells, each with a volume defined by its dimensions. The
details of the model equations and the dispersion methods are detailed in the technical paper. [13].
A horizontal grid of 2.5° × 2.5° with resolution of 0.01°× 0.01° (approximately 1 km × 1 km) and with
eight vertical levels 25, 50, 100, 200, 500, 1,000, 2,000 and 5,000 m above ground level (AGL) is
considered in the second model, ie, HYSPLIT. The dispersion calculations are made for mercury and its
compounds and no seasonal or diurnal variations in the emissions are considered in the present study.
Also the plume rise due to plume effluent velocity and plume temperature is not considered in the present
study. The point sources considered have exit velocities since power plant plumes are certainly buoyant.
The buoyant plumes rise to higher heights before being subjected to downwind transport and dispersion.
The plume rise for these buoyant plumes is expected to impact the trajectory paths and concentration
results since there is considerable vertical variation in winds and temperature with height. A detailed
calculation of plume rise could be done in future work using the next version of HYSPLIT which
incorporates the complete plume rise equations. The pollutant plume is treated as top-hat puffs in the
horizontal and particle in the vertical. A total of 500 particles or puffs are released during one release
cycle with a maximum of 10,000 particles permitted to be carried at any time during the simulation
(Table 1).
Table 1. The Hybrid Single Particle Lagrangian Integrated trajectory Model configuration
Model version
Grid Centre
Vertical resolution
Horizontal Grid
Horizontal resolution
Turbulence Method
Meteorology
Frequency of emissions cycle
4.9
35.0 N, 136.86 E
8 Levels – 25, 50, 100, 200, 500, 1000, 2000, 5000
2.5 × 2.5 degree
0.01 × 0.01
Standard Velocity Deformation
NCEP–NCAR reanalysis data
500 particles per hour
ISSN 2076-2895 (Print), ISSN 2076-2909 (Online) ©2012 International Energy & Environment Foundation. All rights reserved.
International Journal of Energy and Environment (IJEE), Volume 3, Issue 2, 2012, pp.181-194
185
3. Atmospheric mercury emissions in Japan
Mercury release into the atmosphere as reported by the Pollution Release and Transfer Register [16] is
shown in Table 2 for registered emissions and Table 3 for estimates from coal-fired power plants.
Mercury discharge from coal-fired power plants was estimated from the mercury content of coal and coal
consumption.
Table 2. Registered mercury releases into atmosphere (kg/year) according to the Pollution Release and
Transfer Register [16]
Fiscal year
2001
2002
2003
2004
5-year average
Amount of emission in atmosphere
325
98
14
32
98
Total emission
4,642
4,283
14,400
1,772
5,601
Table 3. Estimates of mercury releases from coal fired power plants (kg/year)
Fiscal year
2001
2002
2003
2004
2005
5-year average
Release into atmosphere
766.7
814.2
890.0
934.6
981.6
877.4
Release to public water body
3.5
3.7
4.0
4.2
4.4
4.0
Total
770.2
817.9
894.0
938.8
986.0
881.4
3.1 Mercury emission sources
According to the Kida research report and data provided by the relevant industries, [17, 18] the total
amount of mercury released into the atmosphere by Japan was estimated to 24–28 Mg/year, taking into
account the release from specified facilities not reported by the Pollution Release and Transfer Register.
In the combustion category, coal-fired power plants, industrial oil combustion boilers, medical waste
incinerators, sewage sludge, and other wastes are considered to be mercury emission sources. In the
manufacturing category, primary ferrous and nonferrous metal productions, as well as cement
production, are thought to be major contributors to atmospheric mercury emission in Japan. Per person
emission of atmospheric mercury in Japan is 0.19–0.225 g/year. [16, 17, 18].
3.2 Mercury emission assumptions
For this research, mercury in Japan was estimated according to the mercury emission of Japan inventory
report by Kida. [17].Coal consumption data for 2005 have been considered as the basis to measure
mercury emission into the atmosphere in Japan, whereas the emission of atmospheric mercury in 2006 is
almost similar to that of 2005. To produce 1000 MW of power, the amount of coal consumption is 305
Mg/hour whereas the mean concentration of mercury in coal was 0.045 ppm, the mean emission rate was
4.4 µg/KW.h, and the mean emission ratio of mercury from stack is 27% of the total mercury of feed
coal in the coal combustion power industry. [19]. In the coal combustion power industries, the capacity
in MW and coal combustion rate has been used as a basis of calculations of atmospheric mercury
emission. In the sector of iron works, total production is 69.5 × 10⁶ Mg and total atmospheric mercury
emission is 5.7 Mg, in the sector of cement plants, total production is 79 × 106 Mg and total atmospheric
mercury emission is 3.5 Mg, in the sector of chemical plants, total production is 9057 Mg and total
atmospheric mercury emission is 0.3 Mg in Japan. [20]. To calculate atmospheric mercury emission from
each point source of iron works, cement plants, and chemical complexes, the yearly production capacity
and yearly mercury emission from each sector has been considered as a basis of calculation by using
simple unitary methods. [16, 17, 20]. Yearly municipality and medical waste have also been considered
as a large source of atmospheric mercury emission in Japan, whereas the emission of mercury into
atmosphere has been distributed in each prefecture on the basis of population density in the present
study. [16, 17, 18].
ISSN 2076-2895 (Print), ISSN 2076-2909 (Online) ©2012 International Energy & Environment Foundation. All rights reserved.
186
International Journal of Energy and Environment (IJEE), Volume 3, Issue 2, 2012, pp.181-194
3.3 Study area
The industrial source complexes considered in the present study were located (latitude 33.40.00 38.35.00 N and longitude 135.22.30 – 139.56.15 E) in the coastal area of Japan, which is the central
region of Honshu, Japan's main island. A total of nine prefectures (Aichi, Mie, Gifu, Fukui, Ishikawa,
Niigata, Nagano, Gunma, and Toyama), as a calculation range for AIST-ADMER, were considered for
simulation of the distribution of regional mercury concentration. There are several heavy and medium
scale units of different types of facilities in operation in this area. On the other hand, a small location in
the coastal area of Japan was selected as the site for calculation of the ambient concentration of mercury
in the vicinity of two major industrial sources (latitude 35.1.39 N, longitude 136.51.55 E and latitude 34.
50.7 N, longitude 136.57.45 E) of mercury emission in Japan using the HYSPLIT model.
4. Results
Mercury emissions from different industrial sources, along with their source characteristics and
meteorological data, are described in this section.
4.1 Meteorological data
Meteorological data from 2006 were used for computer simulation by the Automated Meteorological
Data Acquisition System (AMeDAS), [21] which provides hourly data at distance intervals of
approximately 17 km throughout Japan, because the 2006 weather data are available for use by AISTADMER. One-year meteorological data have been prepared for AIST-ADMER, consisting of four
meteorological elements, including temperature, amount of precipitation, wind direction and speed,
sunshine duration, and snow depth for each hour at different point locations for the whole of Japan. On
the other hand, NCEP–NCAR reanalysis meteorological data in the vicinity of two large coal combustion
facilities in the coastal areas of Japan were used for HYSPLIT model. Monthly average meteorology
data, air temperature, cloudiness, geo-potential heights, humidity, outgoing long-wave radiation, sea
level pressure, winds, many other variables, were prepared for HYSPLIT at every six hours intervals.
[12, 13].
4.2 Emission data
Burning of fossil fuel (primary coal) is the largest single source of atmospheric mercury emission from
human sources, accounting for 45% of total anthropogenic emission, although the emissions from
combustion of medical, municipality, and industrial waste account for significant release of mercury into
the atmosphere in Japan. It is very difficult to identify actual locations and amounts of mercury emission
in Japan from point sources, because of a lack of reliable information about industrial assumptions and
technologies used for calculating mercury emission, as well as confidentiality issues. In this study, the
geographical location of some coal-firing facilities, such as power plants, iron works, cement plants,
chemical complex, and heavy oil or gas combustion industries, are considered as large sources of
atmospheric mercury emission in Japan, based on the report of the Japan Coal Energy Centre, [20] which
provided the input data for AIST-ADMER. Mercury emissions from municipality and medical wastes
have also been taken into consideration as area sources of prefectural mercury emission data for AISTADMER. To calculate the regional distribution of mercury concentration hypothetically, about 28
Mg/year of mercury have been distributed throughout Japan. In addition, the amount of mercury
emission from the point source of the coastal area in Japan was calculated on the basis of production
capacity and, sector-wise, total mercury emission throughout Japan was calculated using the unitary
calculation method. [20].
4.3 Regional concentration level
A regional scale atmospheric concentration of mercury in Japan was estimated for a 5 km × 5 km grid
using AIST-ADMER. The input emission data were compiled from the results of the Pollutant Release
and Transfer Register survey of 2005 (Tables 2 and Table 3) and a mercury emission inventory by Kida
[17] and Japan Coal Energy Centre. [20]. Table 4 shows the input parameters for the AIST-ADMER.
Mercury in the atmosphere primarily exists in the elemental gaseous form, ie, Hg (0), generally at about
95%, [22] and 5% of the total amount is typically present as divalent reactive gaseous mercury (Hg (II)
and particulate mercury. Hg (0) is believed to have an atmospheric lifetime of about one year, while Hg
(II) and particulate mercury has much shorter atmospheric lifetimes. [23] The background concentration
was determined to be 0.077 ng/m3. The value for the background concentration was selected from Figure
ISSN 2076-2895 (Print), ISSN 2076-2909 (Online) ©2012 International Energy & Environment Foundation. All rights reserved.
International Journal of Energy and Environment (IJEE), Volume 3, Issue 2, 2012, pp.181-194
187
2 in the coastal area in Japan and also comparing the monitoring survey results of hazardous air
pollutants monitoring in 2006 by the Japanese Ministry of the Environment. [24, 25, 26, 27, 28].
Figure 2 shows the calculated annual concentration distribution of atmospheric mercury in the central
Honshu area in Japan. The atmospheric mercury concentration was relatively high in major urban areas
such as Nagoya, Yokkaichi, because emissions from industrial facilities tend to be concentrated in these
densely populated areas. The annual mean concentration of atmospheric mercury was calculated to be
less than 0.225 ng/m3 in industrial areas, 0.0263 ng/m3 in nonindustrial areas, and sometimes the
concentration was greater than 1 ng/m3 in the vicinity of major industrial point source areas.
Table 4. Input parameters for the National Institute of Advanced Science and Technology Atmospheric
Dispersion Model for Exposure and Risk Assessment.
Start of calculation
End of calculation
Washout ratio
Half life (days)
Emission pattern
January 2006
December 2006
1
365
Yearly average emission
Figure 2. Annual mean concentration distribution of atmospheric mercury calculated with the National
Institute of Advanced Science and Technology Atmospheric Dispersion Model for Exposure and Risk
Assessment (AIST-ADMER) in 2006. Nine areas (Aichi, Mie, Gifu, Fukui, Ishikawa, Niigata, Nagano,
Gunma, and Toyama) are designated in the map, which provided the background concentration data in
the calculation areas for the Hybrid Single Particle Lagrangian Integrated trajectory Model (HYSPLIT)
ISSN 2076-2895 (Print), ISSN 2076-2909 (Online) ©2012 International Energy & Environment Foundation. All rights reserved.
188
International Journal of Energy and Environment (IJEE), Volume 3, Issue 2, 2012, pp.181-194
4.4 Concentration near industrial sources
The ambient concentration of atmospheric mercury in the vicinity of two major industrial sources was
estimated using the HYSPLIT. Two hypothetical point emission sources of mercury in the coastal area in
Japan (latitude 35.1.39 N, longitude 136.51.55 E and latitude 34.50.7 N, longitude 136.57.45 E) were
selected as the sites for the calculation; this site had a calculation domain of 200 km × 200 km with a 2.5
× 2.5 degree horizontal grid spacing, which included the largest point source located centrally. These
domains corresponded to the 3 km × 3 km calculation grids of AIST-ADMER. The two large coal
combustion facilities in this area are the big sources of mercury emission into the atmosphere in Japan,
pouring 3%–4% of mercury into the air every year. [17]. It is assumed that the emission point was
located at the centre of the industrial yard, and that emissions are released from a height of 100 m,
because no other detailed information regarding the specific location of the sources within factories was
available. The emission from each point source was determined on the basis of total yearly mercury
emission amount, total annual production capacity, and per unit annual production capacity in specific
industrial sectors, as published in the Kida report for 2007 [17] and in the Japan Coal Energy Centre
report for 2005. [20]. For example, mercury emission from a specific cement industry = {(total mercury
emission from cement industries in Japan) ì (production capacity of that industry)} ữ total cement
production capacity in Japan. It was assumed that the emission factors were constant for 365 days a year,
24 hours a day. NCEP–NCAR reanalysis data were used as meteorological input data for the HYSPLIT.
[15]. Source contributions from other sources (eg, mobile sources or point sources located outside of the
calculation domain) were not included in the input data for the HYSPLIT. Source contributions from
other sources were calculated with the AIST-ADMER and were superposed onto the results of the
HYSPLIT study as the background concentration.
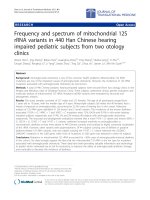
Figure 3 shows the monthly average concentration distribution of mercury from January to December of
2006 vicinity of two large point sources at the coastal area of Japan, which were calculated using the
HYSPLIT simulation model. The mark of solid red circle (latitude 35.1.39 N, longitude 136.51.55 E)
with 0.40 Mg/year mercury emission and the yellow circle (latitude 34.50.7 N, longitude 136.57.45 E)
with 0.50 Mg/year mercury emission represent industrial source location on the figures. In the figure 3, it
was found that the atmospheric mercury dispersion had occurred in the southeast side from the sources
and it spreader to a long distance in the winter season (from November to April). Besides mercury
dispersion occurred in the northwest side from the sources and it did not spread to a long distance.
Higher concentration of mercury was found in summer season about 20 – 25 ng/m3 (from June to
October) very close to the industrial facilities about 1 km vicinity. The average mercury concentration
was found about 0.1 -1 ng/m3 in the 30 km vicinity of the two industrial sources in the summer season. In
the winter season mercury concentration was found much lower than that of summer season. The
calculated concentration of mercury by HYSPLT in the summer season was higher than that of the
winter season due to the effect of boundary layer condition in that coast area. In coastal regions, sea
breezes and land breezes can be important factors in a location's prevailing winds [29-30]. During the
summer season, seasonal winds bring warm moist air from the southeast to northwest direction and
seasonal winds in winter season bring cool air from the northwest to southeast direction in Japan [31-32].
Therefore, the result of HYSPLIT shows the mercury transportation in summer season was in the
northwest direction and southeast direction in the winter season.
According to the results calculated in the HYSPLIT model, although some people living in certain areas
near industrial point sources were exposed to a significantly higher concentration of mercury than was
the general population, the mercury concentration meets the air quality standard of the Japanese Ministry
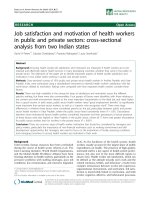
of the Environment. Figure 4 shows the annual wind rose plot, which gives a succinct view of how wind
speed and direction are typically distributed at the location near the point source in 2006. The annual
mean concentration was estimated not to exceed 0.04 µg/m3 near the industrial source, [1] whereas a
similar concentration level was found in different seasons. Figure 5 shows one-year average
concentration distribution of mercury from two large point sources in the coastal area of Japan.
ISSN 2076-2895 (Print), ISSN 2076-2909 (Online) ©2012 International Energy & Environment Foundation. All rights reserved.
International Journal of Energy and Environment (IJEE), Volume 3, Issue 2, 2012, pp.181-194
189
Figure 3. (Continued)
ISSN 2076-2895 (Print), ISSN 2076-2909 (Online) ©2012 International Energy & Environment Foundation. All rights reserved.
190
International Journal of Energy and Environment (IJEE), Volume 3, Issue 2, 2012, pp.181-194
Figure 3. Monthly average concentration distribution of mercury vicinity of two large point sources in
the coastal area of Japan, calculated with Hybrid Single Particle Lagrangian Integrated trajectory Model
(HYSPLIT) in 2006. The red and yellow circles represent industrial source locations
ISSN 2076-2895 (Print), ISSN 2076-2909 (Online) ©2012 International Energy & Environment Foundation. All rights reserved.
International Journal of Energy and Environment (IJEE), Volume 3, Issue 2, 2012, pp.181-194
191
Figure 4. The annual wind rose of the point source area in 2006. Blue and red lines indicate annual mean
wind speed (m/sec) and the frequency (%) of each direction
Figure 5. One-year average concentration distribution of mercury from two large point sources in the
coastal area of Japan, calculated with the Hybrid Single Particle Lagrangian Integrated trajectory Model
(HYSPLIT) in 2006. The red and yellow circles represent industrial source locations
ISSN 2076-2895 (Print), ISSN 2076-2909 (Online) ©2012 International Energy & Environment Foundation. All rights reserved.
192
International Journal of Energy and Environment (IJEE), Volume 3, Issue 2, 2012, pp.181-194
5. Discussion
In Japan, mercury was categorized as a hazardous air pollutant in 1996 due to its high carcinogenic
potential. The national government initiated a number of programs to evaluate emissions and assess
ambient concentrations. Efforts to reduce mercury emissions started at a community level as part of
public (local government)-private partnerships in Japan industry which have been ongoing since 2005
with support of a voluntary emissions reduction program. In 2003, Japan initiated the Pollutant Release
and Transfer Register system, so emissions data for mercury from various sources could be made
available. However, the precise amounts remain somewhat uncertain due to ambiguities in the estimation
methodologies used to evaluate mobile sources. The main source of mercury emission in Japan is from
coal-fired cement plants, accounting for over 30% of total emissions in 2006. On the other hand,
industrial emissions from primary ferrous metal production and coal combustion power plants made a
significant contribution to atmospheric mercury emission in Japan in 2006. The assessment of exposure
to ambient mercury concentration in Japan was performed using two different atmospheric dispersion
models, ie, AIST-ADMER and HYSPLIT. The present results indicate that the annual mean mercury
concentration in residential areas generally amounted to less than 0.22 ng/m3, but there are no sites that
exceed 0.04 µg/m3 near industrial point sources. Although it is unrealistic to expect dispersion models to
predict the real situation of mercury concentration in the local atmosphere, the major purpose of the
present assessment was to conduct a comprehensive analysis of exposure and distribution of mercury
concentration, and thereby develop a detailed picture of current mercury exposure in the different
industrial areas of Japan.
In the preliminary study reported here, two medium scale dispersion models of the different prefectures
in the coastal area of Japan were devised. The results show reasonable agreement with the monitoring
data with respect to predicting localized atmospheric mercury concentration. Readily available tools and
data combined with these two dispersion models provide an accurate representation of the air quality at a
lower cost than the existing monitoring systems in Japan. A dispersion model applied to the prefectures
of Japan removes the assumption of uniform air quality within the vicinity of a monitoring station. The
preliminary results of the present study are encouraging as an air dispersion model providing emission
data for assessing air quality in the different prefectures in Japan.
Acknowledgements
We wish to thank Professor Kobayashi Tomonao of the Faculty of Engineering of Gifu University for
sharing resources and data with us. The deepest gratitude is also expressed to Naher Meherun, the late
wife of first author and a former doctoral student of the Graduate School of Agriculture, Gifu University,
who passed away in February 2010.
References
[1] Kida M., Countermeasures on chemical substances in Japan by Air Pollution Control Law. Air
Quality Management Division, Environmental Bureau, Ministry of the Environment, Japan. 2005,
Available
from:
/>60317530. Accessed August 10, 2011.
[2] Harada M., Minamata disease: Methylmercury poisoning in Japan caused by environmental
pollution. Crit Rev Toxicol. 1995;25:1–24.
[3] Nriagu J.O., Pacyna J.M., Quantitative assessment of worldwide contamination of air, water and
soils by trace metals. Nature. 1988;333:134–9.
[4] Boening D.W., Ecological effects, transport, and fate of mercury: A general review. Chemosphere.
2000;40:1335–51.
[5] Schroeder W.H., Munthe J., Atmospheric mercury: An overview. Atmos Environ. 1998;32:809–
22.
[6] Ditri F.M., Mercury contamination- what we have learned since Minamata. Environ Monit Assess.
1991;19:165–82.
[7] Che-Jen Lin, Simo O. Pehkonen. The chemistry of atmospheric mercury: a review. Atmos
Environ. 1999; 33(13): 2067-2079.
[8] Seigneur C., Abeck H., Chia G., et al. Mercury adsorption to elemental carbon (soot) particles and
atmospheric particulate matter. Atmos Environ. 1998;32:2649–57.
[9] Landis M.S., Keeler G., Atmospheric mercury deposition to Lake Michigan during the Lake
Michigan Mass Balance Study. Environ Sci Technol. 2002;36:4518–24.
ISSN 2076-2895 (Print), ISSN 2076-2909 (Online) ©2012 International Energy & Environment Foundation. All rights reserved.
International Journal of Energy and Environment (IJEE), Volume 3, Issue 2, 2012, pp.181-194
193
[10] Higashino H., Inoue K., Mita K., Shinozaki H., Yoshikado H., Atmospheric dispersion model for
exposure and risk assessment (AIST-ADMER) development and verification of nationwide
version. Environment Management. 2004;40:1242–50. Japanese. The AIST-ADMER can be
downloaded at the web site: />[11] Higashino H., Kitabayashi K., Inoue K., Mita K., Yonezawa Y., Development of an atmospheric
dispersion model for exposure and risk assessment (AIST-ADMER). Japan Society of
Atmospheric Environment. 2003;38 :100–15. Japanese.
[12] Draxler R.R., Hess G.D., Description of the HYSPLIT_4 Modelling System. NOAA Technical
Memorandum. ERL ARL. 1997; 224:1-25.
[13] Draxler R.R., Hess G.D., An overview of the HYSPLIT_4 modelling system for trajectories,
dispersion and deposition. Australian Meteorological Magazine. 1998;47:295-308. The HYSPLIT
model can be downloaded at the web site />[14] Yokoyama T., Asakura K., Matsuda H., Ito S., Noda N.. Mercury emissions from a coal-fired
power plant in Japan. Sci Total Environ. 2007;166:52–62.
[15] Kalnay E., The NCEP/NCAR 40-Year Reanalysis Project. Bulletin of the American
Meteorological Society. 1996; 77:437-71.
[16] Japan Ministry of the Environment (JME), Japan Ministry of Economy Trade and Industry
(METI). The result of the Pollutant Release and Transfer Register (PRTR). 2001-2004. Available
from:
,
jp/chemi/prtr/risk0.html
or
/>chemicalmanagement/law/prtr/index.html. Accessed August 10, 2011.
[17] Kida A., Sakai S., Takaoka M., Hirai Y., Moritomi H., Yasuda K., Study on air emission inventory
of mercury including waste management processes and emission reduction measures, K1852.
2007.
Available
from:
Accessed August 9, 2011.
[18] Moritomi H., Conference on transboundary air pollution in north East Asia North, Tokyo, Japan.
2008.
Available
from:
/>S1_17am_Moritomi(GifuUniv)_1211.pdf. Accessed August 9, 2011.
[19] Ito S., Yokoyama T., Asakura K., Emissions of mercury and other trace elements from coal-fired
power plants in Japan. Sci Total Environ. 2006;368:397–402.
[20] Japan Coal Energy Centre. Clean coal technology in Japan. 2005. Available from:
o/cctinjapan-files/english/cct_english.pdf. Accessed August 9, 2011.
[21] Japan Meteorological Agency. AMeDAS Annual Report. Tokyo, Japan: Japan Meteorological
Business Support Centre; 2006.
[22] Lindqvist O., Rodhe H., Atmospheric mercury – a review. Tellus B Chem Phys Meteorol.
1985;37B:136–59.
[23] Hedgecock I.M., Pirrone N., Chasing quicksilver: Modelling the atmospheric lifetime of Hg (g) in
the marine boundary layer at various latitudes. Environ Sci Technol. 2004;38:69–76.
[24] Japan Ministry of the Environment. The results of hazardous air pollutants monitoring survey
result. 1998–2009. />[25] Japan Ministry of the Environment. The results of hazardous air pollutants monitoring survey
result in 2006 by local government (specimen). />mon_h18/data.html.
[26] Japan Ministry of the Environment. The results of monitoring survey result of mercury and its
compounds
in
2006.
/>14mercury_compound.pdf.
[27] Japan Ministry of the Environment. The concentration distribution of mercury and its compounds
in
2006,
monitoring
survey
result
by
the
local
government.
/>[28] Japan Ministry of the Environment. Hazardous Air Pollutants Measuring Method Manual. Tokyo,
Japan: Japan Ministry of the Environment; 1997. Japanese.
[29] Steve A., Sea and Land Breezes University of Wisconsin, WI. 1995. October 24,
2006. />[30] JetStream: An Online School For Weather, 2008. The Sea Breeze. National Weather Service.
Accessed October 24, 2006. />[31] Kanda J., Maximum wind speed estimation for arbitrary month periods in Japan. Journal of Wind
Engineering and Industrial Aerodynamics. 1988;30:205-14.
ISSN 2076-2895 (Print), ISSN 2076-2909 (Online) ©2012 International Energy & Environment Foundation. All rights reserved.
194
International Journal of Energy and Environment (IJEE), Volume 3, Issue 2, 2012, pp.181-194
[32] Tetsuya S., Statistical and geostatistical analysis of wind: A case study of direction statistics.
Computers & Geosciences. 2006;32:1025-39.
Khandakar Md. Habib Al Razi is Doctoral Course student at Environmental and Renewable Energy
System (ERES), Graduate School of Engineering of Gifu University, Japan. He has long experience to
work on atmospheric dispersion modelling from coal combustion facilities in Japan. He has obtained his
B.Sc. Engineering in Chemical Engineering from Bangladesh University of Engineering and Technology
(BUET), Dhaka, Bangladesh in 2004. He obtained his M.Sc. degree in Environmental and Renewable
Energy System (ERES), Graduate School of Engineering of Gifu University, Japan in 2010. Currently he is
working on regional climate modelling and regional air quality modelling by using METI-LIS, AISTADMER, HYSPLIT, WRF, RSM, and WRF-CHEM model as his Doctoral dissertation work.
E-mail address:
Moritomi Hiroshi is Professor at Environmental and Renewable Energy System (ERES), Graduate School
of Engineering of Gifu University, Japan. He was born in Aichi Prefecture, Japan and received his
undergraduate B.Sc. in 1977 and M.Sc. in 1979 at the Nagoya Institute of Technology. He obtained Ph.D.
degree from Hokkaido University, Japan. 1980 he joined Hokkaido University as Research Assistant. 1987
he joined in Ohio State University as a Researcher. 1988 he joined in National Institute of Advance
Industrial Science and Technology (AIST). 1995 he was appointed in ERES of Gifu University as
Associate Professor and 1999 he obtained promotion as Professor.
Prof. Moritomi is a member of Japan Society of Chemical Engineers, Japan Institute of Energy,
Combustion Society of Japan, Japanese Society for Multiphase Flow, Heat Transfer Society of Japan,
Japan Society of Mechanical Engineers, Society of Waste Recycling, Japan Association of Aerosol and
many other local and international societies. He has published many articles in peered reviewed national
and international journals. He has organized several symposia, workshops, etc. as also chaired a number of technical sessions of
national/international events on his relevant field. He is carrying out many projects related to his research work. He was awarded
Progress Energy Society of Japan Award in 1996, Best Paper Award 6th International Conference on High Temperature Gas
Purification in 2005, Energy Society of Japan Award in 2006, Japan Institute of Energy Award in 2010, Energy Society of Japan
Award in 2011.
E-mail address:, Tel: +81-293-2591
Kambara Shinji is Associate Professor at Environmental and Renewable Energy System (ERES), Graduate School of Engineering
of Gifu University, Japan. He obtained Ph.D. degree from Gunma University, Japan.
Dr. Kambara is member of Japan Society of Chemical Engineers, Japan Institute of Energy, Combustion Society of Japan, Japan
Society for Analytical Chemistry, Japan Electrical Engineers Association, Japan Thermal and Nuclear Power Engineering Society,
American Chemical Engineers Society. He was awarded Combustion Society of Japan Award in 1993, Nikkan Kogyo Shimbun
Agency Environment Prize in 1996, Progress Energy Society of Japan Prize in 1998, Combustion Society of Japan Technology
Award in 2002, The Best Paper Award of Advanced Gas Cleaning (Hosokawa Award) in 2005, Onogi Science Foundation award
in 2008, Energy Society of Japan Award (co-author) in 2011. He has also published many articles, proceedings in national and
international Journals.
Email:
ISSN 2076-2895 (Print), ISSN 2076-2909 (Online) ©2012 International Energy & Environment Foundation. All rights reserved.