- Trang chủ >>
- Khoa Học Tự Nhiên >>
- Vật lý
Numerical investigation into premixed hydrogen combustion within two-stage porous media burner of 1 kW solid oxide fuel cell system
Bạn đang xem bản rút gọn của tài liệu. Xem và tải ngay bản đầy đủ của tài liệu tại đây (1.27 MB, 18 trang )
INTERNATIONAL JOURNAL OF
ENERGY AND ENVIRONMENT
Volume 1, Issue 4, 2010 pp.589-606
Journal homepage: www.IJEE.IEEFoundation.org
Numerical investigation into premixed hydrogen
combustion within two-stage porous media burner of 1 kW
solid oxide fuel cell system
Tzu-Hsiang Yen1, Wen-Tang Hong2, Yu-Ching Tsai2, Hung-Yu Wang2, Cheng-Nan
Huang2, Chien-Hsiung Lee2, Bao-Dong Chen1
1
2
Refining & Manufacturing Research Institute, CPC Corporation, Chia-Yi City 60036, Taiwan, ROC.
Institute of Nuclear Energy Research Atomic Energy Council, Taoyuan County 32546, Taiwan, ROC.
Abstract
Numerical simulations are performed to analyze the combustion of the anode off-gas / cathode off-gas
mixture within the two-stage porous media burner of a 1 kW solid oxide fuel cell (SOFC) system. In
performing the simulations, the anode gas is assumed to be hydrogen and the combustion of the gas
mixture is modeled using a turbulent flow model. The validity of the numerical model is confirmed by
comparing the simulation results for the flame barrier temperature and the porous media temperature
with the corresponding experimental results. Simulations are then performed to investigate the effects of
the hydrogen content and the burner geometry on the temperature distribution within the burner and the
corresponding operational range. It is shown that the maximum flame temperature increases with an
increasing hydrogen content. In addition, it is found that the burner has an operational range of 1.2~6.5
kW when assigned its default geometry settings (i.e. a length and diameter of 0.17 m and 0.06 m,
respectively), but increases to 2~9 kW and 2.6~11.5 kW when the length and diameter are increased by a
factor of 1.5, respectively. Finally, the operational range increases to 3.5~16.5 kW when both the
diameter and the length of the burner are increased by a factor of 1.5.
Copyright © 2010 International Energy and Environment Foundation - All rights reserved.
Keywords: Solid oxide fuel cell, Porous media combustion, Burner design.
1. Introduction
As the world’s supply of natural resources dwindles, a requirement has emerged for highly-efficient,
environmental-friendly power generation systems. Solid oxide fuel cells (SOFCs), which produce
electrical energy by oxidizing a suitable fuel such as hydrogen or methane, represent a feasible solution
for meeting this requirement for a wide variety of applications, ranging from simple auxiliary power
units to large-scale power generation systems. SOFCs have a high electrical efficiency (40~60%), low
emissions, the ability to operate on a wide variety of different fuels, and the potential for implementation
in integrated gasification combined cycles (IGCCs) in order to realize SOFC coal-based central power
plants [1, 2, 3].
Many experimental SOFC power generation systems have been developed in order to explore the effects
of different fuels, fuel rates and operating temperatures on the operational range of real-world SOFCs.
For example, the Institute of Nuclear Energy Research (INER), Taiwan, recently developed a 1 kW
SOFC system comprising a natural gas reformer, a fuel stack, an after-burner, a fuel heat exchanger and
ISSN 2076-2895 (Print), ISSN 2076-2909 (Online) ©2010 International Energy & Environment Foundation. All rights reserved.
590
International Journal of Energy and Environment (IJEE), Volume 1, Issue 4, 2010, pp.589-606
an air heat exchanger [4]. Within this system, the two-stage porous media after-burner plays a key role in
ensuring the complete conversion of the SOFC off gases during nominal operation, supplying heat during
the system start up phase, and pre-heating the cathode intake air during long term operation. Compared
to conventional combustion systems with free flame burners, porous media burners have a number of
significant advantages, including lower emissions, a wider variable dynamic power range, greater
combustion stability, and a freer choice of geometry. As a result, porous burners have been used for
many applications in recent years, including household and air heating systems, gas turbine combustion
chambers, independent vehicle heating systems, steam generators, and so forth.
The problem of combustion within a porous medium has attracted significant interest in the literature.
For example, Trimis and Durst [5] conducted two-section porous media zone experiments in which the
two sections contained materials with different properties and porosities, and showed that flame stability
and low pollutant emissions could be obtained over a wide range of equivalence ratios. In addition, it was
shown that a minimum Peclet number of Pe = 65 was required to prevent flame quenching within the
porous media. Hayashi et al. [6] utilized a one-step reaction model to perform three-dimensional
analyses of the flows within a two-layer porous burner for household applications. The results provided a
useful understanding of the flame stabilization mechanism within the porous matrix. N-heptane was
chosen to model the actual fuel and the combustion process was described by the one-step reaction.
Tseng [7] performed a numerical investigation into the effects of hydrogen addition on the combustion of
methane in a porous media burner, and showed that adding hydrogen in the fuel the lean limit can be
further reduced to φ =0.26. The flame speeds of porous media burner are several times as that of free
flames. In addition, it was shown that the porous media burner resulted in a thinner flame thickness than
a conventional free flame burner.
As computer technology has developed in recent decades, the use of numerical simulation techniques to
obtain detailed insights into the combustion mechanisms within porous media has become increasingly
common. Although radiation heat transfer plays an important role in solid phase media, its effects are
generally approximated when analyzing the combustion phenomenon using numerical techniques.
Consequently, a variety of radiation heat transfer models have been proposed, including the Rosseland
model for optically thick media [8], the two-flux approximation model [9], the discrete ordinate (DO)
method [10-11], and the direct solution of the one-dimensional radiative transfer equation (RTE) [12-13].
Of these various models, the DO model spans the entire range of optical thicknesses, and permits the
solution of problems ranging from surface-to-surface radiation to participating radiation in the
combustion process. In addition, the model also allows the solution of radiation at semi-transparent walls
and has modest computational and memory requirements. Consequently, the DO model is applied in the
numerical simulation here.
Compared to experimental methods, numerical simulations provide a more convenient and versatile
means of obtaining detailed insights into the characteristic thermofluidic properties of the stack and
afterburner components of an SOFC system. Numerical simulations enable the effects of the various
operating parameters (e.g. the fuel mix ratio, the stack intake temperature, the afterburner temperature,
and so on) to be easily explored such that the optimum operating conditions can be identified. In the
present study, numerical simulations are performed to analyze the premixed combustion problem within
the two-stage porous media burner in the 1 kW SOFC system developed by INER [4]. In contrast to most
previous studies in which methane was used as the fuel, the present simulations consider the fuel (and the
anode-off gas) to be hydrogen. To the best of the current authors’ knowledge, no generally accepted
model exists for turbulent premixed porous media combustion. The validity of the numerical model is
confirmed by comparing the results obtained for the flame barrier temperature and the porous media
temperature with the corresponding experimental results obtained using the INER SOFC system.
Simulations are then performed to investigate the effects of the hydrogen content and the geometry of the
porous media burner on the temperature distribution within the burner and the corresponding operational
range.
The remainder of this paper is organized as follows. Section 2 describes the mathematical model,
numerical method and boundary conditions imposed in the simulations. Section 3 discusses the
validation of the simulation model and presents the simulation results. Finally, Section 4 provides some
brief concluding remarks.
ISSN 2076-2895 (Print), ISSN 2076-2909 (Online) ©2010 International Energy & Environment Foundation. All rights reserved.
International Journal of Energy and Environment (IJEE), Volume 1, Issue 4, 2010, pp.589-606
591
2. Mathematical model and numerical method
The modeling of hydrogen combustion within a porous media burner is complicated since it requires the
solution of a coupled problem involving fluid flow, heat and mass transfer and chemical reactions within
both the porous media and the free space regions of the burner. Furthermore, the fluid and solid
properties depend on the temperature and concentration of the gas mixture and therefore result in a nonlinear system of partial differential equations. Consequently, certain simplifying assumptions are made in
performing the present simulations, namely (1) the gas mixture exhibits steady two-dimensional
turbulent flow, (2) the incompressible flow and gases conform to the ideal gas law, (3) gas radiation from
the fuel/air combustion mixture is negligible, (4) the porous ceramic materials within the burner have
homogeneous properties and emit, adsorb and scatter radiation in such a way as to maintain local
thermal equilibrium conditions, (5) the porous ceramic materials are inert and have no catalytic effect on
the gas mixture, (6) solid and gas become local thermal equilibrium due to the convective heat transfer
coefficient is large enough between gas and solid phase, (7) the Dufour and gravity effects are negligible,
and (8) the heat dissociation effect is sufficiently small to be ignored.
2.1 Governing equations
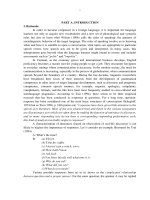
Figure 1 presents a schematic illustration of the burner used in the present simulations and indicates the
four temperature measuring positions within the experimental burner. As shown, the burner comprises a
mixing chamber (Region A), two porous media sections, namely an upstream fine-pore section (i.e.
Region B, the flame barrier zone) and a downstream large-pore section (i.e. Region C, the porous media
zone), and a free space region (Region D). In performing the simulations, it is assumed that the burner is
fitted with cordierite based honeycomb ceramic and SiC based foam ceramic in Regions B and C,
respectively, leading to an excellent modulation behavior, a high power density and low emissions.
Furthermore, the cordierite ceramic has an open section of 33% and a pore diameter of 0.8 mm to
prohibit the flame propagation in the area, while the metal foam has an open section of 87% and a pore
size of 10 pores per inch (ppi).
Figure 1. General configuration of two-stage porous media burner
In the simulations, the thermal and turbulent flow fields within the burner are modeled using the
turbulent Navier-Stokes and energy equation and are solved numerically using a finite-difference scheme
subject to the constraint of satisfying the continuity and species conservation equations. The effects of
turbulence are accounted for using an eddy viscosity model, and the flow is assumed to be steady,
incompressible, and two-dimensional. In addition, the thermo-physical properties of the solid
components within the burner are assumed to be constant. Thus, the governing equation for the gas
mixture can be written as follows:
ISSN 2076-2895 (Print), ISSN 2076-2909 (Online) ©2010 International Energy & Environment Foundation. All rights reserved.
592
International Journal of Energy and Environment (IJEE), Volume 1, Issue 4, 2010, pp.589-606
∂
(ρuφ ) + ∂ (ρvφ ) = ∂ ⎡ Γ φ ∂φ ⎤ + ∂ ⎡ Γ φ ∂φ ⎤ + Sφ
∂x
∂y
∂x ⎢ ∂x ⎥ ∂y ⎢ ∂y ⎥
⎣
⎦
⎦
⎣
(1)
where φ denotes the dependent variables u , v, T , k , ε , Y ; u, v are the local time-averaged velocities in
the x - and y -directions respectively; k , ε are the turbulent kinetic energy and turbulent energy
dissipation rate, respectively; Y is the mass fraction of the species; and Γ φ and S φ are the turbulent
diffusion coefficient and source term, respectively, for the general variables φ . The equations solved in
the simulations for the main flow region and porous region of the burner are summarized in Tables 1 and
2, respectively. Note that the empirical constants within the equations used in these regions are assigned
values of C1 = 1.44, C 2 = 1.92, C µ = 0.09, σ k = 1.0, σ ε = 1.3.
Table 1. Summary of equations solved in main flow region of burner
Equations
φ
Γφ
Sφ
Continuity
1
0
0
x − momentum
u
µe
y − momentum
v
µe
Energy
T
µe
σT
∂p ∂ ⎡
+
µe
∂x ∂x ⎢
⎣
∂p ∂ ⎡
−
µe
+
∂y ∂x ⎢
⎣
Turbulent energy
k
µl +
Turbulent dissipation
ε
Species
Yi
−
∂u ⎤ ∂ ⎡
+
µe
∂x ⎥ ∂y ⎢
⎦
⎣
∂u ⎤ ∂ ⎡
µe
+
∂y ⎥ ∂y ⎢
⎦
⎣
∂v ⎤
∂x ⎥
⎦
∂v ⎤
∂y ⎥
⎦
0
µt
σk
µ
µl + t
σε
µ
ρDi + t
Sct
− ρε + G
ε
k
(c1G − c2 ρε )
NR
M i = ∑ Ri ,r
r =1
⎧ ⎡⎛ ∂u ⎞ 2 ⎛ ∂v ⎞ 2 ⎤ ⎡ ∂u ∂v ⎤ 2 ⎫
⎪
⎪
G = µt ⎨2 ⎢⎜ ⎟ + ⎜ ⎟ ⎥ + ⎢ + ⎥ ⎬ .
⎜ ∂y ⎟
⎪ ⎢⎝ ∂x ⎠ ⎝ ⎠ ⎥ ⎣ ∂y ∂x ⎦ ⎪
⎦
⎭
⎩ ⎣
µ e = µl + µ t .
ISSN 2076-2895 (Print), ISSN 2076-2909 (Online) ©2010 International Energy & Environment Foundation. All rights reserved.
International Journal of Energy and Environment (IJEE), Volume 1, Issue 4, 2010, pp.589-606
593
Table 2. Summary of equations solved in porous regions of burner
Equations
φ
Γφ
Sφ
Continuity
1
0
0
x − momentum
u
µl
−υ2
⎡ ∂ 2 u ∂ 2u ⎤
∂p
+ (υ − 1)µl ⎢ 2 + 2 ⎥
∂x
∂y ⎦
⎣ ∂x
− ρυ 2uv
∂ ⎡ 1 ⎤ µl 2
2
⎢υ ⎥ − K υ u − ρC U υ u
∂y ⎣ ⎦
p
y − momentum
v
µl
Energy
T
αp
ρ
0
Species
Yi
ρDi
M i = ∑ Ri ,r
⎡ ∂ 2v ∂ 2v ⎤
∂p
−υ
+ (υ − 1)µl ⎢ 2 + 2 ⎥
∂y
∂y ⎦
⎣ ∂x
∂ ⎡1⎤ µ
− ρυ 2vv ⎢ ⎥ − l υ 2v − ρC U υ 2v
∂y ⎣υ ⎦ K p
2
NR
r =1
Kp =
2
d pυ 3
150(1 − υ )
1.75
C=
.
150υ 1.5
2
.
U = u 2 + v2 .
In general, the chemical reaction of the ith species is given by
N
R f ,r
N
∑ χ i′, r M i ⎯⎯ ⎯→ ∑ χ i′′, r M i
(2)
⎛ Ea ⎞
⎟
R H 2 = AT β [ H 2 ]b [O 2 ]c exp ⎜ −
⎜ R T ⎟
u ⎠
⎝
(3)
i =1
H2 +
i =1
1
(O 2 + 3.76N 2 ) → H 2 O + 1.88N 2
2
(4)
where R f , r is the forward rate constant for reaction r , R H 2 is computed using the Arrhenius
expression and A is the pre-exponential factor. The present simulations consider the one-step global
forward chemical reaction involved in the hydrogen combustion process Furthermore, [H 2 ] and [O2 ]
denote the concentrations of hydrogen and oxygen, respectively, while parameters b and c are the
corresponding concentration exponents. In accordance with [14], the parameters in Eqs. (3) and (4) are
specified as b = 1.1 , c = 1.1 , β = 0 , A = 9.87 × 10 8 Kmol −1.2 m 3.6 s −1 , and Ea = 3.1 × 10 7 J / kgmol .
Simulating the multi-step reaction mechanism in the combustion process involves a significant
computational effort. As a result, most previous numerical investigations simplified the reaction process
to a single-step chemical reaction. However, the use of a single-step reaction model overstates the flame
ISSN 2076-2895 (Print), ISSN 2076-2909 (Online) ©2010 International Energy & Environment Foundation. All rights reserved.
594
International Journal of Energy and Environment (IJEE), Volume 1, Issue 4, 2010, pp.589-606
temperature and prevents an understanding of the emissions produced by the reaction process.
Consequently, Hsu et al. [15] argued that it is essential to use multi-step kinetics if accurate predictions
of the temperature distribution, energy release rates, and total energy release are required. However, it
was also reported in [15] that a single-step kinetics model is adequate for predicting all the flame
characteristics other than the emissions for the very lean conditions under which equilibrium favors the
more complete combustion process dictated by global chemistry. Table 3 summarizes the compositions
of the anode-off and cathode-off gas mixtures considered in the present simulations. The H2-20 to H2-8
cases correspond to fuel utilizations in the range Uf = 0 ~ 0.6, respectively, and equivalence ratios
ranging from 0.27 ~ 0.30. In other words, the present simulations all belong to the lean fuel regime, and
can therefore be performed using a single-step reaction model with no significant loss in generality.
Table 3. Compositions of anode-off and cathode-off gas mixtures considered in different simulation runs
and corresponding equivalence ratios
Case
H2 (slpm)
Air (slpm)
H2-20
H2-19
H2-18
H2-17
H2-16
H2-15
H2-14
H2-13
H2-12
H2-11
H2-10
H2-9
H2-8
20
19
18
17
16
15
14
13
12
11
10
9
8
100
97.6
95.2
92.9
90.5
88.1
85.7
83.3
81.0
78.6
76.2
73.8
71.4
Cooling
(slpm)
76
76
74
69
63
56
49
43
37
30
23
16
7
air H2O
(cc/min)
0
0.8
1.6
2.4
3.2
4.0
4.8
5.6
6.4
7.2
8.0
8.8
9.6
N2 (slpm)
0
1.9
3.8
5.6
7.5
9.4
11.3
13.2
15.0
16.9
18.8
20.7
22.6
Equivalence
ratio ( φ )
0.30
0.29
0.28
0.28
0.28
0.28
0.28
0.28
0.27
0.27
0.27
0.27
0.27
Owing to the high emissivity of the solids in the porous media burner compared to the fluid, the present
simulations neglect the effects of gas radiation. However, the divergence of the radiative heat flux from
the solids is considered, and is obtained by solving the radiative transfer equation (RTE) using the
r
discrete ordinate (DO) model with the RTE in the direction s as a field equation. In general, the RTE for
r r
the spectral intensity I λ (r , s ) can be written as
σ 4π
r r r
r r
r r
r r
∇ ⋅ (I λ (r , s )s ) + (aλ + σ s )I λ (r , s ) = aλ n 2 I bλ + s ∫ I λ (r , s ′)Φ (s ⋅ s ′)dΩ ′
4π 0
(5)
where λ is the wavelength, a λ is the spectral absorption coefficient, σ s is the scattering coefficient,
I bλ is the black body intensity given by the Planck function, Φ is the phase function, and Ω is the
solid angle. In the present simulations, the scattering coefficient, scattering phase function, and refractive
index n are all assumed to be independent of the wavelength. Moreover, the porous media are assumed
to be gray, homogeneous and isotropically scattering materials. Finally, the extinction and scattering
coefficients of the SiC foam are taken from [16].
2.2 Verification of negligible heat dissociation effect
At higher combustion temperatures, the products in the combustion reaction dissociate and form many
additional compounds. For example, the compounds produced in hydrogen / oxygen combustion include
not only water and nitrogen, but also OH-, NO, and CO. Table 4 summarizes the STANJAN calculation
results for the molar fractions of the compounds formed in the current combustion process for a
hydrogen content of H2-20 LPM. The results indicate that in the “Equilibrium State” condition, the molar
fractions have a very low value for all compounds other than H2O and N2. Thus, the validity of
assumption #8 in Section 2 (i.e. the heat dissociation effect is negligible) is confirmed.
ISSN 2076-2895 (Print), ISSN 2076-2909 (Online) ©2010 International Energy & Environment Foundation. All rights reserved.
International Journal of Energy and Environment (IJEE), Volume 1, Issue 4, 2010, pp.589-606
595
Table 4. Molar fractions of compounds before and after combustion reaction as determined by
STANJAN calculations
Mole Fractions
H2
H
O
O2
OH
H2O
HO2
H2O2
NO
NO2
N2O
HNO
N2
Initial State
9.8349E-02
0.0000E+00
0.0000E+00
1.6183E-01
0.0000E+00
0.0000E+00
0.0000E+00
0.0000E+00
0.0000E+00
0.0000E+00
0.0000E+00
0.0000E+00
7.3982E-01
Equilibrium State
2.9956E-08
2.1673E-10
7.0006E-08
1.1832E-01
1.0119E-05
1.0343E-01
2.6741E-08
2.0832E-09
3.1217E-04
2.4694E-06
2.0611E-08
9.9136E-12
7.7792E-01
2.3 Boundary conditions
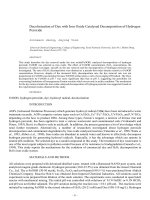
Figure 2 presents a schematic diagram of the computational domain considered in the present
simulations. As shown, a symmetry plane exists along the x-axis of the burner, and thus only a halfmodel is considered. In performing the simulations, the normal velocity components and variable
gradients along the symmetry plane were set to zero, while the remaining boundary conditions were set
as described in the following.
0.03
0.02
0.01
0
-0.08 -0.07 -0.06 -0.05 -0.04 -0.03 -0.02 -0.01
0
0.01 0.02 0.03 0.04 0.05 0.06 0.07 0.08 0.09
Position (m)
Figure 2. Schematic showing grid distribution within meshed burner
At the inlet of the computational domain, the fuel-air mixture (i.e. the anode-off and cathode-off gas
mixture from the SOFC stack) was assumed to have a known temperature Tmix specified in accordance
with the experimental data presented in [4]. The other boundary conditions at the inlet were specified as
follows:
u = uin , v = 0, T = Tmix , Yi = Yi,in , q = πI b (Tmix )
(6)
Meanwhile, the boundary conditions at the outlet were specified as
∂u ∂T ∂Yi
=
=
= 0, q = πI b (Te )
∂x ∂x
∂x
(7)
The boundary conditions for the temperature at the outlet were obtained by applying an energy balance
between the inlet and outlet boundaries. In addition, the inlet and outlet radiation boundaries in Eqs.(6)
and (7) were used to simulate the exchange of radiation with a black body cavity at the burner inlet and
outlet temperatures, respectively. Finally, the burner walls were assigned no slip and convection
boundary conditions and were assumed to be wrapped with an insulation layer with a thickness of 6 cm.
As shown in Fig. 2, the porous media burner was meshed using a non-uniform grid arrangement in order
ISSN 2076-2895 (Print), ISSN 2076-2909 (Online) ©2010 International Energy & Environment Foundation. All rights reserved.
596
International Journal of Energy and Environment (IJEE), Volume 1, Issue 4, 2010, pp.589-606
to reduce the overall computational effort whilst preserving the ability to capture the detailed variations
in the temperature distribution within the porous media regions of the burner. The simulations were
performed using the SIMPLEC (semi-implicit method for pressure-linked equation consistent) algorithm
proposed by Doormaal and Raithby [17]. The algorithm was implemented using pressure and velocity
correction schemes in order to ensure a convergent solution in which both the pressure and the velocity
satisfied the momentum and continuity equations. Furthermore, an under-relaxation scheme was
employed to prevent divergence in the iterative solutions. The resulting sets of discretized equations for
each variable were solved using a line-by-line procedure based on the tri-diagonal matrix algorithm
(TDMA) and Gauss–Seidel iteration technique presented in Patankar [18]. The solution procedure
continued iteratively until the normalized residual of the algebraic equation fell to a value of less than 10-4.
3. Results and discussions
Before commencing the simulations, a grid independence test was performed using three different grid
sizes, namely 100 x 10, 100 x 30 and 130 x 50. Figure 3 illustrates the results obtained using the three
grid sizes for the temperature profile along the x-axis of the burner at a distance of 1/3H from the burner
wall. (Note that the hydrogen content is specified as H2-20 LPM (see Table 3).) The results show that the
numerical solutions are independent of the mesh size for a grid distribution of 130 x 50. Thus, in all the
remaining simulations, the grid distribution was specified as 130 x 50.
1400
100*10
100*30
130*50
Temperature (K)
1200
1000
800
600
400
-0.08
-0.04
0
0.04
0.08
0.12
Position (m)
Figure 3. Effect of grid refinement on temperature profile in x-axis direction at distance of 1/3H from
burner wall
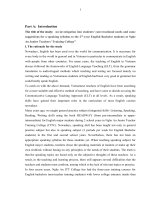
3.1 Verification of numerical model
In order to verify the numerical model, the simulation results obtained for the flame barrier and porous
media temperature for a gas composition from H2-20 LPM to H2-8 LPM were compared with the
experimental results reported by Yen et al. in [4]. The corresponding results are presented in Fig. 4. Note
that the flame barrier temperature and porous media temperature data correspond to measurement
positions (b) and (c) in Fig. 1, respectively. It is observed that a good agreement exists between the two
sets of results for both the flame barrier temperature and the porous media temperature. The discrepancy
between the simulation results and the experimental results can be quantified by the error percentage
(Tsim − Texp )
Texp
. As shown in Fig. 5, the maximum discrepancy between the two sets of results is
found to be just 7% for the flame barrier temperature and 4% for the porous media temperature. Thus, the
basic validity of the numerical model is confirmed.
ISSN 2076-2895 (Print), ISSN 2076-2909 (Online) ©2010 International Energy & Environment Foundation. All rights reserved.
International Journal of Energy and Environment (IJEE), Volume 1, Issue 4, 2010, pp.589-606
597
Heating value (kW)
1.2
1400
1.6
2
2.4
2.8
3.2
3.6
Flame barrier temp. exp. [4]
Porous media temp. exp. [4]
Flame barrier temp. simulation
Porous media temp. simulation
1300
Temperature (K)
1200
1100
1000
900
800
700
600
6
8
10
12
14
16
18
20
22
H2 (LPM)
Figure 4. Comparison of experimental and simulation results for flame barrier temperature and porous
media temperature at various hydrogen contents in the range H2-8 ~ H2-20 LPM
10
9
Flame barrier temp. error
Porous media temp. error
8
Error (%)
7
6
5
4
3
2
1
0
6
8
10
12
14
16
18
20
22
H2 (LPM)
Figure 5. Discrepancy between experimental and simulation results for flame barrier temperature and
porous media temperature at various hydrogen contents in the range H2-8 ~ H2-20 LPM
3.2 Effect of hydrogen content on temperature distribution within burner
Figures 6(a)~6(g) show the simulated temperature contours within the porous media burner for hydrogen
contents of H2-20~H2-8 LPM, respectively, corresponding to fuel utilizations of Uf=0~0.6. In general,
the flame speed of hydrogen/air mixtures is around 6 times higher than that of methane/air mixtures in
free laminar flame burners. Thus, the flame barrier temperature must be carefully controlled in order to
ISSN 2076-2895 (Print), ISSN 2076-2909 (Online) ©2010 International Energy & Environment Foundation. All rights reserved.
598
International Journal of Energy and Environment (IJEE), Volume 1, Issue 4, 2010, pp.589-606
minimize the risk of overheating, flash back or flame extinction. Furthermore, for mixing chamber
temperatures greater than 673 K, additional cooling air may be required to prevent flash back [4]. In [4],
the mixing chamber temperature in the porous media burner (corresponding to the inlet temperature of
the fuel / air mixture in the present simulations) was found to vary between 549 and 664 K under the
considered condition. The maximum temperatures in Figs. 6(a)~6(g) are 1354, 1278, 1249, 1234, 1205,
1183, and 1163 K, respectively. Although the equivalence ratios for the seven simulation cases are
approximately the same in every case (i.e. 0.27~0.3, see Table 3), the results show that the flame barrier
temperature increases with an increasing hydrogen content. Furthermore, it is observed that the
maximum temperature within the mixing chamber exceeds a value of 673 K in every case, and thus
additional cooling air is required to prevent flash back. The amount of cooling air required increases as
the hydrogen content increases and it also results in lower mixing chamber temperature. Finally, it is
seen that the anode-off / cathode-off gas mixture entering the mixing chamber pushes the flame position
in the downstream direction of the burner. As a result, the maximum temperature is located in the exit
region of the burner in every case.
(K)
(a)
-0.05
0
Position (m)
0.05
1354
1307
1259
1212
1165
1117
1070
1023
975
928
880
833
786
738
691
644
596
549
(K)
(b)
-0.05
0
Position (m)
0.05
(K)
(c)
-0.05
0
Position (m)
0.05
0.05
(K)
1354
1307
1259
1212
1165
1117
1070
1023
975
928
880
833
786
738
691
644
596
549
0
Position (m)
0.05
(g)
-0.05
0
Position (m)
(K)
(d)
-0.05
0
Position (m)
0.05
1354
1307
1259
1212
1165
1117
1070
1023
975
928
880
833
786
738
691
644
596
549
(K)
(K)
1354
1307
1259
1212
1165
1117
1070
1023
975
928
880
833
786
738
691
644
596
549
(e)
-0.05
1354
1307
1259
1212
1165
1117
1070
1023
975
928
880
833
786
738
691
644
596
549
1354
1307
1259
1212
1165
1117
1070
1023
975
928
880
833
786
738
691
644
596
549
(f)
-0.05
0
Position (m)
0.05
1354
1307
1259
1212
1165
1117
1070
1023
975
928
880
833
786
738
691
644
596
549
Figure 6. Temperature contours within porous media burner for hydrogen contents of (a) H2-20, (b) H218, (c) H2-16, (d) H2-14, (e) H2-12, (f) H2-10, and (g) H2-8 LPM
ISSN 2076-2895 (Print), ISSN 2076-2909 (Online) ©2010 International Energy & Environment Foundation. All rights reserved.
International Journal of Energy and Environment (IJEE), Volume 1, Issue 4, 2010, pp.589-606
599
Figure 7 illustrates the influence of the hydrogen content (H2-8, H2-14 and H2-20 LPM) on the
temperature profile within the porous media regions of the burner. Note that the results correspond to two
planes within the burner, namely the central symmetry (SYM) plane and a plane located at a distance of
1/6H above the central symmetry plane, respectively. It can be seen that there is little significant
difference in the mixture inlet temperature in the various simulation cases. Furthermore, it is apparent
that the temperature increases in the downstream direction of the burner for all values of the hydrogen
content. However, it is noted that the temperature gradient within the flame barrier zone (0 ~ 0.011 m) is
lower than that in the porous media zone (0.011 ~ 0.063 m). In other words, the different porosity and
pore size characteristics of the two porous regions of the burner have a significant effect on the
temperature distribution within the burner. Figure 8 presents the temperature distribution along the
symmetry plane of the burner for hydrogen contents of H2-8 ~ H2-20 LPM. As in Fig. 6, the results show
that the maximum temperature within the burner increases with an increasing hydrogen content. In
addition, it is seen that the difference between the outlet temperature and maximum temperature in region
C (i.e. the porous media zone) reduces as the hydrogen content decreases. In other words, for combustion
at lower hydrogen concentrations, a more uniform temperature is obtained along the symmetry plane of
the burner.
1300
Temperature (K)
1200
1100
1000
Above SYM plane 1/6H, H2-8
900
Above SYM plane 1/6H, H2-14
Above SYM plane 1/6H, H2-20
SYM plane, H 2-8
SYM plane, H 2-14
800
SYM plane, H 2-20
700
0
0.02
0.04
0.06
0.08
Position (m)
Figure 7. Effect of hydrogen content (fuel utilization) on temperature distribution within porous media
regions of burner
Figure 9 illustrates the effect of the hydrogen content on the pattern factor (PF) of the porous media
burner. In general, even small variations in the fuel / air mixture ratio of gas turbine combustors can
result in measurable, and potentially detrimental, exit thermal gradients. These gradients not only
increase the emissions produced by the combustor, but also shorten the design life of any downstream
turbomachinery. As a result, a uniform temperature profile is generally sought within the combustor
through the careful design and manufacturing of the related combustor components. The pattern factor of
the present porous media burner is defined as
PF =
Tout , max − Tout , avg
Tout , avg − Tin, avg
(8)
where Tout , max is the maximum temperature at the burner outlet, Tout , avg is the average temperature at
the burner outlet, and Tin, avg is the average temperature at the burner inlet. Based upon the present
ISSN 2076-2895 (Print), ISSN 2076-2909 (Online) ©2010 International Energy & Environment Foundation. All rights reserved.
600
International Journal of Energy and Environment (IJEE), Volume 1, Issue 4, 2010, pp.589-606
simulation results, the PF value of the porous media burner is found to vary from 0.081 to 0.085. In
addition, the PF value is found to increase slightly as the hydrogen content is reduced. Thus, overall, the
results reveal that while the exit temperature of the burner is relatively uniform in every case, the
uniformity of the temperature distribution reduces slightly as the hydrogen content is decreased.
1400
1300
H2-20 (sym)
H2-18 (sym)
H2-16 (sym)
1200
H2-14 (sym)
Temperature (K)
H2-12 (sym)
1100
H2-10 (sym)
H2-8 (sym)
1000
900
800
700
600
500
-0.08
-0.04
0
0.04
0.08
0.12
Position (m)
Figure 8. Effect of hydrogen content (fuel utilization) on temperature distribution along burner symmetry
plane
0.09
Pattern factor
Pattern Factor
0.088
0.086
0.084
0.082
0.08
6
8
10
12
14
16
18
20
22
H2 (LPM)
Figure 9. Effect of hydrogen content on pattern factor (PF) of burner
3.3 Effect of burner geometry on operational range
It is well known that the geometry of porous media burners has a significant effect upon the combustion
performance. Figure 10 shows the burner geometries considered in the simulations performed in this
ISSN 2076-2895 (Print), ISSN 2076-2909 (Online) ©2010 International Energy & Environment Foundation. All rights reserved.
International Journal of Energy and Environment (IJEE), Volume 1, Issue 4, 2010, pp.589-606
601
study to clarify the geometry effect in the two-stage porous media burner shown in Fig. 1. Specifically,
Fig. 10(a) shows the default burner, Fig. 10(b) shows a burner in which the default burner length is
increased by a factor of 1.5, Fig. 10(c) shows a burner in which the default diameter is increased by a
factor of 1.5, and Fig. 10(d) shows a burner in which both the default length and the default diameter are
increased by a factor of 1.5(i.e. a length and diameter of 0.17 m and 0.06 m, respectively in the original
geometry). In establishing the operational range of the two-stage porous media burner, the following
conditions apply: (1) the flame barrier temperature should be less than 923 K in order to prevent flash
back, (2) the maximum burner temperature should not exceed 1373 K in order to prevent burn out, and
(3) the porous media temperature should exceed 1073 K in order to prevent flame extinction [4].
(a)
(b)
D
D
L
1.5 L
(c)
(d)
1.5 D
L
1.5 D
1.5 L
Figure 10. Burner geometries used for comparison purposes in evaluating operational range of burner
For each of the burner geometries shown in Fig. 10, the theoretical operational range can be determined
by examining the temperature distributions at the lowest (H2-8 LPM) and highest (H2-20 LPM) hydrogen
concentrations and establishing the flow rate which satisfies the three design constraints given above at
each hydrogen concentration. Figs. 6(a) and 6(g) show the temperature contours within the original
burner (see Fig. 10(a)) for hydrogen concentrations of H2-20 LPM and H2-8 LPM, respectively. The
corresponding operational range is determined to be 1.2 ~ 6.5 kW. Figure 11 presents the corresponding
results for the case in which the burner diameter is unchanged, but the burner length is increased by a
factor of 1.5 (see Fig. 10(b)). In this case, the operational range is found to increase to 2 ~ 9 kW. The red
dot in the figure is the checking point to satisfy the operation criteria. Figure 12 shows the temperature
contours within the burner when the original burner length is unchanged, but the diameter is increased by
a factor of 1.5 (see Fig. 10(c)). The corresponding operational range is found to be 2.6 ~ 11.5 kW.
Finally, Fig. 13 shows the temperature contours within the burner when both the original burner length
and the original burner diameter are increased by a factor of 1.5. In this case, the operational range is
found to extend from 3.5 ~ 16.5 kW.
4. Conclusions
This study has performed a numerical investigation into the premixed hydrogen combustion problem
within a two-stage porous media burner. In performing the simulations, the flow of the hydrogen / air
mixture within the burner has been described using a turbulent flow model and the combustion process
has been treated using a simple single-step chemical reaction model. A good agreement has been
observed between the simulation results and the experimental results for the flame barrier temperature
and porous media temperature at various values of the hydrogen content. Thus, the basic validity of the
numerical model has been confirmed. Simulations have been performed to investigate the effects of the
hydrogen content and the burner geometry on the temperature distribution within the two-stage burner
and the corresponding operational range. It has been shown that the temperature within the burner
ISSN 2076-2895 (Print), ISSN 2076-2909 (Online) ©2010 International Energy & Environment Foundation. All rights reserved.
602
International Journal of Energy and Environment (IJEE), Volume 1, Issue 4, 2010, pp.589-606
increases with an increasing hydrogen content and attains a maximum value in the exit region of the
burner. A more uniform temperature distribution is obtained along the symmetry plane of the burner as
the hydrogen content reduces. In addition, the rate of temperature increase within the flame barrier zone
is lower than that within the porous media zone. The results have confirmed that the operational range of
the burner is significantly dependent upon the burner geometry. Specifically, the original burner with a
length and diameter of 0.17m and 0.06m, respectively, has an operational range of 1.2~6.5 kW.
However, when the burner length or burner diameter is increased by a factor of 1.5, the operational range
increases to 2~9 kW and 2.6~11.5 kW, respectively. Finally, when both the burner length and the burner
diameter are increased by a factor of 1.5, the operational range increases to 3.5~16.5 kW. Overall, the
results presented in this study confirm that the numerical model used in the present simulations yields
useful insights into the hydrogen combustion process within a two-stage porous media burner and
provides a convenient means of identifying the operating conditions which minimize the risk of flash
back or flame extinction.
(K)
(K)
(a)
-0.1
0
Position (m)
0.1
1183
1146
1108
1071
1034
997
959
922
885
847
810
773
735
698
661
624
586
549
(b)
-0.1
0
0.1
Position (m)
1126
1099
1072
1044
1017
990
963
936
909
881
854
827
800
773
746
718
691
664
Figure 11. Temperature contours within burner with amplified length (i.e. Figure 10 (b)) under (a)
maximum hydrogen content, and (b) lowest hydrogen content conditions
(K)
1204
1165
1127
1088
1050
1011
973
934
896
857
819
780
742
703
665
626
588
549
(a)
-0.05
0
Position (m)
0.05
(K)
1168
1138
1109
1079
1049
1020
990
960
931
901
872
842
812
783
753
723
694
664
(b)
-0.05
0
Position (m)
0.05
Figure 12. Temperature contours within burner with amplified diameter (i.e. Figure 10 (c)) under (a)
highest hydrogen content, and (b) lowest hydrogen content conditions
(a)
-0.1
0
Position (m)
0.1
(K)
1230
1190
1150
1110
1070
1030
990
950
910
869
829
789
749
709
669
629
589
549
(b)
-0.1
0
Position (m)
0.1
(K)
1170
1140
1110
1081
1051
1021
991
962
932
902
872
843
813
783
753
724
694
664
Figure 13. Temperature contours within burner with amplified diameter and amplified length (i.e. Figure
10 (d)) under (a) highest hydrogen content, and (b) lowest hydrogen content conditions
ISSN 2076-2895 (Print), ISSN 2076-2909 (Online) ©2010 International Energy & Environment Foundation. All rights reserved.
International Journal of Energy and Environment (IJEE), Volume 1, Issue 4, 2010, pp.589-606
Nomenclature
pre-exponential factor
A
spectral absorption coefficient
a
b
concentration exponent of hydrogen
C1 , C 2 , C µ
turbulent constants
c
Ea
concentration exponent of oxygen
activation energy
I
k
M
N
radiation intensity
turbulent kinetic energy (m2/s2)
species annotation
number of chemical species in system
refractive index
pattern factor
heat flux
reaction rate constant
gas constant
temperature (K)
velocity in x-direction
velocity in y-direction
mass fraction of species
n
PF
q
R
Ru
T
u
v
Y
603
Greek symbols
temperature constant
β
turbulent energy dissipation rate
ε
(m2/s2)
ρ
density (kg m-3)
σk , σε
σs
φ
turbulent constant
scattering coefficient
equivalence ratio
solid angle
Ω
phase function
Φ
χ
stoichiometric coefficient
Superscripts and subscripts
′
reactant
′′
product
b
black body
f
forward
r
rate constant
wavelength
λ
exp
experiment
mix
mixture
sim
simulation
References
[1] Appleby A. J., Foulker F. R., Fuel Cell Handbook, Van Norstand Reinhold, New York, 1989.
[2] Stanley W. A., Direct Energy Conversion, Allyn and Bacon, Inc., Boston, 1982.
[3] Larminie J., Dicks A., Fuel Cell Systems Explained, John Wiely & Sons, Ltd, England, 2000.
[4] Yen T. H., Hong W. T., Tsai Y. C., Wang H. Y., Huang W. P., Lee C. H., Experimental
investigation of after-burner performance during a SOFC system operation, The 3rd National
Conference on Hydrogen Energy and Fuel Cell November 14-15, 2008, Tainan, Taiwan (2008).
[5] Trimis D., Durst F., Combustion in a Porous Medium - Advances and Applications, Combustion
Science and Technology, 121 (1996) 153-168.
[6] Hayashi T. C., Malico I. and Pereira J. C. F., Three-dimensional modeling of a two-layer porous
burner for household applications, Computers and Structures, 82 (2004) 1543-1550.
[7] Tseng C. J., Effects of hydrogen addition on methane combustion in a porous media burner,
International Journal of Hydrogen Energy, 27 (2002) 699-707.
[8] Mital R., Gore J. P., Viskanta R., A study of the structure of submerged reaction zone in porous
ceramic radiant burners, Combustion and flame, 111 (1997) 175-184.
[9] Rumminger M. D., Dibble R. W., Heberle N. H., Crosley D. R., Gas temperatures above a porous
radiant burner. Twenty-Sixth Symposium (International) on Combustion. Pittsburgh: The
Combustion Institute, (1997) 1755–1762.
[10] Zhou X. Y. and Pereira J. C. F., Numerical study of combustion and pollutants formation in inert
nonhomogeneous porous media, Combustion Science and Technology, 130 (1997) 335-364.
[11] Tseng C. J. and Howell J. R., Combustion of Liquid Fuels in a Porous Radiant Burner,
Combustion Science and Technology, 112 (1996) 141-161.
[12] Sathe S. B., Kulkarni M. R., Peck R. E. and Tong T. W., An experimental and theoretical study of
porous radiant burner performance, Twenty-third Symposium (International) on Combustion, The
Combustion Institute, Pittsburgh, (1990) 1011-1018.
[13] Yoshizawa Y., Sasaki K. and Echigo R., Analytical Study of the Structure of radiation controlled
flame, Journal of Heat and Mass Transfer, 31 (1988) 311-319.
[14] Ashok K. V., Ashok U. C., Frediano V. B., Studies of premixed hydrogen-air flames using
elementary and global kinetics models, Combustion and flame, 64 (1986) 233-236.
[15] Hsu P. F., Matthews R. D., The necessity of using detailed kinetics in models for premixed
combustion within porous media, Combustion and flame, 93 (1993) 457-466.
ISSN 2076-2895 (Print), ISSN 2076-2909 (Online) ©2010 International Energy & Environment Foundation. All rights reserved.
604
International Journal of Energy and Environment (IJEE), Volume 1, Issue 4, 2010, pp.589-606
[16] Hendricks T. J. and Howell J. R., Absorption/Scattering coefficient and scattering phase functions
in reticulated porous ceramics, Journal of Heat Transfer, 118 (1996) 79-87.
[17] Doormaal J.P. van, Raithby F. D., Enhancements of the SIMPLE method for predicting
incompressible fluid flows, Numer. Heat Transfer, 7 (1984) 147–163.
[18] Patankar S.V., Numerical Heat Transfer and Fluid Flow, McGraw-Hill, New York, 1980.
Tzu-Hsiang Yen obtained a PhD in Mechanical engineering from National Cheng Kung University in
Taiwan, 2006. He was a junior researcher at the Institute of Nuclear Energy Research. Now he is working
at the Refining and Manufacturing Research Institute, CPC Corporation, Taiwan and responsible for the
hydrogen energy planning and research. He has published 15 research papers in reputed International
journals and conferences.
E-mail address:
Wen-Tang Hong is a senior engineer of Institute of Nuclear Energy Research. He has 19 years research
experience, his research topics including: power plant, two phase flow, cold neutron source, and solid
oxide fuel cell.
E-mail address:
Yu-Ching Tsai is an assistant engineer of Institute of Nuclear Energy Research.
E-mail address:
Hung-Yu Wang is an assistant engineer of Institute of Nuclear Energy Research.
E-mail address:
ISSN 2076-2895 (Print), ISSN 2076-2909 (Online) ©2010 International Energy & Environment Foundation. All rights reserved.
International Journal of Energy and Environment (IJEE), Volume 1, Issue 4, 2010, pp.589-606
605
Cheng-Nan Huang is an assistant engineer of Institute of Nuclear Energy Research.
E-mail address:
Chien-Hsiung Lee obtained a PhD in nuclear engineering from Purdue University in USA, 1987. He is a
senior researcher at the Institute of Nuclear Energy Research. He has been managing the project of solid
oxide fuel cell power generating system since 2005. His main research interests include critical heat flux,
boiling heat transfer, cold neutron source, and solid oxide fuel cell.
E-mail address:
Bao-Dong Chen holds a PhD degree in chemical engineering from the University of Manchester Institute
of Science and Technology (UMIST), UK, in 1992. He is working as Manager of New Energy Department
at the Refining and Manufacturing Research Institute, CPC Corporation, Taiwan. Dr Chen has got over 25
years of research and development experience in the refining and petrochemicals industries and published
over 30 research papers in reputed national and international journals and conferences.
E-mail address:
ISSN 2076-2895 (Print), ISSN 2076-2909 (Online) ©2010 International Energy & Environment Foundation. All rights reserved.
606
International Journal of Energy and Environment (IJEE), Volume 1, Issue 4, 2010, pp.589-606
ISSN 2076-2895 (Print), ISSN 2076-2909 (Online) ©2010 International Energy & Environment Foundation. All rights reserved.