Carbon emission patterns in different income countries
Bạn đang xem bản rút gọn của tài liệu. Xem và tải ngay bản đầy đủ của tài liệu tại đây (1.15 MB, 16 trang )
I
NTERNATIONAL
J
OURNAL OF
E
NERGY AND
E
NVIRONMENT
Volume 2, Issue 3, 2011 pp.447-462
Journal homepage: www.IJEE.IEEFoundation.org
ISSN 2076-2895 (Print), ISSN 2076-2909 (Online) ©2011 International Energy & Environment Foundation. All rights reserved.
Carbon emission patterns in different income countries
Kai Wang
1
, Le-Le Zou
2
, Jie Guo
3
, Wen-Jing Yi
2
, Zhen-Hua Feng
3
, Yi-Ming Wei
4,5
1
Research Institute of Petroleum Exploration & Development, PetroChina, Beijing, 100083, China.
2
Institute of Policy and Management, Chinese Academy of Sciences, Beijing,
100190
, China.
3
School of Management, University of Science and Technology of China, Hefei, 230026, China.
4
Center for Energy and Environmental Policy Research, Beijing Institute of Technology, Beijing,
100081, China.
5
School of Management and Economics, Beijing Institute of Technology, Beijing, 100081, China.
Abstract
In order to find the main driving forces affecting CO
2
emission patterns and the relationship between
economic development and CO
2
emissions, this paper uses models of
σ
-convergence, absolute
β
-
convergence and conditional
β
-convergence to analyze the inner characteristics of CO
2
emissions and
the income level of 128 countries (and regions) in the world. The countries (and regions) are divided into
5 groups based on their per capita income levels. The results show that in the past 40 years, all the groups
showed trends of convergence on the CO
2
emissions. In terms of emission levels, lagging countries (and
regions) tend to catch up with advanced nations, with convergence tending to be conditional on country-
specific characteristics such as energy use and energy structures rather than absolute convergence. Then
this paper examines the impacts of selected variables such as GDP per capita, population, oil, gas, coal
etc. on the emission trends. The analysis on the impacting factors shows that for the developing countries
(and regions), the levels of economic development have greater effects on their carbon emissions
patterns. And for the developed countries (and regions), the energy consumption structures wielded a big
influence for the past 40 years. We find that the growth speed of CO
2
emissions in developed countries
(and regions) would get slower, and those of the developing countries (and regions) give expression to
catching-up effects. These findings are expected to shed a light on the global policy making in coping
climate change.
Copyright © 2011 International Energy and Environment Foundation - All rights reserved.
Keywords: Carbon emission, Convergence, Catch up, Income level, Impact factors.
1. Introduction
The research on the relationship between economic growth and greenhouse gases (GHG) emissions can
be traced back to the well-known IPAT identity [1]. Ehrlich and Holdren discussed the environmental
impacts on GHG emissions from population, affluence and technology. After that, there were many
discussions on different styles of IPAT models, including those in the IPCC special report Special Report
on Emissions Scenarios [2].
Besides the IPAT model, many researches focused on the experience curve of economic growth and
emissions, which combines per capita incomes and measures of environmental degradation, and was
known as an Environmental Kuznets Curve (EKC). The Environmental Kuznets Curve suggests that
International Journal of Energy and Environment (IJEE), Volume 2, Issue 3, 2011, pp.447-462
ISSN 2076-2895 (Print), ISSN 2076-2909 (Online) ©2011 International Energy & Environment Foundation. All rights reserved.
448
low-income countries (and regions) experience low emissions. When the per capita income rises, the
emissions will initially increase followed with decrease after getting the peak [3-12].
Roberto Ezcurra concluded that the spatial distribution of CO
2
emissions has so far received little
attention in the literature, despite several motivations for such an analysis [13]. The geographic
distribution analysis of CO
2
emissions is meaningful to the need for environmental policies and
predicting their potential impact [13-15]. The study of spatial distribution of CO
2
emissions is useful to
complete and qualify some of the findings documented in the vast literature over the last two decades
dedicating to analyze the world income distribution and test the neoclassical convergence hypothesis [16-
25].
Despite the potential importance of this issue, there are very few papers studying the cross-country data:
Strazicich and List studied the temporal paths of carbon dioxide emissions in twenty-one industrial
countries (and regions) from 1960 to 1997 [26]. They tested stochastic and conditional convergence.
Both panel unit root tests and cross-section regressions were performed. They found significant evidence
which indicated that CO
2
emissions have converged in industrial countries (and regions).
The carbon emission patterns of different countries (and regions) are crucial in the international climate
change negotiations. Since 1992, the so called “common but differentiated responsibilities” have been
one of fundamental principles of international environmental agreements. The major sticking point in
negotiations between the developing countries (and regions) and the developed countries (and regions) is
how to undertake the emission reduction obligations. In different economic development phases, the
emission patterns might be very different, so developing countries (and regions) may assume different
responsibilities other than developed countries (and regions). The research on carbon emission patterns is
also useful to the government policy makers. The identifying of driving forces behind the emission
patterns, and discriminating which factors through which ways affect the emission patterns could bring
significant policy implications.
In this paper, based on the works of Strazicich and List, we use convergence theory and correlation
method to analyze the driving forces of distinguishing emission patterns [26]. The economic level, the
process of industrialization, energy consumption structure and population are important factors
functioning on emissions and they differ greatly in various countries (and regions). In order to find some
more precise insights, in this study we put the world countries (and regions) into different groups.
The rest of the paper is organized as follows: section 2 describes the models and data used in this paper.
In section 3, we present a correlation analysis between CO
2
emission levels and other variables. In
section 3 and section 4 different convergence models are employed to research the emission patterns of
five countries (and regions) groups. Section 5 concludes the paper.
2. Theory, data, and empirical models
2.1 Correlation,
σ
-convergence and
β
-convergence
In the traditional Solow–Swan neoclassical growth model [27, 28], the economic grows from a
transitional path toward a steady state, and the per capita incomes among nations should converge when
some variables are controlled.
The
σ
-convergence model and
β
-convergence model were proposed by Barro and Sala-i-Martin [29].
A. Miketa and P. Mulder provided an empirical analysis on the energy-productivity convergence across
56 developed and developing countries (and regions) with 10 manufacturing sectors during the period of
1971 to 1995 [30]. They found that with the exception of the non-ferrous metals sector, cross-country
differences in absolute energy-productivity levels tend to decrease, particularly in the less energy-
intensive industries. Hua Liao used the economic growth model to analyze China’s energy efficiency in
provincial scale [31].
Based on former researches, in this paper
σ
-convergence and
β
-convergence are defined as follows:
σ
-convergence indicates the dispersed patterns of different countries’ (and regions’) emission patterns,
implies the degrees of inequality. If the disparity of per-capita carbon emission patterns among country
groups becomes smaller, or the same phenomenon of decreasing cross-country differences in per-capita
carbon emission level occurs, then
σ
-convergence happens.
β
-convergence indicates the “catch up”
effect referring that countries (and regions) of low emission levels usually carry a potential for rapider
advancing than high emission level countries. So the emission levels of countries (and regions) with
higher emission growth speed might catch up with those of countries (and regions) with lower emission
growth speed. If the results are significant without other variables being controlled, it is called absolute
International Journal of Energy and Environment (IJEE), Volume 2, Issue 3, 2011, pp.447-462
ISSN 2076-2895 (Print), ISSN 2076-2909 (Online) ©2011 International Energy & Environment Foundation. All rights reserved.
449
β
-convergence. If the results are significant with other variables being controlled such as GDP per-
capita and energy consumption, it is called conditional
β
-convergence.
The correlation statistics are calculated as equation (1):
()()
ii
ii
iXiY
XY
EX Y
µµ
ρ
σσ
⎡⎤
−−
⎣⎦
=
(1)
where
i
X
is the per capita emissions in country
i
,
i
Y
is the control variables(GDP, coal, oil, natural gas,
etc.),
µ
is the expectation value of per capita emissions and
σ
is the variance of per capita emissions.
The measures on absolute values are different, but in time scale, the trends of those measures should be
identical [31]. In this paper, we use the standard deviation and the Theil indicator to represent the
variation of cross-country differences in emission patterns.
Suppose there are
n
countries (and regions),
it
C
is the per capita carbon emission of country
i
in year
t
.
The standard deviation of
it
C
is:
2
2
11
(ln( )) ln( )
(1)
nn
it it
ii
t
nC C
SD
nn
==
⎛⎞
−
⎜⎟
⎝⎠
=
−
∑∑
(2)
The Theil indicator:
1
11
()ln( )
n
it it
t
nn
i
it it
ii
CC
Theil n
CC
=
−−
=×
∑
∑∑
(3)
β
-convergence was put forward by Baumol [17], Barro and Sala-i-Martin [20]. We calculate the
β
-
convergence as follows:
0
0
1
1
1/( 1) (ln ln ) ln
T
it it it i
t
TCC Cv
αβ
−
+
−−=++
∑
(4)
where
0
t
is the initial year,
T
is the number of years,
i
v
is an independent and identically distributed
error term with zero mean and finite variance.
α
is a constant,
β
is a parameter testing the null
hypothesis of divergence.
it
C
is the initial value of per capita emissions in country
i
in year
t
. If
0
β
<
and the test is significant, then there is absolute
β
-convergence in sample countries (and regions)
The economic levels, populations, resources, energy structures are quite different between countries (and
regions) around the world. How these factors affect the emission patterns in different country groups?
Here we use the conditional
β
-convergence:
0
0
1
1
1/( 1) (ln ln ) ln ln
T
it it it i i
t
TCC Czv
αβ γ
−
+
−−=+++
∑
(5)
where the vector of conditional variables
i
z
indicates the factors which might affect the emission
patterns. In this paper, considering the findings in former studies of Strazicich and List [26], we select
the per capita GDP in 2000 year U.S. dollars, sum of the populations, consumption amount of oil, gas
and coal of the country groups in each year as the proxy indicators. We use geometric mean of each
control variables to cover the whole time period. The analysis of conditional convergence gets practical
meanings: if some variables are significant, then the government could take policy measures to regulate
the certain variables thereby to control the emission trend efficiently.
Based on the research of Miketa and Mulder [30], the convergence speed is calculated as follows:
International Journal of Energy and Environment (IJEE), Volume 2, Issue 3, 2011, pp.447-462
ISSN 2076-2895 (Print), ISSN 2076-2909 (Online) ©2011 International Energy & Environment Foundation. All rights reserved.
450
[(1/ )log( 1)]T
λ β
=− +
(6)
β
is calculated from equation (4) and equation (5).
2.2 Data source and data process
The emission data used in this paper are per-capita emission (tons CO2 equivalent per-capita). The per
capita GDP in 2000 year U.S. dollars, populations and emission per-capita are from World
Development Indicator 2008 [32]. The oil consumptions (Thousand barrels per day), natural gas
consumptions (Billion cubic metres per year) and coal consumptions (Million tons oil equivalent per
year) are from BP Statistical Review of World Energy 2008 [33].
The reasons we use per-capita CO
2
data rely on that the per-capita CO
2
data have low sensitive to
national territory difference and they are comparable in big and small countries (and regions). Also the
political meanings of per-capita CO
2
data are easy to be understood.
The data from many developing countries (and regions) are incomplete. There are also many new
countries (and regions) (such as some places in Africa and Balkan). We exclude these countries (and
regions). The CO
2
data in developing countries (and regions) before 1965 are few, and only some
countries’ (and regions’) CO
2
data after 2005 were published, so the selected period is from 1965 to
2004. The GDP data of some developing countries (and regions) in 1960s are missing, so we use the
earliest GDP data we can found in these countries (and regions) including Yemen, Ethiopia and
Gambian. In 1960s, these countries (and regions) had not entered the fast growing period, so the starting
time selection does not significantly affect the conclusions. Besides, in BP Statistical Review of World
Energy 2008 [33], Belgium and Luxembourg’s energy data were summed and counted as one. The
population and energy consumption in Luxembourg are relatively small, so we approximately use the
sum of Belgium and Luxembourg as Belgium itself. Some old data are missing form BP statistical
review, so we use the newest data which are available from BP to calculate instead. The energy
consumption data are incomplete in more than half of the developing countries (and regions). The
explanatory power will be weakened a lot if these countries (and regions) are excluded. So the energy
consumption structure affects analyses are only carried on developed countries (and regions).
After data processing, the data from 128 countries (and regions) in 40 years enter our research.
According to the United Nations, the countries are categorized into 5 groups based on the income level:
23 high income OECD countries (and regions), 16 high income Non-OECD countries (and regions), 31
upper middle income countries (and regions), 35 lower middle income countries (and regions) and 23
low income countries (and regions). The income levels did not change a lot in recent 50 years, so we do
not consider the group changing.
3. The correlation-ship between per capita emission patterns and economic growth
In this section, we will discuss the relationship between per capita emission patterns and economic
growth divided by countries income levels.
3.1 High income OCED countries (and regions)
High income countries (and regions) are the most powerful and influential on both policies and
developments around the world. They are very active in the international issues of coping climate change
and related negotiations. These countries (and regions) have been discharging pollution gases since the
industrial revolution. Their cumulative emissions are the biggest in all five groups. The high income
OCED countries hold the greatest responsibility in coping climate change. Since 1960s, these countries’
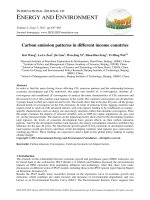
per capita emissions have been rising except a few countries such as Australia, Ireland and France. The
per capita emission of USA ranked the first in the past 40 years (Figure 1).
International Journal of Energy and Environment (IJEE), Volume 2, Issue 3, 2011, pp.447-462
ISSN 2076-2895 (Print), ISSN 2076-2909 (Online) ©2011 International Energy & Environment Foundation. All rights reserved.
451
Figure 1. Per capita emissions in high income OECD countries (and regions)
Based on the calculation of equation (1), we found that:
(1) In 1965, the per capita emissions showed strong positive correlation with coal consumptions. In
1960s, coal hold big percentage in energy consumption structure. Compared with oil and gas, the CO
2
emission from coal is 36% higher than that from oil, 61% higher than that from gas. In 1965, the
correlation indicator between coal consumptions and CO
2
emissions is 0.6698 (Table 1).
(2) In 2004, the correlation between emissions and other variables are weaker than in previous years.
This phenomenon was partly caused by the energy structure reconstruction in many countries. Energy
efficiency improvement was also very important. Besides, the coming into force of the international
climate change agreements and the application of low carbon technologies kept downing the emissions in
these countries (and regions).
Table 1. The correlation analysis of high income OECD countries (and regions)
1965
Correlation
Emission
per capita
GDP per
capita
Populations
Oil
consumptions
Natural gas
consumptions
Coal
consumptions
Emission per capita 1
GDP per capita 0.5431 1
Populations 0.4589 0.2154 1
Oil consumptions 0.6294 0.3367 0.9204 1
Natural gas
consumptions
0.6041 0.3109 0.8433 0.9812 1
Coal consumptions 0.6698 0.3163 0.9069 0.9577 0.9149 1
2004
Emission per capita 1
GDP per capita 0.4244 1
Populations 0.435 0.3006 1
Oil consumptions 0.5017 0.3108 0.974 1
Natural gas
consumptions
0.5415 0.2893 0.9422 0.9833 1
Coal consumptions 0.5313 0.3108 0.9525 0.9898 0.9779 1
International Journal of Energy and Environment (IJEE), Volume 2, Issue 3, 2011, pp.447-462
ISSN 2076-2895 (Print), ISSN 2076-2909 (Online) ©2011 International Energy & Environment Foundation. All rights reserved.
452
3.2 High income non OCED countries (and regions)
Most high income non OCED countries (and regions) are islands countries (and regions), such as French
Polynesia, New Caledonia, Singapore, Cyprus, and Bahamas. Some Middle East countries (and regions)
also belong to high income non OCED countries (and regions), including Israel, Saudi Arabia and United
Arab Emirates. The high income non OCED countries (and regions) are usually small with low
percentage of heavy industry and their tourism industry is well developed. So, most of these countries’
(and regions’) emission patterns are relatively steady (except United Arab Emirates, Brunei and
Bahamas) (Figure 2).
Figure 2. Per capita emissions in high income Non-OECD countries (and regions)
Because of the accessibility of the data, the energy consumption structure is not taken into the correlation
analysis as in other four country groups, but only emission per capita, GDP per capita and population.
(1) In 1965, the per capita emissions showed weak negative correlation with GDP and population. For
the countries (and regions) whose tourism industry and entrepot trade are well developed, the emissions
were relatively small and had less correlations with economic growth.
(2) In 2004, the per capita emissions showed weak positive correlation with GDP. The indicators were
still small when the economy grew (Table 2).
Table 2. The correlation analysis of high income Non-OECD countries (and regions)
Correlation
1965
Emission
per capita
GDP per
capita
Populations
Correlation
2004
Emission
per capita
GDP per
capita
Populations
Emission
per capita
1
Emission
per capita
1
GDP per
capita
-0.1096 1
GDP per
capita
0.17 1
Populations -0.2345 -0.2332 1 Populations 0.0837 0.0424 1
3.3 Upper middle income countries (and regions)
The countries (and regions) in this group bear huge differences. Most countries’ (and regions’) emissions
were low. Libya got the peak of carbon emission before 1970. From qualitative perspectives, the higher
percentage of manufacturing in the whole industry, the higher per capita emissions these countries (and
regions) got (Figure 3).


![Chemical and functional components in different parts of rough rice (oryza sativa l[1] ) beforeandaftergermination](https://media.store123doc.com/images/document/14/rc/qa/medium_qab1394872940.jpg)