Exergoeconomic optimization and improvement of a cogeneration system modeled in a process simulator using direct search and evolutionary methods
Bạn đang xem bản rút gọn của tài liệu. Xem và tải ngay bản đầy đủ của tài liệu tại đây (657.83 KB, 14 trang )
INTERNATIONAL JOURNAL OF
ENERGY AND ENVIRONMENT
Volume 2, Issue 3, 2011 pp.463-476
Journal homepage: www.IJEE.IEEFoundation.org
Exergoeconomic optimization and improvement of a
cogeneration system modeled in a process simulator using
direct search and evolutionary methods
Alexandre S. Cordeiro1, Leonardo S. Vieira2, Manuel E. Cruz3
1
UFRJ – Federal University of Rio de Janeiro, Department of Mechanical Engineering,
COPPE/Politecnica, CP 68503, CT, Cidade Universitaria, Rio de Janeiro, RJ, 21945-970, Brazil.
2
CEPEL – Electrical Energy Research Center, Special Technologies Department, CP 68007, Av. Hum
s/n, Cidade Universitaria, Rio de Janeiro, RJ, 21944-970, Brazil.
3
UFRJ – Federal University of Rio de Janeiro, Department of Mechanical Engineering,
COPPE/Politecnica, CP 68503, CT, Cidade Universitaria, Rio de Janeiro, RJ, 21945-970, Brazil.
Abstract
The optimal design and operation of energy systems are critical tasks to sustain economic growth and
reduce environmental impacts. In this context, this paper presents the mathematical optimization and
exergoeconomic improvement of an energy system modeled in a professional thermodynamic process
simulator using the direct search method of Powell and an evolutionary stochastic method of the genetic
type. In the mathematical optimization approach, as usual, the minimum system total cost is sought by
simultaneous manipulation of the entire set of decision variables. At times, the global minimum is not
exactly reached. On the other hand, the exergoeconomic improvement methodology determines, based
on the exergetic and economic analyses of the system at each iteration, a subset of most significant
decision variables which should be modified for each component, and applies an optimization algorithm
to these variables only. In the improvement process an appreciable reduction, not strict minimization, of
the system total cost is sought. The energy system analyzed is a 24-component cogeneration plant,
denoted CP-24, which is representative of complex industrial installations. As opposed to a conventional
optimization approach, the integrated optimization with a professional process simulator eliminates the
necessity to implement explicitly the constraints associated with the physical and thermodynamic models
of the system. Therefore, the integrated strategy can tackle large systems, and ought to be more easily
applied by practicing energy engineers. The results obtained permit, first, to compare the performance of
mathematical optimization algorithms belonging to different classes, and, second, to evaluate the
effectiveness of the iterative exergoeconomic improvement methodology working with these algorithms.
Copyright © 2011 International Energy and Environment Foundation - All rights reserved.
Keywords: Cogeneration, Direct search methods, Exergoeconomic improvement, Process simulator,
Thermoeconomic optimization.
1. Introduction
Throughout the world, the optimal design and operation of energy systems are critical objectives to
sustain economic growth and reduce environmental impacts. Therefore, efficient optimization and
improvement methodologies ought to be available and easily applicable by practicing energy engineers.
ISSN 2076-2895 (Print), ISSN 2076-2909 (Online) ©2011 International Energy & Environment Foundation. All rights reserved.
464
International Journal of Energy and Environment (IJEE), Volume 2, Issue 3, 2011, pp.463-476
In this context, a considerable amount of recent research effort has been expended (e.g., [1-9]). The
present work contributes with a pointful appraisal of the mathematical optimization and exergoeconomic
improvement of energy systems modeled in a professional thermodynamic process simulator.
First, for mathematical optimization, the direct-search method of Powell [10] and a genetic algorithm
[11] are selected, and their performances are evaluated. Both methods do not require the calculation of
derivatives of the objective function, thus avoiding differentiability issues, and streamlining the
computational implementation of the optimization problem solution when a process simulator is used. It
is known that the method of Powell can be made efficient [10, 12], and, among the evolutionary
stochastic methods, genetic algorithms have demonstrated robustness when applied to diverse
optimization problems in engineering [12, 13]. In the mathematical optimization approach, as usual, the
minimum system total cost is sought by simultaneous manipulation of the entire set of decision variables.
At times, the global minimum may not be exactly reached [14].
Second, the performance of an iterative exergoeconomic improvement methodology using these same
optimization algorithms is here evaluated. The methodology, originally proposed by Vieira et al. [15],
aims to obtain an appreciable reduction, not strict minimization, of the system total cost, and has been
recently termed the EIS method [16, 17]. The EIS method establishes, based on the exergoeconomic
analysis of the system at each iteration and on several qualitative and quantitative objective criteria, a
hierarchical classification of the system components, and the associated subsets of most significant
decision variables. For each component deemed relevant, an optimization algorithm is then applied to the
respective reduced-set decision variables only. The iterations proceed until a user-prescribed stopping
criterion is met for the reduction of the objective function.
The energy system analyzed here is a 24-component cogeneration plant, denoted CP-24, which is
representative of complex energy systems found in industry. The professional process simulator IPSEpro
[18] has been selected to model the CP-24 system. As opposed to a conventional optimization approach,
the integrated optimization with a process simulator eliminates the necessity to implement explicitly the
constraints associated with the physical and thermodynamic models of the system. Therefore, the
integrated strategy can effectively tackle large systems [16, 17, 19].
Several optimization and improvement exercises for the CP-24 system are carried out. The results
obtained permit, first, to compare the performances of mathematical optimization algorithms belonging
to different classes, and, second, to evaluate the effectiveness of the iterative exergoeconomic
improvement methodology working with these algorithms. In addition, the new findings and results
obtained here are compared with those presented by Vieira et al. [16, 19] for the same CP-24 system,
where only the flexible polyhedron algorithm by Nelder and Mead [10] had been used.
2. The cogeneration plant CP-24
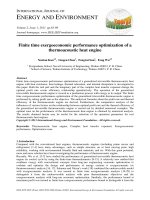
The 24-component cogeneration system, whose flow diagram is shown in Figure 1, includes two gas
turbines (GT01, GT01a), one extraction steam turbine (ST01), one condensation steam turbine (ST02),
two heat recovery steam generators (HRSG01, HRSG01a), two water heaters (Heater01, Heater01a), one
deaerator, one condenser, one cooling tower, and various pumps (P01, P02, P02a, P03), mixers (M1,
M2), splitters (S1, S2, S3, S4) and blockage valves (V1, V2, V3). The system possesses 52 mass streams,
including plant inflows and outflows. The products of CP-24 are the electricity from the gas and steam
turbines, the superheated process steam, and the process hot water. The fuel for the gas turbines is natural
gas. The plant is considered complex, because it includes all the major components of a real energy
system, and it requires O(103) variables for its simulation. It is remarked that this cogeneration system is
the same as that used by Vieira et al. [19], such that, for ease of comparison of results, the notation
adopted in that reference is also employed here. The plant is modeled with the IPSEpro process
simulation software.
With respect to the mass flows in the CP-24, the expansion of combustion gases in the gas turbines
generates part of the produced electricity. In the sequence, heat is transferred from these gases to the
water to produce superheated steam in the two HRSGs. The two steam flows are mixed, and the resulting
stream follows to the extraction turbine. After partial expansion in this turbine, a fraction of the steam is
extracted for use in the process. The condensate of the process steam returns to the deaerator. The
remnant steam further expands in the condensation steam turbine, producing more electricity. A
condenser and a cooling tower are responsible for steam condensation after expansion in the turbine. The
condensate then follows to the deaerator. The combustion gases, after leaving the HRSGs, are further
used to produce hot water to the process. Finally, they are discharged to the atmosphere.
ISSN 2076-2895 (Print), ISSN 2076-2909 (Online) ©2011 International Energy & Environment Foundation. All rights reserved.
International Journal of Energy and Environment (IJEE), Volume 2, Issue 3, 2011, pp.463-476
fuel
GT01
steam return
M1
HRSG01
process steam
V1
Heater
01
ST01
air
P02
GT01a
S4
Cooling
tower
S2
V3
M2
Heater
01a
HRSG01a
ST02
V2
S1
fuel
465
air
S3
air
Condenser
Deaerator
P02a
P03
P01
hot water return
process hot water
Figure 1. Schematic flow diagram of the cogeneration plant CP-24
3. Problem formulation
Three optimization problems with 8, 9, and 11 decision variables are formulated and solved in [16,19]
for the CP-24 cogeneration plant, respectively denoted by OP8, OP9, and OP11. For all problems, the
objective function OF is the same, and the process steam and process hot water demands are assumed
constant. Here, the larger problem OP11 is considered for both mathematical optimization and
exergoeconomic improvement. Table 1 shows the descriptions of the decision variables, the
denominations used, and their minimum and maximum allowable values. In problem OP11, in addition
to the evident consideration of the turbines and HRSGs, some decision variables associated with the
condenser and cooling tower are weighed in the investigation.
Table 1. Decision variables for the optimization problem OP11 of system CP-24
Variable
Power (ISO) of gas turbine GT01 (kW)
Power (ISO) of gas turbine GT01a (kW)
Load of gas turbine GT01
Load of gas turbine GT01a
Steam pressure at exit of mixer M1 (bar)
Steam temperature at exit of HRSG01 (ºC)
Steam temperature at exit of HRSG01a (ºC)
Steam pressure at extraction of ST01 (bar)
Inlet condenser pressure (bar)
Cooling tower range (ºC)
Cooling tower approach (ºC)
Symbol
GT01.kW
GT01a.kW
GT01.f
GT01a.f
S09.p
S08.t
S08a.t
S14.p
S16.p
Range
Approach
Lower limit
40000
40000
0.50
0.50
20.0
350.0
350.0
2.0
0.05
2.0
2.0
Upper limit
100000
100000
1.00
1.00
120.0
600.0
600.0
10.0
0.50
10.0
10.0
The objective function to be minimized is the sum of the specific costs of the system products, which
include the costs of capital investment, fuel, and operation and maintenance. The total system product is
the sum of the exergies of the generated electrical power, superheated process steam, and process hot
water. The objective function OF in US$ per unit exergy may be expressed by [16, 19]
ISSN 2076-2895 (Print), ISSN 2076-2909 (Online) ©2011 International Energy & Environment Foundation. All rights reserved.
International Journal of Energy and Environment (IJEE), Volume 2, Issue 3, 2011, pp.463-476
466
NK
NP
OF = ∑ cPi =
NF
∑ Z& + ∑ c
k =1
k
i =1
Fi
E& Fi
NP
∑ E& Pi
i =1
(1)
i =1
where c means specific cost, Z& denotes cost rate, E& denotes rate of exergy transfer, subscripts F and P
indicate system fuel and system product, respectively, NK is the number of system components, and NP
and NF are the numbers of system products and fuels, respectively. The sum of the capital investment
and the operation and maintenance cost rates for the NK components of the plant is given by [16, 19, 20]
⎛ NK
⎞
⎜ ∑ ( CRF + γ ) TCI k ⎟
⎠
∑ Z&k = ⎝ k =1
NK
k =1
τ
(2)
In Eq. (2), TCIk = β PECk is the total capital investment for component k, k = 1,…NK, PECk is the
purchased-equipment cost of component k, CRF = i(1 + i)l/((1 + i)l – 1) is the capital recovery factor, τ is
the number of hours the plant operates in one year, γ is the maintenance factor, here assumed constant,
and l and i are, respectively, the useful system life and interest rate. The constant factor β purports to
account for all direct and indirect costs of the system [20]. The values of the economic parameters used
in all calculations are [16, 19]: β = 2, i = 12.7%, l = 10 years, τ = 8000 hours, and γ = 0.06. The equations
for PECk, k = 1,…NK, are found in [19].
The mass and energy balances for the plant are equality constraints of the optimization problem. In
addition, the fixed process steam and process hot water demands are also equality constraints [19]. The
inequality constraints are represented by the allowable ranges of variation of the decision variables,
presented in Table 1.
4. Problem solution integrated with a process simulator
The formulated optimization problem is solved by integrating the optimization and improvement routines
with the modular process simulator IPSEpro [15, 19]. Integration requires a two-way communication
interface, provided by the MS-Excel supplement PSExcel [18]. The optimization and improvement
routines are written in the VBA (Visual Basic for Applications) language, run without user intervention,
and perform the following tasks: (i) send plant data to the simulator; (ii) issue the command to run a
simulation (‘RunCalculation’); (iii) receive new plant data from the simulator; (iv) effect calculations of
the optimization (sections 5 and 6) or improvement (section 7) algorithm; (v) return to task (i) while a
stopping criterion is not met.
The thermodynamic calculations of the simulator impose the equality constraints associated with the
mass and energy balances for the plant CP-24. As commonly employed in direct search optimization
algorithms [10, 19, 21], the inequality constraints are incorporated through penalties applied to the
objective function. Here, a penalty increases the objective function OF by a relatively large amount,
which is proportional to the magnitude of the difference between the current (not admissible) value of the
constrained decision variable and the respective limiting value. Furthermore, a penalty is applied to the
objective function, whenever thermodynamic infeasibility is obtained in the process simulator along the
search process. For the evolutionary algorithm, the computational implementation does not already allow
tentative points (individuals) with decision variables (genes) outside the limits to be part of the
population considered by the algorithm.
An optimization exercise thus consists of the application of the integrated optimization or improvement
approach to the CP-24 simulation model starting at an initial design point, with ensuing execution of the
algorithm until a stopping criterion is satisfied, so that a final design point is obtained. The initial point is
generically denoted by X0 = (x1,0, x2,0,…, xn,0), and possesses an associated value of the objective
function, OF0. The point obtained at the end of the procedure, Xf = (x1,f, x2,f,…, xn,f), contains the final
values of the decision variables, and is associated with the final value OFf; of course, OFf is improved
relative to OF0. Indeed, one expects that Xf is close to, if not coincident with, the system global optimum
point X*, associated with OF*.
ISSN 2076-2895 (Print), ISSN 2076-2909 (Online) ©2011 International Energy & Environment Foundation. All rights reserved.
International Journal of Energy and Environment (IJEE), Volume 2, Issue 3, 2011, pp.463-476
467
5. The method of Powell
The direct-search method of Powell [10] is applicable to the optimization of functions of several
variables for which there are no constraints. When constraints are imposed, as noted in the previous
section, one may couple the algorithm to a penalty method. Powell’s method locates the minimum of a
multivariable function by successive one-dimensional searches along a set of conjugate directions
generated by the algorithm itself. Therefore, at each stage, it is necessary to apply a one-dimensional
search method, i.e., an algorithm for extremization of a function of one variable only.
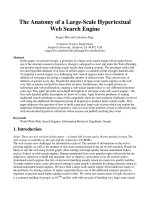
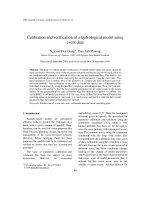
In the present work, the term Powell’s method actually refers to a combination of two algorithms [10,
22]: the improved, or modified, n-D Powell’s method, and the efficient combined DSC-Powell 1-D
search algorithm. The n-D and 1-D algorithms are schematically described in Figures 2 and 3,
respectively. Powell’s method has been implemented in VBA, integrated with the IPSEpro simulator.
Validation of the implementation has been carried out in Ref. [22] through application to standard
functions, and also through comparison to the results of Refs. [15, 23, 24] for the benchmark CGAM
system [20, 25]. As will be verified in the results section, the performance of Powell’s method is
significantly better than that of the flexible polyhedron method by Nelder and Mead [10, 16, 19].
Figure 2. Algorithm for the improved n-D Powell’s method to minimize f(x) [10, 22]
ISSN 2076-2895 (Print), ISSN 2076-2909 (Online) ©2011 International Energy & Environment Foundation. All rights reserved.
468
International Journal of Energy and Environment (IJEE), Volume 2, Issue 3, 2011, pp.463-476
Figure 3. Algorithm for the combined DSC-Powell 1-D search to minimize g(x) [10, 22]
6. The genetic algorithm
Genetic algorithms [11, 13] are stochastic evolutionary optimization techniques, based heuristically on
the biological principle of natural selection, which warrants survival of the fittest individuals in a given
population. Usually, the aptitude of an individual is represented quantitatively by the associated value of
the objective function, such that at the end of the optimization process the fittest individual constitutes
the problem optimal solution. From an initial random population, natural selection works its way thru
generations, modifying the individuals by means of crossover and/or mutation, leading to new
populations. Genetic algorithms are known to be robust, in that they tend to find the global optimum,
albeit at the cost of intensive computational time.
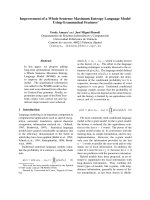
The steps of the genetic algorithm are illustrated in Figure 4 [22, 23]. In the present problem, an
individual contains a chromosome with 11 genes, 1 for each decision variable, plus an extra one for OF.
Due to the nature and variation ranges of the decision variables, here the chromosomes have been coded
ISSN 2076-2895 (Print), ISSN 2076-2909 (Online) ©2011 International Energy & Environment Foundation. All rights reserved.
International Journal of Energy and Environment (IJEE), Volume 2, Issue 3, 2011, pp.463-476
469
with real numbers. Accordingly, the classical genetic operators of crossover and mutation are also
implemented with real coding. Selection has been effected by tournament. To improve the performance
of the algorithm, and to avoid stochastic deviations due to pseudo-random number generation, the elitism
operator has also been used, which guarantees that the fittest individual in a given generation will be
present in the following generation.
The performance of a genetic algorithm with respect to convergence to the global optimum point in the
search space depends on the values assigned to its various control (adjustable) parameters. The size of
the population (i.e., number of individuals), Nind, and the probability of occurrence of a mutation, Pm, are
two such parameters associated with the diversity of the population. The greater the diversity, the greater
are the chances that some individual will be close to the global optimum of the objective function. The
population diversity is maximum at the beginning of the genetic algorithm search process, and decreases
along the Ngen generations. The probability of occurrence of a crossover, Pc, and the method of selection,
on the other hand, determine the selection pressure of the genetic algorithm. The selection pressure is
responsible for guiding the search to promising regions of the space. The larger the selection pressure,
the larger is the speed of convergence to such regions. Because of the somewhat competing tendencies
just described, a parametric study has been carried out [22, 23], to judiciously adjust the values of all the
control parameters to be used with the genetic algorithm in the optimization and exergoeconomic
improvement processes of the CP-24 system. The selected values of the control parameters are shown in
Table 2. Because the improvement approach (section 7) works with reduced sets of decision variables,
the number of generations Ngen can be much reduced relative to that for the optimization process.
Figure 4. Steps of the genetic algorithm [22, 23]
Table 2. Values of the genetic algorithm parameters for optimization and improvement of plant CP-24
Parameter
Value for Optimization
Value for Improvement
Nind
80
50
Ngen
50
3
Pc (%)
65
65
Pm (%)
5
5
7. The exergoeconomic methodology
The iterative exergoeconomic improvement methodology, or EIS approach, encompasses qualitative and
quantitative criteria to hierarchically classify the thermal system components, and to select subgroups of
decision variables to be modified for the components in the course of the procedure. The EIS approach
requires no user intervention, and consists of six steps, described in detail in Refs. [15, 16]: (i)
exergoeconomic analysis of the thermal system; (ii) analysis of the influence of the decision variables on
the system exergetic efficiency and on the system total cost; (iii) ranking of system components into
main, secondary, and remainder; (iv) identification of the predominant cost (exergy destruction or
investment) for main and secondary components; (v) selection of subgroups of decision variables; (vi)
mathematical optimization of main and secondary components.
A mathematical method modifies all n decision variables (x1, x2,…, xn) simultaneously, to obtain the
optimal values (x1*, x2*,…, xn*). In contrast, in the EIS approach, an exergoeconomic analysis of the
ISSN 2076-2895 (Print), ISSN 2076-2909 (Online) ©2011 International Energy & Environment Foundation. All rights reserved.
470
International Journal of Energy and Environment (IJEE), Volume 2, Issue 3, 2011, pp.463-476
system at the beginning of each iteration is performed. The analysis provides information to
hierarchically classify the components as main, secondary, and remainder, and to define main decision
variables subgroups associated with the main and secondary components. The subgroups may have
common decision variables, and their sizes may vary. Appropriate values for the parameters in the first
step are chosen, so that the size of a subgroup of decision variables is always less than n. After the
assembly of the subgroups, a mathematical optimization method is applied, first to those associated with
the main components, and then to those associated with the secondary components. This sequence is
repeated until no further improvement of the objective function is obtained, to within a user-prescribed
tolerance.
In contrast to the conventional mathematical strategy, because EIS performs a preceding exergoeconomic
analysis of the system, it will exclude some decision variables from the improvement process, when they
no longer affect the value of the objective function. In fact, the EIS approach always selects the more
important decision variables inside the improvement process, and these change as the system approaches
the optimum. Two distinct alternatives are developed for the choice of main decision variables for each
component. Alternative 1 uses modified structural bond coefficients, based on the cost of exergy
destruction and the total cost (investment plus exergy destruction costs) of component k, k = 1,…,NK.
Alternative 2 is based on the relative deviations between the actual and the optimal values of exergetic
efficiency and relative cost difference for each main and secondary component. In principle, any
mathematical optimization algorithm can be chosen to perform the optimizations along the iterations of
the EIS approach.
In practice, the integrated EIS procedure is coded in the VBA language. Excel macros are used to control
data exchange between the simulator and the VBA routine. The simulator is called by the VBA routine
each time a decision variable is modified, to compute all mass, energy, and exergy flow rates of the
system streams. To prevent execution failure due to errors caused by infeasible thermodynamic data
selected in the VBA routine, a penalty is applied whenever the simulator returns an error code. Total
computational time for any of the integrated approaches ends up proportional to the number of calls to
the simulator, NC, which is equal to the number of evaluations of the objective function. It is remarked
that no specific efforts have been expended in this study to accelerate the EIS approach, either by
optimizing user parameters values, or by employing advanced exergetic analysis [4].
8. Results and discussion
In this section the results of the exercises to optimize and improve the cogeneration plant CP-24 are
presented and analyzed. In one exercise, a solution of the optimization or improvement problem is
obtained starting from one specific set of initial values of the decision variables, with one chosen
mathematical technique, and one chosen Alternative (1 or 2) for the EIS approach. Two initial points
have been selected, X0,1 and X0,2, corresponding to Case 1 and Case 2, respectively, as shown in Table 3.
Also shown in Table 3 are the initial values of the objective function for each case. One notes that Case 2
corresponds to a higher initial objective function value. By testing with different initial points, first, the
likelihood of reaching the global minimum is increased [14], and, second, the robustness of the employed
procedure is evaluated.
8.1 Results obtained with the method of Powell
Table 4 presents the results obtained when Powell’s method is employed in the mathematical
optimization strategy and in Alternatives 1 and 2 of the exergoeconomic improvement approach. From
the results in Table 4 it is observed, first, that the three schemes are effective and robust, because plant
costs at the final points are significantly reduced relative to those at the respective initial points (about
10% reduction in Case 1, 15% in Case 2). With regard to the influence of the initial set of values of the
decision variables, one observes for each method that the results for Cases 1 and 2 are essentially
equivalent in terms of the final value of the objective function. However, the number of evaluations of
the objective function, NC (equal to the number of calls to the simulator), for EIS’ Alternatives 1 and 2
and for the mathematical optimization is, respectively, 29%, 82%, and 15% greater for Case 2 than for
Case 1. This verification is not surprising, since for Case 2 the initial value of OF is greater (by about
7%) than that for Case 1.
On further analysis of the results in Table 4, one notes that, when Powell’s method is applied to the CP24 problems, the mathematical optimization has an overall better performance than the exergoeconomic
improvement. The best value for OF and second to best value for NC are, respectively, 43.01 US$/MWh
ISSN 2076-2895 (Print), ISSN 2076-2909 (Online) ©2011 International Energy & Environment Foundation. All rights reserved.
International Journal of Energy and Environment (IJEE), Volume 2, Issue 3, 2011, pp.463-476
471
and 475, obtained with the mathematical optimization applied to Case 1. With the EIS approach, the final
values of the objective function are only about 4% higher. Alternative 2 leads to slightly higher objective
function values than Alternative 1, but at significantly lower computational costs. For Case 1, the value
of OF is only 0.1% higher for Alternative 2, however, NC is 37% smaller.
Comparing now the final values of the decision variables for the mathematical optimization with those
for the EIS method, an overall satisfactory agreement is obtained (see also section 8.3). It is possible to
observe larger differences for the extraction pressure of the steam turbine (S14.p variable). In the EIS
method, this variable is not modified (see Tables 3 and 4), because the exergoeconomic analyses in all
iterations indicate that this variable has a minor effect on the reduction of the objective function.
Table 3. Initial values of the decision variables and objective function for Cases 1 and 2
Variable symbol
GT01.kW (kW)
Case 1 Initial point X0,1
52800
Case 2 Initial point X0,2
70000
GT01a.kW (kW)
52800
70000
GT01.f
0.90
0.90
GT01a.f
0.90
0.90
S09.p (bar)
79.9
59.9
S14.p (bar)
3.0
2.0
S08.t (oC)
500.0
400.0
S08a.t (oC)
500.0
400.0
S16.p (bar)
0.08
0.08
Range ( C)
5.5
5.5
Approach (oC)
5.0
5.0
OF
(US$/MWh)
OF0,1
49.42
OF0,2
52.97
o
Table 4. Results obtained with the method of Powell
Decision variable EIS
Alternative 1
GT01.kW (kW) 40000
GT01a.kW (kW) 40000
Case 1
EIS
Alternative 2
40000
40200
Mathematical
optimization
40008
40000
EIS
Alternative 1
40000
40001
Case 2
EIS
Alternative 2
40001
40000
Mathematical
optimization
40094
40094
GT01.f
0.75
0.75
0.74
0.75
0.75
0.74
GT01a.f
S09.p (bar)
0.75
117.7
0.75
117.7
0.75
119.8
0.75
116.0
0.75
119.5
0.79
119.5
S14.p (bar)
3.0
3.0
10.0
2.0
2.0
10.0
500.0
500.0
0.08
9.3
3.4
500.0
500.0
0.08
9.1
3.6
519.0
519.0
0.08
9.9
3.1
518.8
518.8
0.08
9.2
3.4
518.8
514.0
0.08
9.0
3.6
520.8
518.8
0.08
10.0
2.6
OF (US$/MWh) 44.64
723
NC
44.68
455
43.01
475
44.71
930
44.83
828
43.16
547
o
S08.t ( C)
S08a.t (oC)
S16.p (bar)
Range (oC)
Approach (oC)
ISSN 2076-2895 (Print), ISSN 2076-2909 (Online) ©2011 International Energy & Environment Foundation. All rights reserved.
International Journal of Energy and Environment (IJEE), Volume 2, Issue 3, 2011, pp.463-476
472
8.2 Results obtained with the genetic algorithm
Table 5 presents the results obtained when the genetic algorithm is employed in the mathematical
optimization strategy and in Alternatives 1 and 2 of the exergoeconomic improvement approach. One
observes from Table 5 that the three schemes are robust, and that the mathematical optimization, again,
leads to lower values of the objective function than does the exergoeconomic improvement. However,
the relative difference between the smallest value of OF obtained with the EIS approach (Alternative 1,
Case 2) and that obtained with the mathematical optimization is only 3.2%. Furthermore, among the
schemes, Alternative 2 requires a much lower number of evaluations of the objective function. In fact for
Alternative 2, respectively for Cases 1 and 2, NC is 33% and 51% smaller than the values for the
mathematical optimization.
Table 5. Results obtained with the genetic algorithm
Decision
variable
Case 1
Case 2
EIS
EIS
Alternative 1 Alternative 2
Mathematical EIS
optimization Alternative 1
EIS
Alternative 2
Mathematical
optimization
GT01.kW
(kW)
GT01a.kW
(kW)
40601
40601
41407
41097
45493
41026
41097
41097
42162
41097
41097
42162
GT01.f
0.75
0.75
0.53
0.74
0.76
0.53
GT01a.f
S09.p (bar)
0.75
110.5
0.74
105.9
0.71
108.2
0.75
118.8
0.76
118.8
0.64
109.3
S14.p (bar)
3.0
3.0
9.4
2.0
2.0
9.1
500.0
500.0
0.08
9.1
500.0
500.0
0.08
9.1
519.9
522.2
0.08
9.3
515.4
502.4
0.08
9.5
516.2
516.3
0.08
9.1
505.3
522.2
0.08
9.8
5.0
2.7
3.9
3.1
5.0
2.6
44.98
43.46
44.85
45.29
43.52
2700
4000
6750
1950
4000
o
S08.t ( C)
S08a.t (oC)
S16.p (bar)
Range (oC)
Approach
(oC)
OF
44.98
(US$/MWh)
NC
5400
As regards the final values of the decision variables, one observes the same tendencies with respect to the
initial values as the ones verified with Powell’s method (see also section 8.3). However, larger
discrepancies among the variables are obtained with the use of the genetic algorithm applied to the CP24 problems. Again, the larger differences occur in the extraction pressure of the steam turbine, because
this variable is not modified in the EIS approach. In spite of all discrepancies, the final values of the
objective function are essentially equivalent for engineering purposes (less than 5% spread). This reality
is further evidence of the difficulty to achieve a unique set of final values of the decision variables and
objective function in the optimization or improvement of complex thermal systems [16, 19].
8.3 Comparative analysis of results
Tables 6 and 7 show, respectively for Cases 1 and 2 of the CP-24 problems, the present results obtained
using Powell’s method and the genetic algorithm together with the results obtained by Vieira et al. [16,
19] using the flexible polyhedron method by Nelder and Mead. A global analysis of Tables 6 and 7
reveals an important outcome: the method of Powell systematically leads to the smallest values of the
objective function and of the number of simulator calls for all the investigated CP-24 scenarios.
Regarding the integrated mathematical optimization strategy, the number of evaluations of the objective
function for the flexible polyhedron method is 3.6 to 8.5 times greater than that for the method of Powell.
Also, for the genetic algorithm, NC is about 8 times greater than that for the method of Powell. While
Powell’s scheme and the genetic algorithm essentially agree in the final values of OF, the average 7%
ISSN 2076-2895 (Print), ISSN 2076-2909 (Online) ©2011 International Energy & Environment Foundation. All rights reserved.
International Journal of Energy and Environment (IJEE), Volume 2, Issue 3, 2011, pp.463-476
473
difference for the flexible polyhedron method appears consistent with the more significant discrepancies
among the corresponding final values of the decision variables.
With the EIS approach, the final values obtained for OF are approximately equal, with discrepancies
below 1.5%. Across all optimization techniques, relatively low discrepancies are also obtained among
the final values of the decision variables. The method of Powell is 2 to 3 times faster than the flexible
polyhedron method, and 6 to 7 times faster than the genetic algorithm. While Alternative 1 leads to
smaller values of OF for all methods (except in Case 2, by a slim margin, with the flexible polyhedron
method), Alternative 2 is consistently faster; in fact, the overall fastest performance occurs with Powell’s
method used in Alternative 2 applied to Case 1.
Despite some discrepancies verified in the final values of the decision variables, all schemes perform
robustly: in all cases, they considerably reduce the value of the objective function, and they lead to the
same global behavior of the plant CP-24. In fact, the gas turbines sizes and loads are reduced, while the
operating pressures and temperatures of the HRSGs are increased [16, 19]. The condenser pressure is
seen to be unimportant. The cooling tower range is increased, but the approach is reduced. Finally, as
already pointed out, distinct treatments are given to the extraction pressure of the steam turbine by the
mathematical and EIS approaches.
It is interesting to note that, contrary to what is observed with the flexible polyhedron method, the
mathematical optimization with either the Powell’s method or the genetic algorithm attains a lower value
of the objective function, and sometimes at lower computational costs, compared to Alternatives 1 and 2
of the EIS approach. The differences encountered may be attributed in part to the fact that the
improvement process does not modify appreciably some decision variables, because the associated
exergoeconomic analyses indicate that they will have relatively little impact on the objective function.
This is in accordance with the EIS philosophy, which does not aspire to obtain the mathematical
optimum of the system. It must also be noted that the values of the parameters used in the improvement
exercises are the same as those used originally by Vieira et al. [16, 19] with the flexible polyhedron
method. No attempt has been made in this study to accelerate the EIS’ performance, either by optimizing
parameters values, or by employing advanced exergetic analysis.
Table 6. Results obtained in this work and in Refs. [16,19] for Case 1 of the optimization and
improvement problems for system CP-24
Decision
variable
GT01.kW
(kW)
GT01a.kW
(kW)
GT01.f
GT01a.f
S09.p (bar)
S14.p (bar)
S08.t (oC)
S08a.t (oC)
S16.p (bar)
Range (oC)
Approach
(oC)
EIS, Alternative 1
Ref. [16] Powell
Genetic
Case 1
EIS, Alternative 2
Ref. [16] Powell
40001
40000
40601
40001
40000
40601
40001
40008
41407
40001
40000
41097
40001
40200
41097
40157
40000
42162
0.75
0.75
120.0
3.0
500.0
500.0
0.08
7.7
0.75
0.75
117.7
3.0
500.0
500.0
0.08
9.3
0.75
0.75
110.5
3.0
500.0
500.0
0.08
9.1
0.75
0.75
120.0
3.0
500.0
500.0
0.08
8.9
0.75
0.75
117.7
3.0
500.0
500.0
0.08
9.1
0.75
0.74
105.9
3.0
500.0
500.0
0.08
9.1
0.75
0.75
76.3
6.3
496.1
505.9
0.17
6.1
0.74
0.75
119.8
10.0
519.0
519.0
0.08
9.9
0.53
0.71
108.2
9.4
519.9
522.2
0.08
9.3
5.0
3.4
5.0
5.0
3.6
2.7
5.6
3.1
3.9
44.64
44.98
44.73
44.68
44.98
45.80
43.01
43.46
723
5400
1241
455
2700
1700
475
4000
OF
44.97
(US$/MWh)
1796
NC
Mathematical optimization
Genetic Ref. [19] Powell Genetic
ISSN 2076-2895 (Print), ISSN 2076-2909 (Online) ©2011 International Energy & Environment Foundation. All rights reserved.
International Journal of Energy and Environment (IJEE), Volume 2, Issue 3, 2011, pp.463-476
474
Table 7. Results obtained in this work and in Refs. [16, 19] for Case 2 of the optimization and
improvement problems for system CP-24
Decision
variable
GT01.kW
(kW)
GT01a.kW
(kW)
GT01.f
GT01a.f
S09.p (bar)
S14.p (bar)
S08.t (oC)
S08a.t (oC)
S16.p (bar)
Range (oC)
Approach
(oC)
Genetic
Case 2
EIS, Alternative 2
Ref. [16] Powell
Genetic
Mathematical optimization
Ref. [19] Powell Genetic
40000
41097
40001
40001
45493
42261
40094
41026
40001
40001
41097
40001
40000
41097
40337
40094
42162
0.75
0.75
120.0
2.0
521.0
502.6
0.08
9.1
0.75
0.75
116.0
2.0
518.8
518.8
0.08
9.2
0.74
0.75
118.8
2.0
515.4
502.4
0.08
9.5
0.74
0.74
106.3
2.0
522.0
521.5
0.08
9.2
0.75
0.75
119.5
2.0
518.8
514.0
0.08
9.0
0.76
0.76
118.8
2.0
516.2
516.3
0.08
9.1
0.85
0.79
70.1
6.6
489.1
475.6
0.21
7.5
0.74
0.79
119.5
10.0
520.8
518.8
0.08
10.0
0.53
0.64
109.3
9.1
505.3
522.2
0.08
9.8
3.6
3.4
3.1
4.2
3.6
5.0
6.0
2.6
2.6
44.71
44.85
44.88
44.83
45.29
46.32
43.16
43.52
930
6750
2365
828
1950
4654
547
4000
EIS, Alternative 1
Ref. [16] Powell
40001
OF
44.73
(US$/MWh)
2985
NC
9. Conclusions
Integrated mathematical optimization and exergoeconomic improvement of a complex energy system
modeled in a professional thermodynamic process simulator has been successfully carried out, using the
direct search method of Powell and a genetic algorithm. In the optimization and improvement exercises,
the method of Powell attained the best performance when compared to both the genetic algorithm and the
flexible polyhedron method. Both the integrated tool and its evaluation are important, in view of the
growing concern with the efficient design and operation of energy systems. Additionally, in the present
study, Alternatives 1 and 2 of the EIS exergoeconomic improvement approach did not perform better
than the mathematical optimization with Powell’s and genetic methods, as opposed to what was observed
when the flexible polyhedron method had been used. Still, the EIS approach has performed both robustly
and efficiently, and it should thus be useful in exergoeconomic applications by the energy community at
large. As indications for future research, the EIS approach may be further improved by optimization of
parameters values, and/or by employment of advanced exergetic analysis.
Acknowledgements
M. E. Cruz gratefully acknowledges the financial support from CNPq (Grants PQ-302725/2009-1 and
470306/2010-6). The authors would also like to thank Eng. Toseli Matos for his assistance with the
figures.
References
[1] Selbaş R., Yazıcı H., Şencan A. Thermoeconomic Optimization of the Steam Power Plant. Int. J.
Energy Environ. 2010, 1(3), 479-486.
[2] Sayyaadi H. Multi-objective approach in thermoenvironomic optimization of a benchmark
cogeneration system. Appl. Energ. 2009, 86(6), 867-879.
[3] Kanoglu M., Dincer I. Performance assessment of cogeneration plants. Energ. Convers. Manage.
2009, 50(1), 76-81.
[4] Kelly S., Tsatsaronis G., Morosuk T. Advanced exergetic analysis: Approaches for splitting the
exergy destruction into endogenous and exogenous parts. Energy 2009, 34(3), 384-391.
[5] Tsatsaronis G. Recent developments in exergy analysis and exergoeconomics. Int. J. Exergy 2008,
5(5-6), 489-499.
[6] Sahoo P.K. Exergoeconomic analysis and optimization of a cogeneration system using
evolutionary programming. Appl. Therm. Eng. 2008, 28(13), 1580-1588.
ISSN 2076-2895 (Print), ISSN 2076-2909 (Online) ©2011 International Energy & Environment Foundation. All rights reserved.
International Journal of Energy and Environment (IJEE), Volume 2, Issue 3, 2011, pp.463-476
[7]
[8]
[9]
[10]
[11]
[12]
[13]
[14]
[15]
[16]
[17]
[18]
[19]
[20]
[21]
[22]
[23]
[24]
[25]
475
Valero A. Exergy accounting: Capabilities and drawbacks. Energy 2006, 31(1), 164-180.
Giannantoni C., Lazzaretto A., Macor A., Mirandola A., Stoppato A., Tonon S., Ulgiati S.
Multicriteria approach for the improvement of energy systems design. Energy 2005, 30(10), 19892016.
Rosen M.A., Dincer I. Exergy-cost-energy-mass analysis of thermal systems and processes. Energ.
Convers. Manage. 2003, 44(10), 1633-1651.
Himmelblau D.M. Applied Nonlinear Programming. McGraw-Hill: New York, 1972.
Holland J.H. Adaptation in Natural and Artificial Systems. The University of Michigan Press: Ann
Arbor, 1975.
Okamoto M., Nonaka T., Ochiai S., Tominaga D. Nonlinear numerical optimization with use of a
hybrid Genetic Algorithm incorporating the Modified Powell method. Appl. Math. Comput. 1998,
91(1), 63-72.
Gen M., Cheng R. Genetic Algorithms and Engineering Optimization. John Wiley & Sons: New
York, 2000.
Frangopoulos C.A. Methods of Energy Systems Optimization. OPTI_Energy Summer School:
Gliwice, Poland, 2003.
Vieira L.S., Donatelli J.L., Cruz M.E. Integration of an Iterative Methodology for Exergoeconomic
Improvement of Thermal Systems with a Process Simulator. Energ. Convers. Manage. 2004,
45(15-16), 2495-2523.
Vieira L.S., Donatelli J.L., Cruz M.E. Exergoeconomic Improvement of a Complex Cogeneration
System Integrated with a Professional Process Simulator. Energ. Convers. Manage. 2009, 50(8),
1955-1967.
Vieira L.S., Cruz M.E. A General Approach for Exergoeconomic Improvement of Thermal
Systems: Application to Complex Cogeneration Plants. Proceedings of the 22nd International
Conference on Efficiency, Cost, Optimisation, Simulation and Environmental Impact of Energy
Systems (ECOS). Paper 03.02, 301-310. Foz do Iguaỗu, Brazil, 2009.
Simtech. IPSEpro User Documentation – Version 3.1. Simtech Simulations Technology: Austria,
2000.
Vieira L.S., Donatelli J.L., Cruz M.E. Mathematical exergoeconomic optimization of a complex
cogeneration plant aided by a professional process simulator. Appl. Therm. Eng. 2006, 26(5-6),
654-662.
Bejan A., Tsatsaronis G., Moran M. Thermal Design and Optimization. John Wiley & Sons: New
York, 1996.
Jaluria Y. Design and Optimization of Thermal Systems, 2nd ed. CRC Press, Taylor & Francis
Group: Boca Raton, FL, 2008.
Cordeiro A.S. Optimization and Exergoeconomic Improvement of Thermal Systems Modeled in a
Process Simulator Using Direct Search and Stochastic Methods. M.Sc. Dissertation (in
Portuguese), UFRJ/COPPE/PEM: Rio de Janeiro, Brazil, 2007.
Mothci G.E., Vieira L.S., Cruz M.E. Integration of a Thermodynamic Process Simulator with
Genetic Operators for Mathematical Exergoeconomic Optimization of Thermal Systems.
Proceedings of the 18th International Congress of Mechanical Engineering of ABCM (COBEM).
Paper 1575. Ouro Preto, Brazil, 2005.
Vieira L.S., Donatelli J.L., Cruz M.E. Integration of a Mathematical Exergoeconomic
Optimization Procedure with a Process Simulator: Application to the CGAM System. Therm. Eng.
– RETERM 2005, 4(2), 163-172.
Tsatsaronis G. (guest editor). Special Issue, Invited Papers on Exergoeconomics. Energy, The Int. J.
1994, 19(3), 279-381.
ISSN 2076-2895 (Print), ISSN 2076-2909 (Online) ©2011 International Energy & Environment Foundation. All rights reserved.
476
International Journal of Energy and Environment (IJEE), Volume 2, Issue 3, 2011, pp.463-476
Alexandre S. Cordeiro received his Bachelor’s Degree and M.Sc. Degree in mechanical engineering
from the Federal University of Rio de Janeiro (UFRJ), Brazil, in the years 2004 and 2007, respectively.
Eng. Cordeiro currently works as an engineer in the division E&P-ENGP/IPP/ES of Brazilian Petroleum
– Petrobras (Av. Republica do Chile 330, 7o. andar, Centro, Rio de Janeiro, RJ, 20031-170, Brazil).
E-mail address:
Leonardo S. Vieira received his Bachelor’s Degree in mechanical and automotive engineering from the
Military Institute of Engineering (IME-RJ), Brazil, in 1984. Later, in Rio de Janeiro, Brazil, he graduated
with an M.Sc. Degree from PUC-RJ in 1991, and with a D.Sc. Degree from UFRJ in 2003, both in
mechanical engineering. He has published more than 15 articles in well-recognized journals, books, and
proceedings. His main research interests are optimization of thermal systems and exergoeconomics. Dr.
Vieira currently works as an Advanced Researcher at the Electrical Energy Research Center – CEPEL.
E-mail address:
Manuel E. Cruz received his Bachelor’s Degree and M.Sc. Degree in mechanical engineering from the
Federal University of Rio de Janeiro (UFRJ), Brazil, in the years 1984 and 1988, respectively, and
graduated with a Ph.D. Degree in mechanical engineering from MIT, U.S.A., in 1993. He has published
more than 60 articles in well-recognized journals, books, and proceedings. His main research interests
are thermoeconomic optimization of thermal systems and transport phenomena in multicomponent
media. Prof. Cruz teaches undergraduate and graduate Thermodynamics in the Department of
Mechanical Engineering at UFRJ. He is a member of the Brazilian Society of Mechanical Sciences and
Engineering (ABCM) and of the American Institute of Aeronautics and Astronautics (AIAA).
E-mail address:
ISSN 2076-2895 (Print), ISSN 2076-2909 (Online) ©2011 International Energy & Environment Foundation. All rights reserved.