Intermediate accounting by robles empleo ch 7 answers
Bạn đang xem bản rút gọn của tài liệu. Xem và tải ngay bản đầy đủ của tài liệu tại đây (97.31 KB, 18 trang )
Chapter 7 – Investments in Equity Securities and Debt Securities
CHAPTER 7
INVESTMENTS IN EQUITY SECURITIES AND DEBT SECURITIES
PROBLEMS
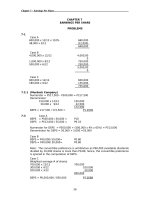
7-1
(Dusit, Inc.)
Classified as available for sale securities
a.
Purchase price
(10,000 shares x P33.50)
P335,000
Broker’s commission
Total cost
b.
Purchase price
(7,000 shares x P26.50)
P185,500.00
Broker’s commission
Transfer taxes (¼ x 1% x 185,500)
Total cost
c.
P58,000
1,500
45,000
P44,625
4,910.00
463.75
P190,873.75
Purchase price
Transfer fees and other costs
Total cost to be allocated
P59,500
Market values:
Ordinary shares 150 x 100
Preference shares
300 x 150
P15,000
Total
P14,875
1,980
P336,980
Allocation to:
Ordinary shares
P60,000
59,500 x 15/60
Preference shares 59,500 x 45/60
d.
Market value of ordinary shares
2,000 shares x P200
P400,000
Classified as Trading Securities
a.
Purchase price
(10,000 shares x P33.50)
P335,000
b.
Purchase price (7,000 shares x P26.50)
P185,500
c.
14,500
43,500
d.
Allocation to Ordinary Shares
58,000 x 15/60
P
Allocation to Preference Shares
58,000 x 45/60
P
Market value of ordinary shares
47
Chapter 7 – Investments in Equity Securities and Debt Securities
2,000 shares x P200
P400,000
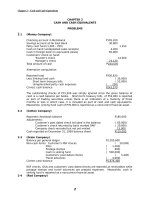
7-2
(A Company)
a.
Cash
Dividend Revenue
2,400 shares x 7.50
Cost per share:
B Corp. Ordinary (no change)
b.
c.
18,000
18,000
P100
Memo entry.
Received additional 600 shares of B Corp. ordinary
shares as stock dividends.
Revised cost per share:
B Corp. Ordinary (3,000 shares)
Available for Sale Securities-B Corp. Preference 80,000
Available for Sale Securities-B Corp. Ordinary
80,000
Market values:
Allocation:
80,000
Ordinary
(2,400 x 125) 300,000
Preference (600 x 250) 150,000
Ordinary
240,000 x 300/450
160,000
Preference
240,000 x 150/450
Costs per share:
B Corp. Ordinary (2,400 shares)
B Corp. Preference (600 shares)
d.
P 80
P 67
P133
Memo entry. Received additional shares of B Corp. ordinary shares on
a 4-for-1 stock split.
Revised cost per share:
B Corp. Ordinary = P240,000/9,600 shares
P 25
e.
Available for Sale Securities-C Ordinary
Dividend Revenue
2,400/6 = 400 shares x 50
20,000
20,000
Costs per share:
B Corp. Common (2,400 shares)
C Corp. Common (400 shares)
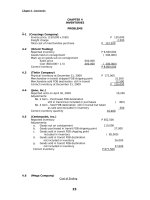
7-3
10,000
(Victoria Court)
Classified as FVPL
Cash
Gain on Sale of Trading Securities
P100
P 50
170,000
Trading Securities
160,000
To record sale of Y Co. Common
Unrealized Loss on Trading Securities
Trading Securities
To record valuation at end of year.
72,000
72,000
Unrealized Holding
48
Chapter 7 – Investments in Equity Securities and Debt Securities
X Co.
Z Co.
Total
MV12/31/08
P330,000
350,000
P680,000
Market12/31/09
P288,000
320,000
P608,000
Classified as available for sale securities
Cash
Loss on Sale of Available for Sale Securities
Market Adjustment-AFS Securities
Available for Sale Securities
Net Unrealized Gain/Loss on AFS Securities
40,000
Gains(Losses)
P(42,000)
(30,000)
P(72,000)
170,000
40,000
30,000
200,000
To record sale of Y Co. Common
Net Unrealized Gain/Loss on AFS Securities
Market Adjustment-AFS Securities
72,000
72,000
To record valuation at end of year.
Unrealized Holding
Gains(Losses)
P(42,000)
20,000
Cost
Market
X Co.
P330,000
P288,000
Z Co.
300,000
320,000
Total
P630,000
P608,000
Required balance in Market Adjustment Account –
cr
Balance before adjustment (10,000 + 40,000) – dr
Required adjustment
P(22,000)
50,000
P 72,000
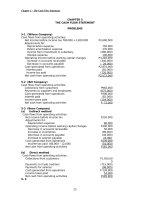
7-4
(Inn Corporation)
(1)
Sales price (15,000 x 60
)
P900,000
Cost of shares sold:
12,000 shares
P650,000
3,000 shares (1,300,000 x 3,000/24,000)
162,500
812,500
Gain on sale
P 87,500
(2)
Sales price
Cost of shares sold (1,800,000 x 15,000/36,000)
Gain on sale
(3)
Sales price
P900,000
Cost of shares sold:
12,000 shares
P500,000
3,000 shares (1,300,000 x 3,000/24,000)
162,500
662,500
P900,000
750,000
P150,000
Gain on sale
7-5
P237,500
(Melody Corporation)
a.
2007 Lot (4 x 750)
2008 Lot (4 x 1,250)
Total cost of stock rights received
b.
Cost of stock rights exercised:
2005 Lot
49
P 3,000
5,000
P 8,000
P 3,000
Chapter 7 – Investments in Equity Securities and Debt Securities
2006 Lot (750 x 4)
6,000
2,250
3,000
Cash paid (300 shares x P80)
Total cost of new shares acquired thru stock rights
Cost per share (8,400 / 300 shares)
P
c.
24,000
P30,000
100
Sales price of stock rights (500 x 4.50)
P
Cost of stock rights sold
2008 Lot (500 x 4)
Gain on sale
d.
225,400
50,000
P
2,000
250
Available for sale securities balance at December 31, 2009:
2007 Lot (60,000 – 3,000)
P 57,000
2008 Lot (110,000 – 5,000)
105,000
2009 Lot
30,000
P192,900
Market value at December 31, 2009 (98 x 2,300 shares)
Balance in unrealized gain/loss account at December 31, 2009
32,500
7-6
P
(Anti Corporation)
a.
Stock Rights – Pro Corp. Ordinary
Trading Securities – Pro Corp. Ordinary
10,000 x 5
b.
Cash
Stock Rights – Pro Corp. Ordinary
c.
50,000
50,000
P
50,000
50,000
Trading Securities – Pro Corp. Ordinary
Stock Rights – Pro Corp. Ordinary
Cash
10,000/5 = 2,000 shares
2,000 x 50 = 100,000
150,000
100,000
Trading Securities – Pro Corp. Ordinary
Unrealized Gain on Trading Securities
140,000
140,000
900,000
Market value, 12/31/06
(12,000 shares x 75)
Carrying value, 12/31/07 (10,000 shares x 66) 660,000
Cost of stock rights received
( 50,000)
Cost of new shares from exercise
150,000 760,000
Unrealized gain
140,000
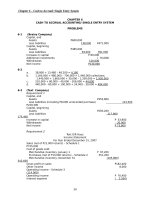
7-7
(EDSA Company)
(a)
1.
150 – 135
2+1
=
50
P5.00
Chapter 7 – Investments in Equity Securities and Debt Securities
(b)
2.
3.
2,000 x 5
5,500 – (1,000 x 5)
1.
145 – 135
2
2,000 x 5
2.
7-8
=
=
P10,000
P500 Gain
=
P5.00
=
P10,000
(Tolits Corporation)
2009
a.
Available for Sale Securities – Diana
Ordinary
Cash
b.
Memorandum entry. Received 500
additional shares of Diana ordinary shares
as a result of 2-for-1 split.
c.
Available for Sale Securities – Smith
Preference
Cash
(1,000 x 120) + 1,200
d.
e.
f.
f.
g.
54,000
54,000
121,200
121,200
Cash
Gain on Sale of AFS Securities
Available for Sale Securities – Diana
Ordinary
(54,000 / 1,000) x 250 shares =
13,500
15,000
Stock Rights – Diana Ordinary
Available for Sale Securities – Diana
Ordinary
750 shares x 3
2,250
Available for Sale Securities – Diana
Ordinary
Stock Rights – Diana Ordinary
Cash
(60% x 750) x 3; 225 x 55
Cash
Stock Rights – Diana Ordinary
(40% x 750) x 3
1,500
13,500
2,250
13,725
1,350
12,375
900
Cash (100 x 56)
Loss on sale of AFS Securities
Available for Sale Securities – Diana
Ordinary
13,725/ 225 = 61; 61 x 100 = 6,100
5,600
500
h.
Cash (1,000 x 100 x 8%)
Dividend Revenue
8,000
i.
Market Adjustment – AFS Securities
Unrealized Gains/Losses on AFS
Securities
2,175
Market
51
Unreal
900
6,100
8,000
2,175
Chapter 7 – Investments in Equity Securities and Debt Securities
CV
Diana 1 (750 sh)
46,500 38,250
Diana 2 (125 sh)
7,750
7,625
Smith (1,000 x 115)
115,000
121,200
Total
169,250
167,075
b.
P9,000
7-9
Gain on sale of AFS Securities
Loss on sale of AFS Securities
( 500)
Dividend revenue
Total income recognized in profit or loss in 2006
8,250
125
(6,200)
2,175
P1,500
8,000
(X Corporation)
2008
Jan.
1
Dec. 31
Available for Sale Securities – Y Co. Ordinary
Cash
300,000
Net Unrealized Gains/Losses on AFS
Securities
Market Adjustment – AFS Securities
5,000 x (60 – 55)
25,000
Market Adjustment – AFS Securities
Impairment Loss – AFS Securities
Net Unrealized Gains/Losses on AFS
Securities
Available for Sale Securities – Y Co.
Ordinary
5,000 x (60-52)
25,000
40,000
300,000
25,000
2009
Dec. 31
7-10
25,000
40,000
(Carlo Company)
2009
Apr. 1
May 15
Cash (5,000 x 25)
Loss on Sale of Trading Securities
Trading Securities – Avi Ordinary
Available for Sale Securities – Ghio
Preference
Cash
July 10
Memorandum entry. Received 4,000
additional Darrel ordinary shares
representing a 20% bonus issue. Shares
now held are 24,000.
Nov. 30
Cash (1 x 24,000)
Dividend Revenue
Unrealized Loss on Trading Securities
Trading Securities – Avi Ordinary
(5,000 x 26) – 139,000
Dec. 31
31
Market Adjustment – AFS Securities
Net Unrealized Gains/Losses on AFS
52
125,000
14,000
139,000
30,550
30,550
24,000
9,000
24,000
9,000
110,650
110,650
Chapter 7 – Investments in Equity Securities and Debt Securities
Securities
116,650 – 6,000 balance
FV
Unrealized
Darrel 480,000
116,000
Ghio
31,200
650
Total
511,200
116,650
7-11
Cost
364,000
30,550
394,550
(Hostel Company)
(a)
1.
Investment in Associates
Cash
2.
2,000,000
300,000
300,000
3.
Memo. Received 2,000 additional shares
of Atlanta ordinary as 10% bonus issue.
Shares now held are 22,000.
4.
Investment in Associates
Income from Associates
20% x 3,000,000
600,000
Cash
Investment in Associates
20% x 1,000,000
200,000
5.
(b)
Investment in Associates
Income from Associates
20% x 1,500,000
2,000,000
600,000
Investment cost
P2,000,00
0
300,000
600,000
(200,000)
P2,700,00
Share in income – 2009
Share in income – 2010
Share in dividends
Carrying amount, December 31, 2010
7-12
200,000
(Byron, Inc.)
2009
Jan.
1
Dec. 31
31
7-13
Investment in Associates – Pirates
Ordinary
Cash
5,160,000
Investment in Associates – Pirates
Ordinary
Income from Associates (30% x
3,600,000)
1,080,000
Cash (30% x 400,000)
Investment in Associates – Pirates
Ordinary
(Barbie, Inc.)
(a).
53
5,160,000
1,080,000
120,000
120,000
Chapter 7 – Investments in Equity Securities and Debt Securities
2009
Mar. 1
Dec. 31
31
31
Investment in Associates – Kitchie
Cash
Cash (30% x 800,000)
Investment in Associates – Kitchie
Investment in Associates – Kitchie
Income from Associates
(3.2M x 10/12) x 30%
Income from Associates – Kitchie
Investment in Associates – Kitchie
1,365,000
240,000
1,365,000
240,000
800,000
800,000
37,500
(30% x 750,000) / 5 yrs. = 45,000
45,000 x 10/12 = 37,500
37,500
(b)
Acquisition cost, March 1, 2009
P1,365,000
Cash dividends received
( 240,000)
Income from associates
800,000
Adjustment in reported income
( 37,500)
Investment carrying value, December 31, 2009
P1,887,500
Income reported by Barbie from its investment in associates:
(800,000 – 37,500)
P
762,500
7-14
(Richmonde Corporation)
(a)
2008
Jan.
1
Dec. 31
31
Available for Sale Securities – Pen, Inc.
Cash
900,000
Cash
Dividend Revenue
10% x 2,000,000
200,000
Market Adjustment – AFS Securities
Net Unrealized Gains/Losses on AFS
Securities
480,000
900,000
200,000
480,000
2009
Jan.
1
Investment in Associates – Pen, Inc.
Net Unrealized Gains/Losses on AFS
Securities
Market Adjustment – AFS Securities
Retained Earnings
Available for Sale Securities – Pen, Inc.
Acquisition cost
900,000
Share in income (10% x 6M)
600,000
Share in dividends (10% x 2M)
54
1,300,00
0
480,000
480,000
400,000
900,000
Chapter 7 – Investments in Equity Securities and Debt Securities
(200,000)
Carrying amount, 12/31/05
1,300,000
1
Investment in Associates – Pen, Inc.
2,600,00
0
Cash
Dec. 31
Investment in Associates – Pen, Inc.
1,950,00
0
Income from Associates (30% x
6,500,000)
31
(b)
Cash
Investment in Associates (30% x
3,000,000)
900,000
Cost transferred from Available for Sale Securities
1,950,00
0
900,000
1,300,00
0
2,400,000
1,950,000
(900,000)
4,750,000
Additional investment
Share in income
Share in dividends
Carrying amount, December 31, 2009
7-15
2,600,00
0
(E Corporation)
(a)
2008
Jan.
1
Investment in Associates – F Company
8,250,00
0
Cash (50,000 x 165)
8,250,00
0
Aug. 1
Cash
Investment in Associates – F Company
210,000
Dec. 31
Investment in Associates – F Company
Income from Associates
170,000
Cash
Investment in Associates – F Company
210,000
Investment in Associates – F Company
Income from Associates – F Company
250,000
25% x 680,000
210,000
170,000
2009
Dec. 31
31
25% x 1,000,000
210,000
250,000
2010
Jan. 2
Cash (20,000 x 170)
3,400,00
0
Investment in Associates – F Company
Gain on Sale of Investment in Associates
Acquisition cost
Share in income (2006)
Share in dividends (2006)
Share in dividends (2007)
Share income (2007)
55
8,250,000
170,000
(210,000)
(210,000)
250,000
3,300,00
0
100,000
Chapter 7 – Investments in Equity Securities and Debt Securities
Investment carrying amount
Portion sold
Cost of investment sold
2
8,250,000
40%
3,300,000
Available for Sale Securities – F Company
Investment in Associates – F Company
4,950,00
0
4,950,00
0
8,250,000 – 3,300,000
Dec. 31
31
Cash
Dividend Revenue
120,000
Market Adjustment-AFS Securities
Net Unrealized Gains/Losses on AFS
Securities
750,000
120,000
750,000
(30,000 x 190) - 4,950,000 = 750,000
(b).
Cost/Carrying Value, beg of year
2008
P8,250,000
2009
P8,210,000
2010
P8,250,000
Income from associates
Cash dividends received
Sale of shares
Market adjustment
Carrying value, end of year
170,000
(210,000)
250,000
(210,000)
(3,300,000)
750,000
P8,210,000
P8,250,000
P5,700,000
7-16
1.
2.
3.
4.
5.
6.
7.
8.
9.
10.
11.
12.
13.
14.
15.
7-17
A and B
A
B and C
A and B
B
C
C
A
B
A, B and C
C
A
B
A
C
(Abu Company)
(a)
Date
01/01/07
12/31/07
12/31/08
12/31/09
12/31/10
12/31/11
Interest
Received
Interest Revenue
Premium
Amortization
Carrying Value
1,200,000
1,200,000
1,200,000
1,200,000
1,200,000
1,158,450
1,152,633
1,146,002
1,138,442
1,129,827*
41,550
47,367
53,998
61,558
70,173*
8,274,646
8,233,096
8,185,729
8,131,731
8,070,173
8,000,000
*rounded off.
(b)
56
Chapter 7 – Investments in Equity Securities and Debt Securities
2007
Jan.
1
Dec. 31
Held to Maturity Securities
Cash
8,274,646
Cash
Held to Maturity Securities
Interest Revenue
1,200,000
Cash
Held to Maturity Securities
Interest Revenue
1,200,000
8,274,646
41,550
1,158,450
2008
Dec. 31
7-18
47,367
1,152,633
(South Company)
a. Journal entries in 2006 and 2007
(1) Securities are classified as financial assets at fair value through
profit and loss.
2008
June 1
Dec. 1
Trading Securities – State Corp. Bonds
Cash
3,691,500
Cash
Interest Revenue (4M x 8% x ½)
3,691,500
160,000
160,000
31
Interest Receivable
Interest Revenue (4M x 8% x 1/12)
26,667
31
Trading Securities – State Corp. Bonds
Unrealized Gain on Trading
Securities
188,500
26,667
188,500
4M x 0.97 = 3,880,000
3,880,000 – 3,691,500 = 188,500
2009
Jan. 1
Interest Receivable
Interest Revenue
26,667
June 1
Cash
Interest Revenue
160,000
Dec. 1
Cash
Interest Revenue
160,000
31
Interest Receivable
Interest Revenue
26,667
Trading Securities – State Corp. Bonds
Unrealized Gain on Trading
Securities
80,000
Dec. 31
26,667
160,000
160,000
26,667
80,000
4M x 0.99 = 3,960,000
3,960,000 – 3.880,000 = 80,000
(3) Securities are classified as held-to-maturity securities.
To facilitate computation, a partial amortization table is presented below.
Interest
Interest
Amortization
HTM
Date
Received
Revenue
of Discount
Carrying Value
June
1,
2008
Dec 1, 2008
3,691,500
160,000
184,575
57
24,575
3,716,075
Chapter 7 – Investments in Equity Securities and Debt Securities
June
2009
Dec.
2009
June
2010
Dec.
2010
June
2011
Dec.
2011
1,
160,000
185,804
25,804
3,741,879
1,
160,000
187,094
27,094
3,768,973
1,
160,000
188,449
28,449
3,797,422
1,
160,000
189,871
29,871
3,827,293
1,
160,000
191,365
31,365
3,858,658
1,
160,000
192,933
32,933
3,891,591
2008
June 1
Dec. 1
31
Held to Maturity Securities – State Corp.
Bonds
Cash
3,691,50
0
Cash
Held to Maturity Securities – State Corp.
Bonds
Interest Revenue (see above table)
160,000
24,575
Interest Receivable
Held to Maturity Securities – State Corp.
Bonds
Interest Revenue
26,667
4,301
Interest Revenue
Interest Receivable
Held to Maturity Securities – State Corp.
Bonds
30,968
3,691,500
184,575
30,968
160,000 x 1/6 = 26,667; 25,804 x 1/6 =
4,301
2009
Jan. 1
June 1
Dec. 1
31
26,667
4,301
Cash
Held to Maturity Securities – State Corp.
Bonds
Interest Revenue(see above table)
160,000
25,804
Cash
Held to Maturity Securities – State Corp.
Bonds
Interest Revenue (see above table)
160,000
27,094
Interest Receivable
Held to Maturity Securities – State Corp.
Bonds
Interest Revenue
26,667
4,742
185,804
160,000 x 1/6 = 26,667; 28,449 x 1/6=
187,094
31,409
4,742
(3) Securities are classified as available for sale securities.
To facilitate computation, a partial amortization table is presented below.
Date
Interest
Received
Interest
Revenue
58
Amortization
of Discount
HTM
Carrying Value
Chapter 7 – Investments in Equity Securities and Debt Securities
June
1,
2008
Dec 1, 2008
June
1,
2009
Dec.
1,
2009
June
1,
2010
Dec.
1,
2010
June
1,
2011
Dec.
1,
2011
3,691,500
160,000
160,000
184,575
185,804
24,575
25,804
3,716,075
3,741,879
160,000
187,094
27,094
3,768,973
160,000
188,449
28,449
3,797,422
160,000
189,871
29,871
3,827,293
160,000
191,365
31,365
3,858,658
160,000
192,933
32,933
3,891,591
2008
June 1
Dec. 1
31
31
Available for Sale Securities – State Corp.
Bonds
Cash
Cash
Available for Sale – State Corp. Bonds
Interest Revenue (see above table)
Interest Receivable
Available for Sale Securities – State Corp.
Bonds
Interest Revenue
160,000 x 1/6 = 26,667
25,804 x 1/6 = 4,301
Market Adjustment – AFS Securities
Net Unrealized Gain/Loss on AFS
Securities
3,691,500
3,691,500
160,000
24,575
184,575
26,667
4,301
30,968
159,624
159,624
4M x 0.97 =
3,880,000
Amortized cost
3,691,500+ 24,575 + 4,301 =
3,720,376
Market Adjustment
P 159,624
2009
Jan. 1
Interest Revenue
Interest Receivable
Available for Sale Securities – State Corp.
Bonds
June 1
Cash
Available for Sale Securities – State Corp.
Bonds
Interest Revenue(see above table)
160,000
25,804
Cash
Available for Sale Securities – State Corp.
Bonds
Interest Revenue (see above table)
160,000
27,094
Interest Receivable
Available for Sale Securities – State Corp.
26,667
4,742
Dec. 1
31
59
30,968
26,667
4,301
185,804
187,094
Chapter 7 – Investments in Equity Securities and Debt Securities
Bonds
Interest Revenue
31,409
160,000 x 1/6 = 26,667
28,449 x 1/6 = 4,742
Dec 31
Market Adjustment – Available for Sale
Securities
Unrealized Gain or Loss on AFS
26,661
26,661
Market value (4M x 99%)
P3,960,000
Amortized Cost (3,768,973 + 4,742)
3,773,715
Cumulative UG/L
P
186,285
Before adjustment
159,624
Increase in UG/L
P
26,661
2011.
2. Journal entry/entries to record sale of investment on November 1,
(a) Securities are classified as financial assets at fair value through
profit and loss.
2011
Nov. 1
Cash
Loss on Sale of Trading Securities
Interest Revenue
Trading Securities – State Corp. Bonds
3,925,00
0
128,333
Acc. Int. = 4M x 8% x 5/12 = 133,333
Sales price (3,925,000–133,333)
3,791,667
Carrying value (4 M x 0.98)
3,920,000
Loss on sale
128,333
133,333
3,920,000
(b) Securities are classified as held-to-maturity securities.
2011
Nov. 1
1
Held to Maturity Securities – State Corp.
Bonds
Interest Revenue
32,933 x 5/6 = 27,444
Cash
Loss on Sale of Held to Maturity Securities
Interest Revenue
Held to Maturity Securities–State Corp.
Bonds
CV of HTM Securities sold:
As of June 1, 2011
3,858,658
Amortization June 1 to
Nov. 1, 2011
27,444
As of Nov. 1, 2011
3,886,102
Sales price
3,791,667
60
27,444
27,444
3,925,00
0
94,435
133,333
3,886,10
2
Chapter 7 – Investments in Equity Securities and Debt Securities
Loss on sale
94,435
(c) Securities are classified as available for sale securities.
2011
Nov. 1
1
Available for Sale Securities – State
Corp.Bonds
Interest Revenue
27,444
27,444
Cash
Loss on Sale of Available for Sale Securities
Net Unrealized Gain/Loss on AFS Securities
Interest Revenue
Available for Sale Securities–State
CorpBonds
Market Adjustment – AFS Securities
Sales price (3,925,000–133,333)
3,791,667
Amortized Cost
3,886,102
Loss
94,435
Amortized Cost 12/1/08
P3,827,293
Discount Amort.
12/1/08 – 12/31/08
31,365 x 1/6
5,228
Amortized Cost 12/31/08
P3,832,521
MV 12/31/08 4M x 98%
3,920,000
Unrealized Gain on 12/31/08
87,479
7.19
3,925,00
0
94,435
87,479
133,333
3,886,10
2
87,479
P
Raffy Company)
To facilitate computation, a partial amortization table is presented below.
Date
June 1, 2007
Dec.
31,
2007
Dec.
31,
2008
Dec.
31,
2009
Dec.
31,
2010
2007
June 1
Interest
Received
Interest
Revenue
Amortization
of Discount
350,000
312,267
37,733
HTM
Carrying Value
5,353,150
5,315,417
600,000
531,542
68,458
5,246,959
600,000
524,696
75,304
5,171,655
600,000
517,166
82,834
5,088,821
Held to Maturity Securities – Blessie Corp.
Bonds
Interest Revenue (5M x 12% x 5/12)
Cash
61
5,353,15
0
250,000
5,603,15
0
Chapter 7 – Investments in Equity Securities and Debt Securities
Dec. 31
Cash
Interest Revenue
Held to Maturity Securities – Blessie
600,000
Cash
Interest Revenue
Held to Maturity Securities – Blessie
600,000
Cash
Interest Revenue
Held to Maturity Securities – Blessie
600,000
Interest Receivable (3M x 12% x 8/12)
Held to Maturity Securities – Blessie
Interest Revenue (517,166 x 3/5 x 8/12)
240,000
562,267
37,733
2008
Dec. 31
2009
Dec. 31
531,542
68,458
524,696
75,304
2010
Sept. 1
1
Cash (3,090,000 + 240,000)
Gain on sale of HTM Securities
Interest Receivable
Held to Maturity Securities – Blessie
3,330,00
0
33,134
206,866
20,141
240,000
3,069,85
9
CV of HTM securities sold:
As of 12/31/07 (5,171,655 x 3/5)
3,102,993
Amort from 1/1/08-9/1/08
33,134
CV as of 9/1/08
3,069,859
Sales price
3,090,000
Gain on sale
20,141
1
Available for Sale Securities – Blessie
Held to Maturity Securities
2,068,66
2
2,068,66
2
5,171,655 – 3,102,993 = 2,068,662
Dec. 31
Cash
Interest Revenue
Available for Sale Securities – Blessie
240,000
2M x 12% = 240,000
5,171,655 – 3,102,993 = 2,068,662
2,068,662 x 10% = 206,866
240,000 – 206,866 = 33,134
Dec 31
Market Adjustment – AFS
Unrealized Gain or Loss on AFS
Amortized cost
2,068,662 – 33,134 =
P2,035,528*
Market value 2M x 103.5%
2,070,000
Market Adjustment
P 34,472
*or 5,088,821 x 2/5 = P2,035,528
206,866
33,134
34,472
34,472
Note: Instead of recognizing the unrealized gain or loss at the date of
reclassification on September 1, 2010 (the company demonstrating no ability
to hold the securities until maturity, hence the securities were reclassified as
62
Chapter 7 – Investments in Equity Securities and Debt Securities
AFS), and adjusting the account again at yearend, a single adjustment at
yearend is made in the above entries. Both methods would achieve the same
effect of reflecting the AFS to market at balance sheet date through the equity
account Unrealized Gain or Loss on AFS.
7-21
1.
2.
3.
4.
5.
6.
7.
8.
9.
10.
11.
12.
13.
14.
15.
B
A
B
A
B
A
A
A
B
B
C
B
A
A
B
and C
and C
and C
and C
and C
MULTIPLE CHOICE QUESTIONS
Theory
MC1
MC2
MC3
MC4
B
B
A
C
MC5
MC6
MC7
MC8
D
D
A
D
MC9
MC10
MC11
D
B
C
Problems
MC12
MC13
B
D
MC14
C
MC15
MC16
A
C
MC17
D
MC18
B
MC19
MC20
MC21
MC22
MC23
MC24
D
B
A
D
B
B
MC25
A
MC26
MC27
D
B
MC28
A
535,000 – 525,000 = 10,000
307,500 + 269,500 = 577,000; (600 x 440) + (2,000 x 138) = 540,000
577,000 – 540,000 = 37,000; 12,900 + 13,500=26,400; 37,000–26,400=10,600
10,000 x 150 = 1,500,000; 20% x 3M = 600,000
10,000 x 50 = 500,000; 1,500,000 + 600,000 – 500,000 = 1,600,000
1,000 x 50 = 150,000 + 2,250 = 152,250; 152,250 – (1,000 x 10) = 142,250
3,000 x 120 = 360,000; 560,000 x 3,000/6,000 = 280,000
360,000 – 280,000 = 80,000
360,000 x 600/3600 = 60,000; 200,000 + 60,000 = 260,000
360,000 – 260,000 = 100,000
500 x 25 = 12,500 – 500 = 12,000
500 x 20 = 10,000; 12,000 – 10,000 = 2,000 gain
960-500 = 460 + 600 = 1,060; 1,060/10 = 106 shares
88 ÷ 1.10 = 80
352,000 – (4,400 x 4) = 334,400; 334,400 / 4,400 sh = 76
See No. 21
1,200,000 – (3 x 40,000) + (25% x 640,000) = 1,240,000
40% x 450,000 = 180,000
150,000 ÷ 12 = 12,500; 180,000 – 12,500 = 167,500
25,000 x 180 = 4,500,000; 25% x (2,400,000 – 480,000) = 480,000
4,500,000 + 480,000 – 60,000 – 60,000 = 4,860,000
4,860,000 x 15/25 = 2,916,000
10,000 x 200 = 2,000,000; 4,860,000 x 10/25 = 1,944,000
2,000,000 – 1,944,000 = 56,000
63
Chapter 7 – Investments in Equity Securities and Debt Securities
MC29
MC30
C
B
MC31
MC32
C
B
MC33
MC34
MC35
MC36
A
A
C
C
MC37
MC38
C
B
MC39
D
MC40
MC41
MC42
D
B
D
500,000 + 1,500,000 + (10% x 3M) = 2,300,000
40% x 1,200,000 = 480,000; (40% x 900,000) ÷ 18 = 20,000
40% x 100,000 = 40,000; 480,000 – 20,000 – 40,000 = 420,000
4,000,000 + 420,000 – (40% x 200,000) = 4,340,000
(1,000 x 140) + (900 x 170) + (800 x 200) = 453,000
(1,000 x 150) + (900 x 180) + (800 x 220) = 488,000
488,000 – 453,000 = 35,000; 35,000 – 20,000 = 15,000
See No. 33
8,750,000 x 5% = 437,500
3,692,000 x 5% = 184,600; 4M x 4% = 160,000
184,600 – 160,000 = 24,600; 3,692,000 + 24,600 = 3,716,600
See No. 36
912,400 x 10% = 91,240; 1,000,000 x8% = 80,000
91,240-80,000 = 11,240; 912,400 + 11,240 = 923,640
7,850,000 – (8M x .08 x 6/12) = 7,530,000; 7,383,000 x 5% = 369,150
8M x 4% = 320,000; 369,150 – 320,000 = 49,150
7,383,000 + 49,150 = 7,432,150; 7,432,150 x 5% = 371,608
371,608 – 320,000 = 51,608; 7,342,150 + 51,608 = 7,483,758
7,530,000 – 7,483,758 = 46,242
500,000 x 4% = 20,000
460,000 – 472,500 = 12,500
64