Chapter 18 improving the equity, transparency, and solvency of pay as you go pension systems
Bạn đang xem bản rút gọn của tài liệu. Xem và tải ngay bản đầy đủ của tài liệu tại đây (13.81 MB, 54 trang )
CHAPTER
18
Improving the Equity,
Transparency, and Solvency
of Pay-as-You-Go
Pension Systems: NDCs,
the AB, and ABMs
Carlos Vidal-Meliá, María del Carmen
Boado-Penas, and Ole Settergren
CONTENTS
18.1 I ntroduction
18.2 N otional Defined Contribution Accounts (NDCs)
18.3 Actuarial Balance of the PAYG System
18.3.1 The Swedish Model
18.3.2 The U.S. Model
18.4 Automatic Balance Mechanism (ABMs)
18.4.1 S weden
18.4.2 C anada
18.4.3 G ermany
18.4.4 J apan
18.4.5 F inland
18.5 Summary and Conclusions
Appendix 458
Acknowledgments 4
References 4
420
422
429
431
439
445
449
451
452
453
455
456
67
67
419
© 2010 by Taylor and Francis Group, LLC
420 ◾ Pension Fund Risk Management: Financial and Actuarial Modeling
T
he a im of t his chapter is to show the advisability of introducing
instruments f or i mproving eq uity, t ransparency, a nd so lvency i nto
the pay-as-you-go (PAYG) pension system. This is in line with the trend
seen in some countries of applying actuarial analysis methodology to the
field of public PAYG pension system management. With this aim in mind,
we explain and analytically develop various aspects of notional definedcontribution accounts (NDCs), the actuarial balance (AB), and automatic
balance mechanisms (ABMs). The main conclusion reached is that these
tools are not simply unrealistic theoretical concepts but a response to the
growing social demand for transparency in the area of public finance
management, the need to minimize the political risk faced by PAYG systems, the desire to set the pension system firmly on the road to long-term
financial solvency, and the wish to increase contributors’ and pensioners’
confidence in the system in the sense t hat promises of pension payments
will be respected.
JEL Classifications:
H55, H83, J26, M49.
18.1 INTRODUCTION
Concern abo ut t he financial h ealth o f p ublic pens ion s ystems i n a ll i ts
various f orms—solvency, su stainability, v iability, eq uilibrium—caused
by population ageing is high on the agenda of many governments and
international organizations such as the World Bank, the Organization for
Economic Cooperation and Development (OECD), and the International
Labor Organization (ILO). It c an t herefore be co nsidered, a s Holzmann
and Palmer (2008) do, to be a q uestion of worldwide importance. In the
academic w orld, t oo, o ver t he la st t wo dec ades, t here ha s be en a h uge
increase in the number of articles published on all types of issues related
to public pension systems.
One aspect that has received much less attention in the literature concerns t he i nstruments t hat c an be a pplied to de al w ith one of t he ma in
problems faced by traditional defined benefit (DB) pay-as-you-go (PAYG)
systems: po litical r isk. De aling w ith t his p roblem c an o ften, according
to B oado-Penas (2008), b ring abo ut cl ear i mprovements i n t he s ystem’s
equity, transparency, and solvency.
Political ri sk s hould b e u nderstood b asically as r eferring t o t he
decisions t aken b y po liticians t ied t o t heir t raditional p lanning h orizon (often only 4 years), which is clearly far less than that of the PAYG
© 2010 by Taylor and Francis Group, LLC
Improving the PAYG Pension Systems ◾ 421
pension s ystem. Valdés-Prieto ( 2006a) po ints o ut t hat D B PAYG s ystems tend to require periodic adjustments due to demographic and economic uncertainties. Relying on discretionary legislation for these social
security m odifications c reates po litical r isk f or bo th co ntributors a nd
beneficiaries.
Cremer and Pestieau (2000) argue that economic and demographic factors play a r elatively small role i n t he PAYG pension s ystem’s problems;
political factors are far more important, and the process of reforming the
pension system is mainly a po litical problem. Financial (solvency) problems caused by fluctuations in fertility rates, population ageing, increasing longevity, and declining productivity growth can easily be addressed
by t he ex perts, but social security systems a re established a nd reformed
through the political process. Consequently, the outcome is likely not to
be socially optimal.
The most negative fac e of political r isk i s what Valdés-Prieto (2006b)
terms “populism in pensions.” This can be defined as a form of competition between politicians in which voters are offered subsidies and benefits
without their appreciating that it is they themselves who will pay through
higher taxes, higher contributions, higher inflation, or reduced economic
growth.
Populism in pensions is a phenomenon usually seen in countries with
pension systems that are financed by PAYG; it is aggravated if a country
suffers from a weak democratic structure and could also be i ncreased by
a low level of education. Where the financial method is capitalization, it is
more difficult for populism in pensions to appear given that the pensions
are financed in advance and there is an obligation to compile an actuarial
balance (AB) sheet every year, from which the corrective measures to be
applied are derived when necessary.
Finally, H olzmann a nd P almer ( 2008) st ate t hat soc ioeconomic
changes—basically g reater pa rticipation by women i n t he labor ma rket,
changes in family structures, and increasing globalization, which together
imply greater integration of the goods and services markets, factors of production and k nowledge—call for a r eformulation of t he basic ideas governing pension system design, some of which have remained unchanged
for more than a century.
The aim of this chapter is to show the advisability of introducing instruments to improve the equity, the transparency, and the solvency of PAYG
pension systems. This is in line with the trend seen in some countries of
© 2010 by Taylor and Francis Group, LLC
422 ◾ Pension Fund Risk Management: Financial and Actuarial Modeling
applying ac tuarial a nalysis m ethodology t o t he field o f p ublic P AYG
pension system management.
After this introduction, in Section 18.2 we give a brief description of various aspects of notional defined contribution (NDC) pension plans. In Section
18.3, we concentrate exclusively on what will be described as the PAYG system’s actuarial balance (AB), focusing especially on some of the features of
the Swedish and U.S. methods. Section 18.4 defines what is u nderstood by
the term automatic balance mechanism (ABM) as applied to a pension system, and includes a brief presentation of those in place in Sweden, Canada,
Germany, Japan, and Finland. This chapter ends with the main conclusions,
a bibliography w ith references, a nd four appendices i n wh ich we a nalytically develop the relationship between the main formulae for calculating the
retirement pension i n PAYG s ystems, t he contribution a sset, a nd t he s ystem’s liabilities as shown in the AB for both Sweden and the United States.
18.2 NOTIONAL DEFINED CONTRIBUTION
ACCOUNTS (NDCs)
The i ntroduction of what a re k nown a s N DC pens ion accounts (plans),
NDCs,* as a component of modern multi-pillar pension systems in some
countries, ha s be en o ne o f t he ma in i nnovations o f t he la st dec ade a s
regards pens ion r eform. They c an be f ound i n I taly (1995), Kyrgyzstan
(1997), L atvia ( 1996), P oland ( 1999), S weden ( 1999), B razil† ( 1999),
Mongolia (2000), and Russia (2002).‡ O ther countries such a s G ermany
(Börsch-Supan and Wilke 2006), Austria (Knell 2005a),§ France (Jeger and
Leliebre 2 005), Finland (Lassila a nd Valkonen 2 007a), Portugal (Barrías
2007), and Norway (Stensnes and Stølen 2007) have also incorporated elements of notional philosophy to assist in calculating or indexing the initial
retirement pension.
The notional account is not a completely new concept. As Gronchi and
Nisticò (2006) point out, the original idea of the NDC was present in two
* For an international perspective see the books by Hol zmann and Palmer (2006, 2007), and
Holzmann, Palmer, and Uthoff (2008).
† Th is does not have all the characteristics of a notional account system.
‡ See Hauner (2008).
§ The author calls this a “notional defined benefit system” (NDB) as all the contributions made
are registered i n a not ional account a nd a mount to 1 .78% of t he a nnual contribution base
and are revalued in line with the average increase in the contribution bases. If the individual
retires at a ge 65 a fter 45 years of contributions, his entitlement will be (1.78 ×45) =80.1% of
the contribution base.
© 2010 by Taylor and Francis Group, LLC
Improving the PAYG Pension Systems ◾ 423
papers published in the 1960s by Buchanan (1968) and Castellino (1969),
which were rediscovered in the late 1990s by Gronchi (1998) and ValdésPrieto (2000). The latter t races t he origin of t he concept back t o France
in 1945, in what was known as the points system* (PS), and to the United
States in the 1980s, when Boskin et al. (1988) proposed a reform of the
pension system based on ideas in which the concept of notional accounts
was implicit.
According to Vidal-Meliá et al. (2004), a n otional account is a v irtual
account r eflecting t he i ndividual co ntributions o f e ach pa rticipant a nd
the fictitious returns that these contributions generate over the course of
the participant’s working life. In principle, the contribution rate is fixed.
Returns are calculated in line with a notional rate that may be the growth
rate of GDP, average wages, aggregate wages, contribution payments, etc.†
When t he i ndividual r etires, h e o r sh e ( henceforth, h e) r eceives a pen sion that is derived from the value of the accumulated notional account,
the expected mortality of the cohort retiring in that year, and, possibly, a
notional imputed future indexation rate. In this way, the notional model
combines PAYG financing w ith a pens ion f ormula t hat depen ds o n t he
amount contributed and the return on it.
At first glance, NDC plans simply appear to be an alternative way of calculating the amount of retirement pension, but in fact the notional method
goes beyond what might be imagined from seeing the collection of formulae in Appendix 18.A.1. The account is called notional because it exists only
on paper. Money is not deposited i n a ny real account. Nevertheless, t he
amount of the pension is based on the fund accumulated in the notional
account (K). C ontributions made to not ional accounts a re c apitalized at
* The p oints s ystem for re tirement w as d eveloped i n Fr ance w ithin t he f ramework of c omplementary regimes for salaried workers (Association pour le régime de retraite complémentaire des salariés: ARRCO) and management (Association générale des institutions de
retraite des cadres: AGIRC). Pension entitlement for p eople in these regimes was based on
the accumulation of retirement points throughout working life. See Appendix 18.A.1.
† A somewhat over-simplified “truth” is that the most appropriate rate of return, from a financial stability point of view, is the growth rate of the covered wage bill, which reflects not only
the variation in contributors but a lso the variation in contribution bases (productivity). In
practice, this index is not a lways used—in Sweden, for i nstance, the index used, disregarding p eriods w hen t he automatic balance me chanism i s activated, i s t he g rowth i n average
earnings, partly because it is considered to be less volatile. Mechanisms are in place to deal
with any negative fi nancial consequences that could arise from using this index or financial
imbalances in the pension system deriving from demographic or economic shocks or turbulence in financial markets. These are looked at in Section 18.4.
© 2010 by Taylor and Francis Group, LLC
424 ◾ Pension Fund Risk Management: Financial and Actuarial Modeling
a notional rate of return. This hypothetical return* is normally linked to
some external index set by law.
When the individual retires, the notional account—in all countries
that use them—is converted into a life annuity.† This is normally done
by dividing the value of the notional account (K) by a conversion factor
(g) t hat depends on l ife e xpectancy at t he c hosen re tirement a ge a nd
the interest rate, which w ill indirectly bring about a r eduction in t he
degree of va riation i n t he i nternal r ate of return (IRR) be tween generations. T he base for calculating t he conversion fac tor should be se t
by law and decisions need to be made a s to which mortality table and
interest rate should be u sed in t he calculation a nd how t he mortality
table should be updated.‡ It should also be determined whether or not
the conversion factors for men a nd women should be sepa rated, as is
common with pension plans with real capitalization, or whether some
common c onversion f actor s hould b e u sed t o ave rage out l ife e xpectancy for men and women, as is generally the case in traditional PAYG
systems.
Following Vidal-Meliá et al. (2006), in order to calculate the initial pension of an individual at retirement age in notional account models, the
contributions made and valued at the date of retirement are made equal to
the pension that that individual will receive until his death, which is also
calculated at the date of retirement. Hence the initial pension at normal
retirement age will be t he product of the conversion factor (CvF), g, and
the notional capital (K):
CvF
P
NDC
R
= g
R −1
R −1
t=x
i =t
∑ ct ⋅Wt ∏ (1 + ri )
(18.1)
K
* It is worth pointing out that the volatility of the return on notional accounts is usually less
or much less than the return on a p ension plan under the capitalization system, which will
depend on the choice of portfolio and the investment market.
† Th is i s one w ay it d iffers f rom a s ystem of i ndividual c apitalization a ccounts, i n mo st of
these c ountries, opt ions ot her t han l ife a nnuities a re av ailable ( lump s um p ayments a nd
programmed withdrawals).
‡ In Sweden and Brazil, demographic parameters undergo an adjustment process every year
following observed survival rates. In Italy, the review should be every 10 years. According to
Diamond (2005), the best way of putting an end to unwanted political manipulation would
be to carry out annual adjustments with real data instead of projections.
© 2010 by Taylor and Francis Group, LLC
Improving the PAYG Pension Systems ◾ 425
where
ct is the contribution rate at moment “t”
Wt i s t he co ntribution ba se f or t he r etirement co ntingency a t
moment “t”
ri is the real notional rate applied to capitalize the contribution
g i s t he p redetermined co nversion fac tor, wh ich i s t he i nverse o f a n
actuarial annuity
In practice a n e stimated va lue c an be g iven for t he relevant va riable so
as to ma ke t he initial pension as high as possible, and t he indexation of
the pension in payment is adjusted annually in line with the behavior of
the relevant variable. If the variable actually behaves as forecast, pensions
remain constant in real terms; if growth is greater than predicted, pensions grow in real terms; and if growth is lower than forecast, then
pensions decrease in real terms. A mechanism similar to this is applied in
the case of Sweden.
Arguably, NDC systems have stronger immunity against political risk
than more traditional DB PAYG systems. According to Valdés-Prieto
(2005), t he n otional acco unt s ystem i s a u seful wa y i n wh ich t o m inimize t he political r isk a ssociated w ith PAYG s ystems a s it i ncreases t he
long-term financial solvency of the system, although it also increases the
explicit economic risk affecting contributors.* Marin (2006) believes that
the notional account system is a better way of managing and diversifying
risk i n comparison to a ll other pension pa radigms a s it c reates no fa lse
expectations about pensions to be received in the future, makes it difficult
for contributors to be tempted to behave opportunistically, and is not
subject to the financial risk of capitalization systems.
As r egards financial su stainability, Valdés-Prieto (2000, 2 002) sh ows
that, e ven wh en a pplying t he m ost fa vorable f ormula ( model), N DCs
can only achieve this in a r ather unrealistic steady state. Hence notional
account systems always require other financial adjustment mechanisms—
such a s government g uarantees a nd re peated re course to le gislation—to
be imposed in the same way as traditional benefit systems, or according
to Settergren (2001), special measures such as ABMs, which will be looked
at in Section 18.4.
According t o Dia mond (2004, 2 006), a w ell-structured N DC s ystem
with a decent-sized buffer stock of assets will be unlikely to need legislative
* On this subject, see the papers by Vidal-Meliá et al. (2006) and Boado-Penas et al. (2007).
© 2010 by Taylor and Francis Group, LLC
426 ◾ Pension Fund Risk Management: Financial and Actuarial Modeling
intervention as long as economic growth is high enough. For Lindbeck and
Persson (2003), a quasi-actuarial system with an exogenous contribution
rate (i.e., a contribution-based system) will increase the financial stability
of the pension system in the sense that politicians will not have made any
promises concerning future pension benefits, although, as Börsch-Supan
(2005) points out, only time will tell whether the political risk of NDC
systems is really much less than traditional DB systems as some of the
system’s parameters could always be modified.
As fa r a s t he i ntergenerational a spect i s co ncerned, f ollowing K nell
(2005a,b), NDCs are more “forward looking” while DB PAYG systems
have a more “ backward lo oking” c haracter. “For ward lo oking” s ystems
are more in line with principles of intergenerational fairness and responsibility, wh ereas “ backward l ooking” s ystems i ndicate t hat pe ople a re
obliged to shoulder the burden of changes in the size of cohorts that have
been determined before they were even born, or before they were part of
the electorate or the labor force.
As Diamond (2006) and Barr and Diamond (2006) correctly point out,
almost all the advantages attributed to NDCs could be obtained with a
well-designed DB system, although of course this is precisely the difficulty
inherent in such systems: the ease with which erroneous political decisions
convert them into badly designed systems.* For Marin (2006), the superiority of the NDC system over the DB system lies not in the theory but in
the practice and application. The formulae that determine the initial pension for DB a nd NDC systems, respectively, may produce a v ery similar
financially sustainable pension. Also, the relationship of the NDC system
to the PS is clear (see Appendix 18.A.1), although the problem with the
PS is its highly discretional nature, similar to DB systems in this aspect,
which, according to Valdés-Prieto (2000), is built into the system. This can
be seen from the way the authority in charge of the system can arbitrarily
adjust the cost of buying new points, the contribution rate, and the value
of points sold to obtain a pension every year. Börsch-Supan (2006) states
that discretional deviations have been frequent in the French PS, and the
German system is not free of them either.
Börsch-Supan (2005) points out that NDC systems have a high level of
transparency and, at least potentially, a deg ree of credibility that are not
usually found in DB systems. This is because the basic elements that determine t he a mount of t he pension appear naturally i n notional accounts,
* On this subject, see the papers by Palmer (2006) and Williamson (2004).
© 2010 by Taylor and Francis Group, LLC
Improving the PAYG Pension Systems ◾ 427
whereas they do not in the more complex formulae needed for calculating
pensions in DB systems. Marin (2006) argues that NDC systems encourage actuarial fairness and stimulate the contributors’ interest in the pension system as they bring to light any improper or hidden redistribution of
benefits to privileged groups and reveal who really benefits from the legislation. It also forces contributors to think about the relationship that exists
between their contributions, the option to retire at different ages and the
amount of pension in the form of a life annuity that they will eventually
receive, a nd a ll t hese t hings ma ke pe ople m ore i nterested i n a nd m ore
knowledgeable about the way the pension system works.*
The NDC system allows for special circumstances to be taken into consideration—it enables married couples to share notional accounts during certain
periods if they have children to look after, for example, or periods of military
service—but the funding for this must come from the State and general taxation, and the appropriate entries must be made in the notional accounts.
According to Holzmann (2006, 2007), these positive features of the
notional acco unt s ystem a re su fficient r easons f or p utting i t f orward
as a f undamental r eferent f or t he f uture u nified pe nsion s ystem o f t he
European Union.
Finally, following Vidal-Meliá et al. (2004), although the notional account
system has many positive elements, it also has some characteristics, which
in most cases it shares with the traditional (DB) PAYG system:
1. It d oes n ot f ully de al w ith t he p roblem o f dem ographic cha nge.
Although it takes the evolution of mortality into account, there is a
delay before it does so. Pensions are generally calculated only once—
at the time they are awarded—and improvements in life expectancy
are n ot t aken i nto acco unt wh en pens ions t hat ha ve a lready be en
awarded and are still in payment are recalculated.†
2. If t he contributor i s f ree to choose h is a ge of retirement, t his may
result in an excessive number of early retirements, which, in turn,
may cause pressure on the authorities to increase the amount of the
guaranteed m inimum pens ion. De spite t he ac tuarial ad justment
incorporated into the NDC system, Palmer (1999), there is empirical
* Every year in Sweden, all affi liates are sent what is known as the “orange envelope” containing information about the notional account and capitalization, plus a projection of expected
benefits at ages 61, 65, and 70.
† Th is point is also shared by capitalized pension systems.
© 2010 by Taylor and Francis Group, LLC
428 ◾ Pension Fund Risk Management: Financial and Actuarial Modeling
evidence that contributors use a higher personal discount rate than
that applied in the actuarial adjustment and tend to retire as soon as
they are allowed to, and for this reason a great deal of care needs to
be taken when it comes to establishing the minimum retirement age.
In a sc enario with a fi xed contribution rate and a pers istent rise in
longevity, the size of the pension tends to decrease. For this reason,
Barr (2006), the minimum retirement age needs to be raised in line
with the increase in life expectancy.*
3. If the return on the contributions using the chosen index were less
than th e r eturn o n th e c apitalization fu nds—this w ould b e m ore
likely in mixed systems sharing notional and individual capitalization accounts—then the individual might consider that there was an
implicit cost (tax) in the notional accounts equivalent to the difference in return. W hether t his would be a co rrect perception or not
depends o n t he co ntributor’s deg ree o f r isk a version a nd t he r iskadjusted return. Nominally positive difference i n y ield c ould a fter
risk adjustment be negative.†
4. According to Boado-Penas et al. (2007), contributors take on the risk
of how the index evolves and are subject to a r isk-return ratio they
did not choose, that is, their risk aversion is not taken into account,
whereas it is—or at least has the potential to be—in private capitalization funds. It should also be pointed out that the index or indices
chosen as notional rates can be h ighly volatile and submit the contributor-beneficiary to more risk than they would willingly take on.
5.
The p ractical a pplication o f t his n otional acco unt s ystem t o t he
retirement contingency needs to be combined with traditional
formulae o r i nsurance f ormulae i n o rder t o co ver d isability a nd
survivor benefits.
* This is shared by capitalized pension systems.
† The Swedish experience shows that since 1995 the average rate of return in the notional type
(Inkomstpension) s ystem, me asured a s t he c apital-weighted r ate of re turn, has b een 3.1%.
The average annual variation in the rate of re turn, as measured by t he standard deviation,
has been 1.1 percentage points. Since t he fi rst payments into t he premium pension system
in 1 995, t he ave rage re turn of t he pre mium p ension s ystem a fter t he d eduction of f undmanagement fe es h as b een 5. 8%. The a nnual v ariation i n t his r ate of re turn, a s me asured
by the standard deviation, has been 14.3 percentage points. The risk-adjusted return for the
Inkomstpension system would be 2.81% and barely 0.41% for the premium pension system.
If the return were measured by means that took into account the degree of risk aversion, the
comparison would still be more favorable toward the notional account system.
© 2010 by Taylor and Francis Group, LLC
Improving the PAYG Pension Systems ◾ 429
6. Political risk still exists insofar as the system’s parameters could still
be altered. This risk will be g reater the lower the level of legislative
regulation.
7. Finally, just like traditional DB systems—as well as most DC systems—
NDCs have i n practice established a u niform ac tuarial fac tor where
there is expected income redistribution from those with a shorter than
average life expectancy to those with longer life expectancy.
It can be concluded from the points mentioned earlier that, despite the fact
that it is a clear improvement on the traditional DB PAYG system, the NDC
system should be applied whenever possible in conjunction with other
instruments such as those that will be studied in the following sections.
18.3 ACTUARIAL BALANCE OF THE PAYG SYSTEM
This section looks exclusively at what will be de scribed as the AB of the
PAYG system, with particular attention given to the so-called Swedish and
U.S. models.
According to the BOT ( 2008), a v ery detailed annual AB—an actuarial
report, in fact—has been compiled in the United States since 1941, and from
2002 it has included stochastic methodology. The so-called U.S. AB drawn
up by the U.S. social security—similar to that published by the authorities
in Japan every 5 years, Sakamoto (2005) and Canada every 3 years, OSFIC
(2005, 2007)—is not a balance sheet in the traditional accounting sense of the
term, with a list of assets and liabilities that consider an indefinite horizon.
Compiling a n o fficial AB sheet has been normal practice in Sweden
since 2001. This AB sheet—in the form it takes in Sweden—has attracted
little attention from academics. This is surprising given that in the literature there are a great many methodologies applied to analyze the viability
or the sustainability of pension systems or to forecast aggregate spending,
and this field is of special interest to a number of researchers. As far as we
are aware, only in the cases of Japan* and Spain† has the AB sheet with its
* Takayama (2005) u ses t he a ctuarial b alance s heet a s a n e lement to a nalyze prop osals for
reforming the pension system, although the list he pre sents of t he items it c omprises is not
very developed.
† Boado-Penas e t a l. (2008) c ompile a n actuarial balance sheet to a ssess t he s olvency of t he
Spanish s ystem a nd c ompare it to t he S wedish s ystem. They also develop the concepts of
the contribution asset and the average turnover duration for defined-benefit PAYG systems.
Vidal-Meliá et al. (2009) use the balance sheet of the Spanish system to support the introduction of an automatic balance mechanism (ABM).
© 2010 by Taylor and Francis Group, LLC
430 ◾ Pension Fund Risk Management: Financial and Actuarial Modeling
typical structure of assets and liabilities been used by researchers, and on
an official level it has not been used outside Sweden.
Based ma inly o n i nformation o btained f rom L efebvre ( 2007), T EPC
(2007), and Jimeno et al. (2008), the most commonly used methodologies
for making aggregate projections of spending on pensions are
1. Aggregate or growth accounting models: According to Domenech
and M elguizo ( 2008), t he a ggregate acco unting a pproach r elies
on making a va riety of assumptions regarding the economy as a
whole, taking into account future trends in demography (fertility
rates, migration flows, and life expectancy), economic conditions
(participation an d e mployment r ates, p roductivity, w ages, an d
interest rates), and institutional factors (coverage and pension levels). These are used mainly for making aggregate projections of spending on pensions. Despite the fact that these models are becoming
more and more complex as they are made heterogeneous, their main
advantage is that they are easy to apply and accurately reproduce
the r eality o f t he pens ion s ystem. T hey a re o ften r eferred t o b y
some authors as actuarial models. They are also frequently used
by pu blic aut horities a nd or ganizations; t he A geing W orking
Group, the technical working group of European Union’s TEPC,
which is responsible for spending forecasts, follows this basically
deterministic a pproach a lthough n ot a ll t he co untries i nvolved
apply it.
2. Micro-simulation mo dels or pr ojections b ased on i ndividual l ife
cycle profi les: The working lives of a group of individuals are used
to p roject h ow t heir pens ions w ill e volve. Z aidi a nd R ake (2001)
explain t hat t here a re a n umber o f va riants: dy namic a nd st atic,
micro-simulations with behavior, etc. Linked to these micro-simulation models are the generational accounting models, such as the
one applied i n Slovenia. It is often difficult to d istinguish certain
hybrid models that combine features of this model with those of
aggregate acco unting m odels. M icro-simulation m odels a re u sed
in France and Sweden.*
* Projections as to the possible future evolution of the system are made in the annual report on
the Swedish pension system, although the results have no i nfluence on t he parameters that
pilot the pension plan. The actuarial balance sheet, as seen in the next section, is the basic
source of information for the Swedish pension system.
© 2010 by Taylor and Francis Group, LLC
Improving the PAYG Pension Systems ◾ 431
3. General eq uilibrium m odels: The pens ion s ystem i s p laced w ithin
an economic environment of general equilibrium with endogenous
prices, which generates explicit models of demographic and macroeconomic e volution. The ma in d rawbacks o f t hese m odels a re t he
computational complexity, the sensitivity to hypotheses, and a clear
shift away from the reality of the pension system, which means that
it is rarely applied by official organizations. Holland is an exception
where this type of model is applied.
4. Indirect models: Ba sed ma inly on t he I RR or t he t ransfer component, and usually applied to study intergenerational and intragenerational fairness.
18.3.1 The Swedish Model
The AB sheet for the PAYG pension system as compiled in Sweden does not
fit into any of the methods briefly described earlier. It can be de scribed as a
financial statement listing the pension system’s obligations toward contributors and pensioners at a particular date, with the amounts of the various assets
(financial, real, and through contributions), which back up these obligations.
As B oado-Penas e t a l. ( 2008) a nd Valdés-Prieto ( 2002) ha ve po inted
out, t he ma in a im of t he A B sheet is to g ive a t rue a nd fa ir v iew of t he
pension system’s capital at the end of each fiscal year and, by comparing
these figures, t o de termine t he cha nge i n n et w orth. It a lso co ntributes
to ma nagement a nd ex ternal information as it is useful not only for t he
authority governing the system but also for contributors and pensioners in
general, and also for whichever body guarantees payment, that is, for the
State along with the contributors it represents.
The ma in en tries o n t he ba lance sh eet a re ba sically t hose sh own i n
Table 18.1.
In general terms, it can be said that a PAYG pension system is reasonably solvent as l ong as ( financial assets +contribution a sset) ≥(liability t o
TABLE 18.1 Main Entries on the Actuarial Balance Sheet
of a PAYG System
Assets
Financial assets
Contribution asset
Accumulated deficit
Actuarial losses for the period
Total assets
© 2010 by Taylor and Francis Group, LLC
Liabilities
Liability to pensioners
Liability to contributors
Accumulated surplus
Actuarial profits for the period
Total liabilities
432 ◾ Pension Fund Risk Management: Financial and Actuarial Modeling
pensioners +liability to contributors). At the date of the balance sheet, if this is
the case, participants should have a realistic expectation of receiving the benefits that have been foreseen, without the system’s sponsor (the State) having
to make periodic contributions. Solvency is clearly never completely assured
in the long term as neither assets nor liabilities are known in their entirety.
The difference between the concepts of solvency and sustainability is not
self-evident. A ccording t o K nell e t a l. (2006), t he ter m su stainability ha s
many definitions, though it almost always refers to the fiscal policies of a
government, the public sector, or the pension system. One of the most widely
accepted definitions in the area of pensions is that of “a position where there
is no need to increase the pension contribution rate in the future.” This definition applies perfectly to NDC systems but not to DB systems.
The n ovel en try o n t he PAYG ba lance sh eet i s t he o ne c alled t he
“contribution asset.” This is derived from linking the pension system’s
assets and liabilities and is the result of a f ormula that shows the size
of both the assets and the liabilities when the pension system is actuarially b alanced a nd f inanced by pu re p ay-as-you-go, i n a s cenario
defined by the economic, demographic, and legal (pension legislation)
conditions of t he accounting per iod. It c an be i nterpreted i ntuitively
as the maximum level of liabilities that can be financed by the existing
contribution rate, without periodic supplements from the sponsor, in a
steady state.
Both t he assets and t he liabilities are va lued on t he basis of verifiable
cross-section facts, that is, no projections are made. For example, current
longevity is used even though it is expected to increase. If and when that
expectation ma terializes i n n ew m ortality t ables, t his w ill be i ncorporated i nto t he i nformation on t he ba lance sheet on a y ear-to-year ba sis.
Similarly the calculation of the contribution asset does not anticipate that
contributions will grow in line with real salaries due to expected economic
growth. This should not be interpreted as a belief that all the basic parameters determining the items on the balance sheet will remain constant in
time, but a s a r esult of t he po licy of u sing only verifiable factors in t he
compilation of the balance sheet. Changes are not included until they happen a nd c an be v erified. The S wedish N ational S ocial I nsurance B oard
(Försäkringskassan 2002) argues that another advantage of this principle
is t hat it avoids t he ma nipulations a nd biases t hat could a ffect a ny projections. The Försäkringskassan (2002) a lso i ndicates t hat t he economic
and demographic forecasts t hat have to be made i n order to predict t he
system’s IRR and future variations in average salary are not very accurate.
© 2010 by Taylor and Francis Group, LLC
Improving the PAYG Pension Systems ◾ 433
The authorities do not even consider themselves able to make this type
of prediction in the short term with an acceptable degree of certainty or
accuracy. According to their criteria, the ability to make this type of prediction for the long term with the degree of reliability required by the pension system is even more limited.
As already mentioned, producing an AB sheet is a practice that has been
carried out in Sweden since 2001. The main data for the period 2001–2007
are shown in Table 18.2. The retirement contingency of the Swedish pension
system i s m ixed, w ith 86 .49% of t he contributions bei ng a llocated to t he
PAYG s ystem, N DC t ype, a nd t he o ther 13.51% t o t he defined contribution capitalization system. The balance sheet refers only to the PAYG part,
notional type (Inkomstpension), and to the commitments deriving from
the old pension system, earnings related benefits, known as Allmän Tillägs
pension (ATP).
The “financial asset” is t he va lue of t he financial assets owned by t he
Swedish pension system at the date of the balance sheet. It is valued according to internationally accepted principles, t hat is, based on t he financial
prices of t he sec urities held. It i s la rge considering it i s a P AYG s ystem,
amounting to 29.3% of GDP in 2007.
The value of the contribution asset is the product of the turnover duration (T D) a nd t he va lue o f t he co ntributions made i n t hat per iod. The
TD is the time that is expected to pass from when a monetary unit enters
the s ystem a s a co ntribution u ntil i t l eaves i n t he f orm o f a pens ion. It
is eq uivalent t o t he su m of t he weighted pay-in a nd pay-out durations*
of o ne m onetary u nit i n t he s ystem f or t he y ear’s co ntributions, a nd i s
based on population data obtained from a cross-section, not a projection.
In S weden, t o l imit fluctuations i n t he pe nsion s ystem’s a nnual r esult,
the contribution flow used in the calculation of the contribution asset is
smoothed. If the population declines (increases), there is a risk that the
accounts will (slightly) overstate (understate) the system’s assets in relation to its liabilities, since in such a case the TD is (slightly) overestimated
(underestimated). However, a s t he ba lance sh eet i s co mpiled e very y ear
according to verifiable data, it tends to provide a t rue and fair view. The
stationary demographic a nd economic state is for sure not ex post fac to
true, but because successive changes are included as they are registered in
successive balance sheets, the solvency indicator remains reliable.†
* See Appendix 18.A.2.
† See Auerbach and Lee (2006).
© 2010 by Taylor and Francis Group, LLC
Year
2007
2006
2005
2004
2003
2002
2001
Assets
Financial asset (F)
Contribution asset (CA)
Actuarial losses (Table 18.3)
Total assets
898,472
6,115,970
81,607
7,096,049
857,937
5,944,638
—
6,802,575
769,190
5,720,678
—
6,489,868
646,200
5,606,592
49,029
6,301,821
576,937
5,465,074
—
6,042,011
487,539
5,292,764
166,762
5,947,065
565,171
5,085,252
—
5,650,423
Liabilities
Liabilities to contributors (AD)
Liabilities to pensioners (DD)
Accumulated surplus
Actuarial profits
Total liabilities
4,909,569
2,086,915
99,565
—
7,096,049
4,750,749
1,952,261
28,392
71,173
6,802,575
4,612,959
1,848,517
8,783
19,609
6,489,868
4,486,030
1,757,979
57,812
—
6,301,821
4,313,706
1,670,493
51,645
6,167
6,042,011
4,157,021
1,571,637
218,407
—
5,947,065
3,942,873
1,489,143
218,407
—
5,650,423
GDP (in millions of SEK)
GDPa
3,070,591
2,899,653
2,735,218
2,624,964
2,515,150
2,420,761
2,326,176
© 2010 by Taylor and Francis Group, LLC
434 ◾ Pension Fund Risk Management: Financial and Actuarial Modeling
TABLE 18.2 Balance Sheet of the Swedish Pension System at December 31 of Each Year (ATP and Inkomstpension) for the Period 2001–2007,
in Million of Swedish Krona (SEK)
Funding and solvency indicators
Solvency ratio
Degree of funding (%)
Liabilities to contributors/
liabilities (%)
1.0026
12.84
70.2
1.0149
12.80
70.9
1.0044
11.90
71.4
1.0014
10.35
71.8
1.0097
9.64
72.1
1.0090
8.51
72.6
1.0402
10.40
72.6
© 2010 by Taylor and Francis Group, LLC
Improving the PAYG Pension Systems ◾ 435
Sources: The Swedish Pension System Annual Report 2001. Ed. O. Settergren, National Social Insurance Board (Försäkringskassan), Stockholm, Sweden,
2002; The Swedish Pension System Annual Report 2002. Ed. O. Settergren, National Social Insurance Board (Försäkringskassan), Stockholm,
Sweden, 2003; The Swedish Pension System Annual Rep ort 2002. Ed . O. S ettergren, National S ocial Insurance B oard (Försäkringskassan),
Stockholm, S weden, 2004; The S wedish P ension S ystem Ann ual Rep ort 2002. Ed . O . S ettergren, N ational S ocial I nsurance B oard
(Försäkringskassan), Stockholm, Sweden, 2005; The Swedish Pension System Annual Report 2002. Ed. O. Settergren, National Social Insurance
Board (Försäkringskassan), Stockholm, Sweden, 2006; The Swedish Pension System Annual Report 2002. Ed . O. Settergren, National Social
Insurance Board (Försäkringskassan), Stockholm, Sweden, 2007; The Swedish Pension System Annual Report 2002. Ed. O. Settergren, National
Social Insurance Board (Försäkringskassan), Stockholm, Sweden, 2008 and own.
Note: Totals do not necessarily equal the sums of rounded components.
a Th
is figure is introduced to give the reader some idea of the size of the pension system in relation to the size of the Swedish economy.
436 ◾ Pension Fund Risk Management: Financial and Actuarial Modeling
The “ liability t o co ntributors” i s t he n otional c apital acc umulated i n
the contributors’ accounts and that deriving from commitments to contributors under the old system (see Appendix 18.A.3), and the “liability to
pensioners” is the present value of the amount of all pensions in payment
to current pensioners, taking into account current life expectancy and the
technical interest rate that was applied* (1.6%) when the amount of the
initial pension was calculated a nd which is subsequently deducted f rom
the yearly indexation of the pension. The liability to contributors amounts
to 70.2% of total liabilities.
As can be seen from the balance sheet (Table 18.2), the Swedish system’s
degree of capitalization (F/(AD +DD)) is high, amounting to 12.84% of the
liabilities i n 2 007. This enab les a ny pos sible y early i mbalances be tween
the s ystem’s i ncome a nd ex penditure t o be de alt w ith b y sel ling financial assets, which would make the need for outside funding from the state
unlikely.
The accumulated surplus is the “accumulated profit” or net worth of the
pension s ystem, wh ich is owned by t he s ystem’s sponsor, i n t his c ase
the State. As can be seen in Table 18.3, the system’s annual profit or loss is
the difference between the increase in assets and the increase in liabilities
during t he per iod. The loss i s a lso identical to t he i ncrease i n t he acc umulated deficit or t he reduction i n t he acc umulated su rplus, depending
on the situation. It is important not to confuse this profit or loss with the
annual cash deficit or surplus. In Table 18.3, the cash deficit or surplus is
the difference between the contributions received and the pensions paid.
In 2 007, t he c ash su rplus a mounted t o (190,416–185,653) 4 ,763 m illion
Swedish Krona, approximately 0.16% of GDP for that year. The system had
“losses” i n 2002, 2004, a nd 2007, a nd “profits” i n 2003, 2005, a nd 2006.
The initial figure for the accumulated surplus in 2001 was obtained from
the difference between all the assets and liabilities as a whole.
The ma in r eason for va luing a ssets a nd l iabilities w ithout t aking t he
future into consideration is t hat t he system’s financial solvency does not
depend on the amount of assets and liabilities taken separately, but on the
ratio between them as measured by the solvency ratio.
* The c lassic actuarial d iscount factor i s not u sed. The För säkringskassan (2002) shows t hat
a so-called economic divisor is used which takes into account the amount of pensions to be
paid at each age for each individual, and which in the case of Sweden supplies a slightly different value to that of the classic actuarial discount factor. The economic divisor is coherent with
the definition of the TD, in which the ages of the working and retired affi liates are weighted
by their economic amounts (contributions and pensions). See more in Appendix 18.A.3.
© 2010 by Taylor and Francis Group, LLC
Improving the PAYG Pension Systems ◾ 437
TABLE 18.3 Actuarial Income Statement at December 31, 2007
(Inkomstpension + ATP), Millions of SEK
Fund Assets (Changes)
40,535
293,474
Pension Liabilities (Changes)
Contributions
190,416
194,062
Pension
disbursements
Return on
funded capital
Administrative
costs
−185,653
268,334
New pension
credit and ATP
pointsa
Indexationb
37,544
17,391
Longevityc
−1,772
1,008
Inheritance gains
(distributed—
arising)d
Administrative
costs
Pension
disbursements
Contribution
asset (changes)
Contribution
revenue
TD
Actuarial
losses
Total
171,332
−1,701
192,905
−185,620
−21,573
81,607
0.0
293,474 293,474
Actuarial profits
Total
Source: Own based on The Swedish Pension System Annual Report 2002. Ed. O. Settergren,
National Social Insurance Board (Försäkringskassan), Stockholm, Sweden, 2008.
Note: Totals do not necessarily equal the sums of rounded components.
a This does not coincide exactly with the contributions made due to the fact that the pension points will co ntinue to be earned in t he old (DB) system (ATP) until 2018. F rom
then on the value of contributions will equal the value of pension credits, with only small
differences due to administrative reasons.
b This is der ived basically from changes in t he average salary as me asured by the income
index us ed f or indexin g no tional acco unts a nd p ensions (t he la tter wi th t he 1.6%
reduction).
c This is der ived from changes in lif e expectancy as me asured by the so-called economic
divisors. See Appendix 18.A.3.
d The pension balances of deceased persons (inheritance gains arising) are distributed to
survivors of the same age. This distribution is made as a p ercentage increase in pension
balances by an inheritance gain factor. Due t o lags in t he recording and distribution of
inheritance gains and the fact that, for persons over 60, statistically measured rather than
actually inc urred mo rtality is us ed, t here are small dis crepancies b etween inher itance
gains arising and inheritance gains distributed.
The so lvency r atio i ndicator u sed ( Table 18.2) em erges f rom t he A B
sheet and is expressed as
Solvency ratio =
Assets(Financial + Contribution)
Pension liabilities
© 2010 by Taylor and Francis Group, LLC
=
Ft + AC t
ADt + DDt
(18.2)
438 ◾ Pension Fund Risk Management: Financial and Actuarial Modeling
The so lvency r atio u sed i n S weden ha s a d ouble p urpose: t o m easure
whether t he s ystem c an f ulfill i ts o bligations t o i ts co ntributors a nd t o
decide whether the ABM—see Section 18.4—should be applied.
The A B sheet of t he Swedish pens ion s ystem shows t hat t he s ystem
is so lvent i n t he sense t hat, a t t he d ate o f t he ba lance sh eet, t he pen sion l iabilities c an r easonably be co vered b y t he flow of i ncome f rom
contributions. It is therefore clear that if only the obligations had be en
valued, the diagnosis would have been quite different, showing a ba nkrupt, i nsolvent s ystem.* J udging f rom t he ba lance sh eet, co ntributors
and p ensioners h ave re asonable e xpectations t hat t hey w ill re ceive t he
foreseen pensions.
The e volution o f t he so lvency r atio o ver t he la st f ew y ears ha s be en
slightly negative. Should t his t rend continue, t hen t he automatic adjustment mechanism will activate within the next few years. This would be a
real test of the system’s political solidity.
Projections of the system’s possible future evolution are in fact made
in the Swedish pension system’s annual report. A projection is made o f
the ba lance sh eet i tself, o f t he a mount i n t he r eserve o r “ buffer fund”
and the cash deficit or surplus, on the basis of three possible scenarios—
normal, pe ssimistic, a nd o ptimistic—which p rovide va luable i nformation. However, this information is not used in the preparation of the AB
sheet. It would be difficult to justify a r eduction i n pensions i n real or
nominal terms or a decrease in the expected value of contributions made
on the basis of a projection (or projected balance sheet) that may or may
not be accurate.
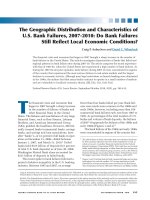
As c an be se en i n Figure 18.1, i n t he ba se sc enario t he ba lance r atio
is never less than one, and the financial position of the system strengthens f rom ye ar to ye ar. A fter 2 037, t he ba lance r atio ex ceeds 1 .1, a l evel
which, as proposed by the government report “Distribution of Surpluses
in the Inkomstpension System,” means that there is a distributable surplus
between contributors and pensioners. In the pessimistic scenario, the balance ratio falls below 1.0 in 2025, and consequently balancing is triggered.
With balancing, the system’s liabilities accrue interest at the same rate as
the growth in the system’s assets. As a result, the balance ratio stabilizes
at around 1.0.
* As Barr and Diamond (2008) point out, any analysis that looks only at future liabilities (i.e.,
future pension payments) while ignoring explicit assets and the implicit asset arising from
the government’s ability to levy taxes is misleading.
© 2010 by Taylor and Francis Group, LLC
Improving the PAYG Pension Systems ◾ 439
%
Balance ratio (historical evolution and scenarios)
1.10
1.09
1.08
1.07
1.06
1.05
1.04
1.03
1.02
1.01
1
0.99
0.98
Historical
Projected
2010
Optimistic
FIGURE 18.1
2001–2082.
2020
2030
Base
2040
Year
Pessimistic
2050
2060
2070
Pessimistic with ABM
Historical a nd p rojected ba lance r atio f or S weden. P eriod
18.3.2 The U.S. Model
The methodology used to compile the AB would best be described as a projection model of aggregate accounting spending on pensions or an actuarial m odel. Ba sically i t i nvolves u sing t he f orecast dem ographic sc enario t o
determine the future evolution of the number of contributors and pensioners
according to the rules of the pension system. The macroeconomic scenario that
determines the amounts of future contributions and pensions is exogenous.
The AB of the U.S. old-age and survivors insurance (OASI) and disability
insurance (DI) social security programs is aimed at measuring the system’s
financial solvency with a 7 5-year time horizon. It measures the difference
in p resent va lue, d iscounted b y t he p rojected y ield o n t rust f und a ssets,
between spending on pensions a nd income from contributions, expressed
as a percentage of the present value of the contribution bases for that time
horizon, taking into account that the level of financial reserves (trust fund)
at t he effective date reaches a m inimum value. The value summarizes the
system’s financial deficit or surplus for the 75-year horizon and only for that
horizon, and it therefore allows for a sharp jump in the contribution rate or
in pension payments at the end of the 75-year period, and the winding-up
of the trust fund on that date. If the balance is negative, the figure can be
interpreted as the increase that would need to be applied to the contribution
rate—immediately from that moment—in order to finance predicted benefits until the end of the 75-year period. The balance can also be expressed
as the decrease in pensions, to be applied immediately, that would be needed
for the contribution rate not to change within the next 75 years.
© 2010 by Taylor and Francis Group, LLC
440 ◾ Pension Fund Risk Management: Financial and Actuarial Modeling
The report from which this AB is compiled is actually much more
detailed. I t co ntains a co mplete a nalysis o f t he a ssumptions u sed, t he
underlying methods a nd t he long-term sens itivity of t he ma in a ssumptions, and a stochastic balance sheet is drawn up too.
According to t he A B on Dec ember 31, 2 007 (see Table 18.4), t he s ystem could regain financial solvency in 75 years if a 1.70-point increase to
TABLE 18.4 Elements of the 75-Year Actuarial Balance under Intermediate
Assumptions (2008–2082) Present Value as of January 1, 2008, in Billions
of Dollarsa
1
2
3 = 1 +2
4
5 = −4 +3
6
7 = 5 +6
8
9= 7 – 8
10
11 = (3 +6)/(10)%
12 = (4 +8)/(10)%
13 = (9/10)%
Details in BOT (2008)
Item
OASDI
Payroll tax revenue
Taxation of benefits revenue
Tax income
Cost
Initial deficit
Trust fund assets at start of
period
Open group unfunded
obligationb
Ending target trust fundc
Results for the periodd
Taxable payroll
Summarized income rate
Summarized cost rate
Deterministic actuarial balance
Deterministic actuarial balance
(TH ∞)
Stochastic AB (TH 75 years)
34,300
2,056
36,357
42,911
−6,555
2,238
−4,316
387
−4,703
276,946
13.94%
15.63%
−1.70%
−3.14%
−1.79%
Source: Board of Trustees, Federal o ld-age a nd sur vivors in surance a nd disability insurance trust funds (BOT), 2007 Annual Report, Government
Printing Office, Washington, DC, 2008 and own.
Note: Totals do not necessarily equal the sums of rounded components.
Bold values are the main elements of the U.S. actuarial balance.
a A billion dollars is equal to $1 × 10⁹, and a billion euros would be 1 × 10¹² €.
A trillion dollars is equal to $1 × 10¹², and a trillion Euros would be the much
greater figure of 1 ×10¹⁸ €.
b Present value of the debt that would have to be incurred to fund the payments
that have been promised, wiping out all the financial assets. This should not be
confused with the implicit debt of the system at a particular date.
c The calculation of the actuarial balance includes the cost of accumulating a target trust fund balance equal to 100% of annual cost by the end of the period.
d This r epresents 32.56% o f GD P in 2008 ($14,445 b illion), o r 0.61% o f t he
present value of the GDPs for the period 2008–2082 ($768.4 trillion).
© 2010 by Taylor and Francis Group, LLC
Improving the PAYG Pension Systems ◾ 441
the contribution rate were to be implemented immediately, applied to taxable earnings. The AB (see Appendix 18.A.4) is the difference between the
summarized income rate and the summarized cost rate over a given valuation per iod. The adjusted summarized income rate (13.94%) equals the
ratio of (a) the sum of the trust fund balance at the beginning of the period
plus the present value of the total income from taxes during the period,* to
(b) the present value of the taxable payroll for the years in the period. The
adjusted summarized cost rate (15.63%) is equal to the ratio of (a) the sum
of the present value of the cost during the period plus the present value of
the targeted ending trust fund level, to (b) the present value of the taxable
payroll during the projection period.
Similarly, all expected payments could be made up to 2082 if an acrossthe-board cut of 11.5% were imposed on benefits or an allocation of $4.3
trillion were made to the “trust fund.” Naturally, a combination of both
these measures could be made i nstead. In terms of t he annual deficit or
surplus, a cash deficit is forecast to appear in 2017 and the reserve fund is
expected to be exhausted in 2041.
The result of t he A B for a per petual t ime horizon i s −3.14%, a nd t he
unbaked liabilities are estimated at 13.6 trillion dollars. The AB estimated
using st ochastic m ethodology f or a 7 5-year t ime h orizon g ives a r esult
of −1.79% f or t he 50 th per centile, u nbaked l iabilities t otal $ 4.6 t rillion,
and the reserve fund is forecast to be exhausted in 2041, that is, everything
is very similar to the result of the determinist AB in the case of intermediate assumptions. The confidence interval of 95% indicates that the value
of the AB swings between −3.52% and −0.28%, and this range is smaller
than would be the case for the best and worst assumptions for the system
(−4.66% y +0.52%).
Figure 18.2 shows in t he second vertical a xis t he evolution of t he A B
over the last 26 years. Although the value of the balance for 2008 is the best
for t he la st 15 years, comparisons between va lues a re not homogeneous
due to the fact that practically every year methodological improvements
are i ncorporated, wh ich p revent d irect co mparison, a lthough de tails o f
the changes and their year-on-year effects are supplied in the report from
which the AB is drawn. Even so, the chart gives an effective summary of
each year’s expectations as to the evolution of the system’s financial health
over the following 75 years.
* This represents 15.49% of GDP in 2008.
© 2010 by Taylor and Francis Group, LLC
442 ◾ Pension Fund Risk Management: Financial and Actuarial Modeling
Historical evolution of OASDI actuarial balance estimates (1982–2008)
16
0.50
15.5
0
15
–0.50
14.5
–1
%
14
13.5
–1.50
13
–2
12.5
12
1982 1984 1986 1988 1990 1992 1994 1996 1998 2000 2002 2004 2006 2008
Year
Income
Costs
–2.50
Actuarial balance
FIGURE 18.2 Historical e volution o f O ASDI A B e stimates ( 1982–2008).
Intermediate assumption.
TABLE 18.5 Past Figures and Forecast Evolution (Intermediate Assumption)
of Some of the Basic OASDI Indicators
Years
Income
Rate (%)
Cost
Rate (%)
Annual
Balance (%)
Contributors/
Beneficiaries
Trust Fund
Ratio (Years)
1990
1995
2000
2005
2007
2010
2020
2030
2040
2050
2060
2070
2080
12.49
12.59
12.69
12.71
12.75
12.82
13.04
13.23
13.23
13.23
13.24
13.26
13.29
10.74
11.67
10.40
11.16
11.26
11.37
14.14
16.41
16.81
16.52
16.69
16.99
17.41
1.75
0.92
2.29
1.55
1.49
1.45
−1.10
−3.18
−3.58
−3.29
−3.45
−3.73
−4.12
3.4
3.3
3.3
3.3
3.3
3.2
2.6
2.2
2.1
2.1
2.1
2.1
2.0
0.75
1.28
2.16
3.18
3.45
3.78
3.61
2.21
0.26
—
—
—
—
Source: Board of Trustees, Federal old-age and survivors insurance and disability insurance
trust funds (BOT), 2007 Annual Report, Government Printing Office, Washington,
D.C., 2008 and own.
Table 18.5 shows t he past a nd forecast evolution for t he intermediate
assumption of some of the key elements that have an effect on determining the AB.
The income rate is the ratio of income from tax revenues on a liability
basis (payroll tax contributions and income from the taxation of scheduled
© 2010 by Taylor and Francis Group, LLC
Improving the PAYG Pension Systems ◾ 443
benefits) to the OASDI taxable payroll for the year. The cost rate for a year
is the ratio of the cost of the program to the taxable payroll for the year.
The annual balance is the difference between the income rate and the cost
rate in a given year. As can be seen in the table, the annual balance worsens considerably in that the ratio of contributors to beneficiaries decreases
due to t he retirement of t he la rge baby-boom generation between about
2010 and 2030. After 2030, increases in life expectancy and the relatively
low fertility rates since the baby boom cause the level of the accumulated
financial reserves to fall noticeably until they become exhausted, as shown
in the value of the “trust fund ratio,” defined as the assets at the beginning
of a year (including advance tax transfers if any) expressed as a percentage of
the cost during the year. The trust fund ratio represents the proportion of a
year’s cost, which could be paid with the funds available at the beginning
of a year.
If no action were taken until the combined trust funds become exhausted
in 2041, then the effects of changes would be more concentrated in fewer
years and fewer cohorts. For example, payroll taxes could be raised to fully
finance scheduled benefits in every year starting in 2041. In this case, the
payroll tax would be increased to 15.94% at the point of trust fund exhaustion in 2041 and continue rising to 16.60% in 2082. Similarly, benefits could
be reduced to the level that is payable with scheduled tax rates in each year
beginning in 2041. Under this scenario, benefits would be reduced by 22% at
the point of trust fund exhaustion in 2041, with reductions reaching 25% in
2082. Either of these examples would eliminate the shortfall for the 75-year
period as a whole by specifically eliminating annual deficits after trust fund
exhaustion. C onsequently, ensu ring t he s ystem’s so lvency be yond 2 082
would probably require further changes beyond those expected to be needed
for 2082. All this can be seen in Figure 18.3.
To summarize, the main differences between the Swedish and U.S. AB
sheets are the following:
1. Projections o f dem ographic, eco nomic, a nd financial va riables a re
made for a 75-year period in the United States, whereas in Sweden a
valuation system based on verifiable facts at the effective date of the
balance sheet is used.
2. In S weden, t he co ntribution a sset i s q uantified f or a h ypothetical
steady st ate der ived f rom p resent eco nomic a nd dem ographic fac tors, while in t he United States contributions are estimated for t he
next 75 years.
© 2010 by Taylor and Francis Group, LLC