The Geographic Distribution and Characteristics of U.S. Bank Failures, 2007-2010: Do Bank Failures Still Reflect Local Economic Conditions? pptx
Bạn đang xem bản rút gọn của tài liệu. Xem và tải ngay bản đầy đủ của tài liệu tại đây (1.04 MB, 22 trang )
FEDERAL RESERVE BANK OF ST
.
LOUIS
RE V I EW
SEPTEMBER
/
OCTOBER
201 0 395
The Geographic Distribution and Characteristics of
U.S. Bank Failures, 2007-2010: Do Bank Failures
Still Reflect Local Economic Conditions?
Craig P. Aubuchon and David C. Wheelock
The financial crisis and recession that began in 2007 brought a sharp increase in the number of
bank failures in the United States. This article investigates characteristics of banks that failed and
regional patterns in bank failure rates during 2007-10. The article compares the recent experience
with that of 1987-92, when the United States last experienced a high number of bank failures. As
during the 1987-92 and prior episodes, bank failures during 2007-10 were concentrated in regions
of the country that experienced the most serious distress in real estate markets and the largest
declines in economic activity. Although most legal restrictions on branch banking were eliminated
in the 1990s, the authors find that many banks continue to operate in a small number of markets
and are vulnerable to localized economic shocks. (JEL E32, G21, G28, R11)
Federal Reserve Bank of St. Louis Review, September/October 2010, 92(5), pp. 395-415.
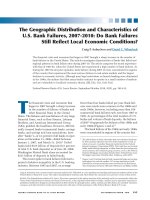
fewer than four banks failed per year. Bank fail-
ures were much more common in the 1980s and
early 1990s, however, including more than 100
commercial bank failures each year from 1987 to
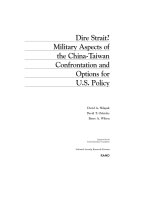
1992. As percentages of the total number of U.S.
banks and volume of bank deposits, the failures
of 2007-10 approach the failures of the 1980s and
early 1990s (Figures 1 and 2).
2
The bank failures of the 1980s and early 1990s
were concentrated in regions of the country that
T
he financial crisis and recession that
began in 2007 brought a sharp increase
in the number of failures of banks and
other financial firms in the United
States. The failures and near-failures of very large
financial firms, such as Bear Stearns, Lehman
Brothers, and American International Group
(AIG), grabbed the headlines. However, 206 fed-
erally insured banks (commercial banks, savings
banks, and savings and loan associations, here-
after “banks”)—or 2.4 percent of all banks in oper-
ation on December 31, 2006—failed between
January 1, 2007, and March 31, 2010.
1
Failed
banks held $373 billion of deposits (6.5 percent
of total U.S. bank deposits) as of June 30, 2006;
Washington Mutual Bank alone accounted for
$211 billion of deposits in failed banks.
The recent spike in bank failures followed a
period of relative tranquility in the U.S. banking
industry. Between 1995 and 2007, on average
1
The 206 failures include only banks that were declared insolvent
by their primary regulator and were either liquidated or sold, in
whole or in part, to another financial institution by the Federal
Deposit Insurance Corporation (FDIC). This total does not include
banks, bank holding companies, or other firms that received govern-
ment assistance but remained going concerns, such as the Federal
National Mortgage Association (Fannie Mae), Federal Home Loan
Mortgage Corporation (Freddie Mac), Citigroup, and GMAC.
2
Figures 1 and 2 include data for both commercial banks and savings
institutions but exclude another 747 savings institutions (with
$394 billion of total assets) that were resolved by the Resolution
Trust Corporation between 1989 and 1995 (Curry and Shibut, 2000).
Craig P. Aubuchon was a senior research associate and David C. Wheelock is a vice president and banking and financial markets adviser at the
Federal Reserve Bank of St. Louis. The authors thank Richard Anderson and Alton Gilbert for comments on a previous version of this article.
©
2010, The Federal Reserve Bank of St. Louis. The views expressed in this article are those of the author(s) and do not necessarily reflect the
views of the Federal Reserve System, the Board of Governors, or the regional Federal Reserve Banks. Articles may be reprinted, reproduced,
published, distributed, displayed, and transmitted in their entirety if copyright notice, author name(s), and full citation are included. Abstracts,
synopses, and other derivative works may be made only with prior written permission of the Federal Reserve Bank of St. Louis.
experienced unusual economic distress. More than
half of all bank failures occurred in Texas alone.
Texas and other energy-producing states experi-
enced high numbers of bank failures following
a sharp drop in energy prices and household
incomes in the mid-1980s. Later, in the early
1990s, New England states had numerous bank
failures when state incomes and real estate prices
declined. Analysts argued that the concentration
of bank failures in regions experiencing high levels
of economic distress reflected the geographically
fragmented structure of the U.S. banking system
in which banks were not permitted to operate
branches in more than one state (e.g., Calomiris,
1992; Horvitz, 1992; Federal Deposit Insurance
Corporation [FDIC], 1997). Bank failures were
especially numerous in Texas and other states
that had long restricted branch banking within
their borders. Many states eased intrastate branch-
ing restrictions during the 1980s, and the Riegle-
Neal Interstate Banking and Branching Efficiency
Act of 1994 subsequently removed federal restric-
tions on interstate branching.
3
Proponents of
deregulation argued that the removal of branch-
ing restrictions would encourage banks to diversify
geographically, which would lessen the impact
of local economic shocks on bank performance.
This article examines the characteristics of
bank failures during 2007-10 and investigates
whether the geographic distribution of failures
reflected differences in local economic condi-
tions. The removal of restrictions on branch
banking, both within and across state lines, has
been followed by substantial consolidation of
the U.S. banking industry. Bank failures and
mergers have reduced the number of U.S. banks
from a postwar peak of 14,496 in 1984 to fewer
Aubuchon and Wheelock
396
SEPTEMBER
/
OCTOBER
201 0
FEDERAL RESERVE BANK OF ST
.
LOUIS
RE V I EW
3
State and federal laws prohibited interstate branching before the
Riegle-Neal Act of 1994, and state laws governed branching within
states. By the 1980s, a few states permitted entry by out-of-state
bank holding companies, usually through the acquisition of an
existing bank. However, holding companies were not permitted to
merge the operations of their subsidiary banks located in different
states. See Spong (2000) for more information about branching
and other U.S. bank regulations.
0.0
0.2
0.4
0.6
0.8
1.0
1.2
1.4
1.6
1.8
2.0
19
8
4
1
985
1
9
8
6
19
8
7
1
988
1
989
1
990
1
99
1
19
9
2
1
9
9
3
1
994
1
99
5
1
99
6
1
99
7
19
98
1
99
9
2
00
0
2
00
1
200
2
2
00
3
2
00
4
2
00
5
200
6
20
07
2
00
8
2
00
9
Percent
Figure 1
Bank Failures as a Percent of Total Banks (annually, 1984-2009)
NOTE: Data include all commercial banks and savings institutions except institutions resolved by the Resolution Trust Corporation.
SOURCE: FDIC Historical Statistics on Banking and authors’ calculations.
than half that number today, and many banks now
operate extensive branching networks. None the -
less, even now most banks have offices in no more
than a few states, and many have offices in just a
single market. Although banks can reduce their
vulnerability to local economic shocks by partic-
ipating in loans made in other markets, investing
in securities, and using other means, the large
number of banks that operate predominantly in a
single market and serve mainly a local clientele
suggests that bank failures are likely to be more
numerous in locations experiencing adverse
economic shocks.
4
We compare the characteristics of failing and
non-failing banks during 2007-10, focusing on
differences in size and branch operations. We
derive state-level bank failure rate measures using
branch-level data, which allows us to capture
the impact of interstate branching on state-level
failure rates. We then investigate the correlation
between state bank failure rates and measures of
state economic conditions, including measures
of distress in housing markets, as well as personal
income growth and unemployment rates. Finally,
we compare our findings for 2007-10 with evi-
dence on bank failures during the 1980s and early
1990s. We find that, as in earlier periods, during
2007-10 bank failure rates typically were higher
in states experiencing more severe economic dis-
tress. Thus, even though most branching restric-
tions were removed more than a decade ago, the
regional patterns of bank failures during 2007-10
indicate that many banks remain vulnerable to
local economic shocks.
Aubuchon and Wheelock
FEDERAL RESERVE BANK OF ST
.
LOUIS
RE V I EW
SEPTEMBER
/
OCTOBER
201 0 397
4
This article does not address why many banks choose not to oper-
ate in more than one market. However, for some banks, the costs of
managing operations in multiple markets might outweigh the poten-
tial benefits of geographic diversification. Emmons, Gilbert, and
Yeager (2004) find that small, community banks could reduce their
failure risk more by simply increasing their size, regardless of where
growth occurs, than by expanding into multiple markets. However,
Berger and DeYoung (2006) find that, over time, advances in
information-processing technology have reduced the costs of man-
aging far-flung operations, suggesting that banks increasingly will
find it advantageous to operate in multiple markets.
0.0
0.5
1.0
1.5
2.0
2.5
3.0
Deposits of All Failed Banks
Deposits of All Failed Banks Excluding Washington Mutual Bank
Percent
19
8
4
1
985
1
9
8
6
19
8
7
1
988
1
989
1
990
1
99
1
19
9
2
1
9
9
3
1
994
1
99
5
1
99
6
1
99
7
19
98
1
99
9
2
00
0
2
00
1
200
2
2
00
3
2
00
4
2
00
5
200
6
20
07
2
00
8
2
00
9
Figure 2
Percentage of U.S. Bank Deposits in Failed Banks (annually, 1984-2009)
NOTE: Data include all commercial banks and savings institutions except institutions resolved by the Resolution Trust Corporation.
SOURCE: FDIC Historical Statistics on Banking and authors’ calculations.
The next section profiles U.S. bank failures
during 2007-10. First, we briefly describe the
failures and near-failures of very large financial
organizations that succumbed to the collapse of
the U.S. housing and mortgage markets. We then
focus explicitly on commercial bank and savings
institution failures and compare failing and non-
failing banks in terms of size and branching
characteristics. We similarly compare failing and
non-failing commercial banks during 1987-92.
Subsequently, we derive state-level bank failure
rates and investigate the correlation between fail-
ure rates and measures of the housing boom and
subsequent bust, as well as other measures of state
economic conditions. Again, we compare the
recent experience with that of 1987-92. The final
section summarizes our findings and conclusions.
PROFILE OF BANKS THAT FAILED
DURING 2007-10
Large Financial Institution Failures
and Near-Failures
The recent financial crisis and recession was
punctuated by several high-profile financial fail-
ures and near-failures. This article focuses on the
failures of commercial banks and savings institu-
tions. However, we briefly describe the failures
and near-failures of some other large financial
firms during the financial crisis and recession of
2007-10. The financial crisis was triggered when
the housing boom ended and house prices began
to fall in many markets. By 2006-07, falling house
prices had led to rising home mortgage delin-
quency rates, which lowered the profits of mort-
gage lenders, such as Countrywide Financial
Corporation, Washington Mutual Corporation,
and GMAC, Incorporated. All three of these bank
holding companies incurred enormous losses on
the mortgage portfolios of their subsidiary banks.
Countrywide was acquired by Bank of America
in 2008. Washington Mutual was declared insol-
vent and closed by the Office of Thrift Supervision
in September 2008. JPMorgan Chase later acquired
the banking operations of Washington Mutual in
a transaction facilitated by the FDIC.
5
GMAC
remains a going concern, but to date has received
a total of $17.2 billion of government support
under the Troubled Asset Relief Program (TARP).
6
Other casualties of the collapse of house
prices and rise in mortgage delinquencies included
Bear Stearns and Company, Lehman Brothers,
Federal National Mortgage Association (Fannie
Mae), Federal Home Loan Mortgage Corporation
(Freddie Mac), American International Group
(AIG), and several large bank holding companies,
including Citigroup, Bank of America, Wachovia
Corporation, and National City. Bear Stearns and
Lehman Brothers were investment banks that
invested heavily in mortgage-backed securities
for their own accounts and for hedge funds they
created and marketed to other investors. The val-
ues of mortgage-backed securities fell when sub-
prime mortgage delinquency rates began to rise
in 2007 and hedge funds and other investors in
subprime mortgages experienced substantial
losses. The hedge funds created by Bear Stearns
were among the largest and most prominently
affected. At first, Bear Stearns covered the losses
in its hedge funds, but eventually the funds
declared bankruptcy. Bear Stearns itself faced
bankruptcy in March 2008 when the firm’s cred-
itors refused to renew short-term loans to the firm.
The Federal Reserve prevented a bankruptcy filing
by creating a special-purpose vehicle (Maiden
Lane, LLC) that invested in $30 billion of mortgage-
backed securities held by Bear Stearns, which
facilitated the acquisition of Bear Stearns by
JPMorgan Chase.
7
By contrast, when the creditors
of Lehman Brothers were no longer willing to lend
to the firm, the Fed determined that Lehman
Aubuchon and Wheelock
398
SEPTEMBER
/
OCTOBER
201 0
FEDERAL RESERVE BANK OF ST
.
LOUIS
RE V I EW
5
See the FDIC press release, “JPMorgan Chase Acquires Banking
Operations of Washington Mutual”
(www.fdic.gov/news/news/press/2008/pr08085.html).
6
The TARP was established by the Emergency Economic Stabili za -
tion Act (HR 1424), which President George W. Bush signed into
law on October 3, 2008. The nine largest U.S. bank holding com-
panies were all required to accept government capital under the
program. Other banks could apply for capital under the TARP, but
only those deemed viable by their primary regulator were eligible
to receive capital. Of some 650 banks that received TARP capital,
only three subsequently failed before March 31, 2010. These three
banks constituted just 1.6 percent of the total number of bank fail-
ures between October 1, 2008, and March 31, 2010.
7
Details of this transaction are available on the website of the Federal
Reserve Bank of New York (www.newyorkfed.org/newsevents/
news/markets/2008/rp080324.html).
lacked sufficient assets to serve as collateral for
a rescue loan and the firm was forced to file for
bankruptcy in September 2008.
Fannie Mae and Freddie Mac are government-
sponsored enterprises that provide support for
the housing market by purchasing home mortgages
from loan originators. As government-sponsored
corporations, Fannie Mae and Freddie Mac tradi-
tionally enjoyed lower borrowing costs than most
private firms because many investors believed
that the federal government would stand behind
the firms’ debts even though they were privately
held companies. Their implicit federal guarantees
allowed Fannie Mae and Freddie Mac to become
highly leveraged by borrowing heavily to invest
in large portfolios of mortgages and mortgage-
backed securities. Both firms grew rapidly during
the past decade and became significant purchasers
of nonprime mortgage-backed securities (Leonnig,
2008; Greenspan, 2010). The increase in subprime
mortgage delinquency rates and decline in the
value of subprime mortgage-backed securities
quickly eroded the thin capital of both firms,
and they were placed under federal government
conservatorship in September 2008.
8
Since then,
the firms have required billions of dollars of cap-
ital from the federal government to remain going
concerns.
AIG is a large financial conglomerate with
global operations. The traditional business of AIG
is insurance—automobile, life, and so on. AIG
also owns a federally chartered savings bank (AIG
Bank, FSB). AIG’s unregulated activities, notably
the underwriting of credit default insurance, pro-
duced substantial losses when the housing market
slumped badly in 2007-08. These unregulated
operations had grown so large that government
officials feared that AIG’s sudden collapse could
impose severe losses on other firms and seriously
impair the functioning of the entire financial
system. To avoid this outcome the U.S. Treasury
and Federal Reserve provided AIG with loans
and a capital injection in October 2008 when it
appeared that the firm would default on its out-
standing debts.
9
Washington Mutual Bank, a federally char-
tered savings bank with some $300 billion of
assets, was declared insolvent by the Office of
Thrift Supervision in September 2008 and placed
under the receivership of the FDIC. No other bank
with more than $100 billion of assets was liqui-
dated or sold by the FDIC during 2007-10. How -
ever, among other large bank holding companies,
both Citigroup and Bank of America received
special assistance from the federal government
in the form of capital, portfolio guarantees, and
liquidity access; and Wachovia and National City
were acquired by other bank holding companies
when it became clear that neither remained viable
on its own. In providing capital and guarantees
to Citigroup, Bank of America, and AIG, as well
as assistance to facilitate the acquisition of trou-
bled firms such as Bear Stearns, the Federal
Reserve and Treasury Department sought to pro-
mote stability of the financial system by avoiding
possible systemic repercussions should such a
large financial firm fail or declare bankruptcy.
10
Comparison of Failed and Non-Failing
Commercial Banks and Savings
Institutions
Next we focus on the characteristics of com-
mercial banks and savings institutions that were
declared insolvent by their primary regulator and
whose deposits were either liquidated or sold to
another institution by the FDIC. With some $300
billion of assets and $189 billion of deposits when
it was closed by the Office of Thrift Supervision,
Washington Mutual Bank was by far the largest
bank failure in U.S. history. Only five banks had
more assets than Washington Mutual when it
failed, and Washington Mutual was nearly 10
times larger in terms of total assets than the next-
largest bank to fail between January 2007 and
March 2010.
11
Aubuchon and Wheelock
FEDERAL RESERVE BANK OF ST
.
LOUIS
RE V I EW
SEPTEMBER
/
OCTOBER
201 0 399
8
See “Statement by Secretary Henry M. Paulson, Jr. on Treasury
and Federal Housing Finance Agency Action to Protect Financial
Markets and Taxpayers”
(www.ustreas.gov/press/releases/hp1129.htm).
9
See the Board of Governors’ October 8, 2008, press release
(www.federalreserve.gov/newsevents/press/other/20081008a.htm).
10
See Bullard, Neely, and Wheelock (2009) for a discussion of systemic
risk and the financial crisis of 2008-09.
11
JPMorgan Chase, Bank of America, Citibank, Wachovia Bank, and
Wells Fargo Bank had more total assets than Washington Mutual
at the time of its failure.
Between January 1, 2007, and March 31, 2010,
206 commercial banks and savings institutions
(savings banks and savings and loan associations,
hereafter “thrifts”) were declared insolvent by
their primary regulator and either closed or sold,
in whole or in part, to another institution.
12
This
total includes Washington Mutual but does not
include AIG, Bank of America, Citigroup, Fannie
Mae, Freddie Mac, GMAC, and other firms that
received special government assistance in the form
of loans, guarantees, or capital injections to avoid
failure. It also does not include Bear Stearns or
Lehman Brothers, which were not depository
institutions or bank holding companies, and it
does not include Countrywide Financial Corp -
oration, National City Corporation, Wachovia
Corporation, and other financially troubled bank
or thrift holding companies that were acquired
by other banks without government assistance.
Table 1 provides summary information for
banks and thrifts that failed (i.e., were closed by
bank regulators) between January 2007 and March
2010, along with similar information for non-
failing institutions. The summary information
is based on data for individual banks as of June
2006.
13
We exclude eight banks that were char-
tered after June 2006 and failed between January
2007 and March 2010. Of the remaining 198 fail-
ures, 162 held commercial bank charters, 33 were
savings banks, and 3 were savings and loan associ-
ations.
14
The smallest bank that failed held $11
million of assets and $5 million of deposits (as
of June 2006), whereas the largest (Washington
Mutual Bank) held $350 billion of assets and
$211 billion of deposits. Washington Mutual
operated 2,213 branches in 15 states when it
was closed on September 25, 2008 (it had 2,167
branches in 15 states on June 30, 2006).
Most banks that failed between 2007 and 2010
were much smaller than Washington Mutual
both in total assets and deposits and in numbers
of branches and numbers of states with branch
offices. The mean total assets and deposits of fail-
ing banks other than Washington Mutual were
$1.2 billion and $824 million, respectively.
Reflecting the highly skewed distribution of bank
assets, median assets and deposits were much
smaller, at $263 million and $204 million, respec-
tively. By comparison, among non-failing banks,
mean total assets and deposits were $1.2 billion
and $695 million, respectively, and median total
assets and deposits were $119 million and $97
million.
15
Thus, among failed banks other than
Washington Mutual, mean total assets and deposits
of failing banks were similar to those of non-failing
banks, but median assets and deposits were con-
siderably larger than those of non-failing banks.
Figure 3 shows kernel density plots for the
natural log (ln) of total assets of failing and non-
failing banks during 2007-10, based on data for
June 2006. The figure shows that the banks and
thrifts that failed during 2007-10 tended to be
larger than non-failing institutions over the range
of asset sizes most commonly observed (though
as noted, five non-failing banks held more total
assets than Washington Mutual). By contrast,
during the wave of bank failures of the late 1980s
and early 1990s, the commercial banks that failed
tended to be smaller than non-failing commercial
banks (Figure 4).
16
Figure 5 shows kernel density plots for the
natural log (ln) of total assets for failed commercial
banks, failed savings institutions, and non-failing
banks (both commercial banks and savings insti-
tutions) as of June 2006. As shown, savings insti-
tutions that failed between 2007 and 2010 tended
to be much larger than both commercial banks
that failed and non-failing banks. Thrifts tend to
specialize in home mortgage lending, and many
grew rapidly during the housing boom. Several
Aubuchon and Wheelock
400
SEPTEMBER
/
OCTOBER
201 0
FEDERAL RESERVE BANK OF ST
.
LOUIS
RE V I EW
12
A list of failed banks since 2000 is available from the FDIC
(www.fdic.gov/bank/individual/failed/banklist.html).
13
Our data are from the Summary of Deposits
(www2.fdic.gov/sod/index.asp), which provides branch-level
information.
14
Of the 162 commercial banks that failed, 109 were state-chartered
non–Federal Reserve member banks, 21 were state-chartered
Federal Reserve members, and 32 were national banks.
15
Data for non-failing banks include banks that were acquired after
June 2006 and banks that survived through March 2010.
16
As noted previously, our data for 2007-10 include both commercial
banks and savings institutions. However, comparable data on sav-
ings institution failures are not available for the late 1980s and early
1990s and, hence, the densities shown in Figure 4 for 1987-92 are
based exclusively on data for commercial banks.
Aubuchon and Wheelock
FEDERAL RESERVE BANK OF ST
.
LOUIS
RE V I EW
SEPTEMBER
/
OCTOBER
201 0 401
Table 1
Descriptive Statistics, Failed Banks January 2007—March 2010 (based on data for 2006:Q2)
T
otal assets Total deposits
Type of bank ($ thousands) ($ thousands) totbr tot_zipbr tot_cntybr tot_statebr
F
ailed banks
N 198 198 198 198 198 198
Min 11,073 5,161 1111
Max 350,890,182 210,626,236 2,167 1,746 82 15
Mean 2,999,689 1,883,978 21.0 17.8 3.6 1.3
Q1 100,486 80,662 1111
Median 265,800 210,198 4321
Q3 693,429 579,578 8731
SD 25,079,179 15,054,713 155.8 126.0 7.8 1.2
Failed banks
(excluding Washington Mutual)
N 197 197 197 197 197 197
Min 11,073 5,161 1111
Max 22,962,845 16,242,689 301 267 52 6
Mean 1,233,748 824,373 10.1 9.0 3.2 1.2
Q1 100,486 80,662 1111
Median 262,721 204,070 4321
Q3 690,828 575,772 8731
SD 3,398,678 2,087,900 28.0 25.2 5.5 0.7
Non-failing banks
N 8,307 8,307 8,307 8,307 8,307 8,307
Min 1,205 01 1 1 1
Max 1,160,260,442 563,906,844 5,781 4,124 177 30
Mean 1,244,305 694,999 10.8 8.3 2.7 1.1
Q1 56,366 46,301 1111
Median 119,175 97,474 3211
Q3 281,289 226,378 6521
SD 21,858,396 9,775,712 99.3 70.3 6.4 0.9
NOTE: N, number of observations; Q1 and Q3, first and third quartiles, respectively; SD, standard deviation; totbr, total number of
branches; tot_zipbr, total number of unique zip codes; tot_cntybr, total number of counties; tot_statebr, total number of states in
which a bank operates at least one branch.
Aubuchon and Wheelock
402
SEPTEMBER
/
OCTOBER
201 0
FEDERAL RESERVE BANK OF ST
.
LOUIS
RE V I EW
0
.3
0
.2
0.1
0.0
10
15 20
D
ensity
F
ailed Banks (n = 198)
Non-Failing Banks (n = 8,307)
(ln) Total Assets
Kernel Density Plot of (ln) Total Assets for Bank Failures (2007:Q1–2010:Q1)
Figure 3
Size Distribution of Banks (2006:Q2)
0.4
0.2
0.1
0.0
10.0
15.0 17.5
Density
Failed Banks (n = 884)
Non-Failing Banks (n = 13,205)
(ln) Total Assets
Kernel Density Plot of (ln) Total Assets for Bank Failures (1987:Q1–1992:Q1)
0.3
7.5
12.5
Figure 4
Size Distribution of Commercial Banks (1986:Q2)
NOTE: Densities shown are based exclusively on data for commercial banks.
large thrifts failed when house prices began to
fall and mortgage delinquencies rose.
Table 2 lists the 20 largest failed banks in
terms of total assets on June 30, 2006. Of the 20
largest failures, 11, including Washington Mutual
Bank, were savings institutions. Of the 36 thrifts
that failed during 2007-10, 16 (44 percent) had at
least $1 billion of assets. By contrast, of the 162
commercial banks that failed, only one (Colonial
Bank of Montgomery, Alabama) had more than
$10 billion of assets, and only 22 (14 percent) had
more than $1 billion of assets. As noted previously,
in a few cases the federal government intervened
to ensure that a very large, systemically significant
commercial bank would not fail. In addition,
several thrifts experienced large declines in total
assets in the months between June 2006 and their
failure dates.
Next we compare failed and non-failing banks
on the basis of the number and location of branch
offices. The sharp increase in bank failures during
the 1980s and the apparent vulnerability of banks
to sudden changes in local economic conditions
led many states and, ultimately, the federal govern-
ment to relax restrictions on branch banking.
17
Branching proponents argue that geographic
restrictions on bank location contribute to banking
system instability by making it more costly for
banks to diversify or exploit economies of scale.
18
Although banks can achieve geographic diversi-
fication through loan participations, brokered
deposits, and other techniques, most banks served
mainly a local loan and deposit market before
branching restrictions were relaxed.
Branching deregulation promoted a substantial
consolidation of the U.S. banking industry and
the advent of banks with interstate branches. The
largest U.S. banks operate thousands of branch
offices across several states. For example, as of
June 30, 2009, Bank of America had 6,173 branches
in 35 states and JPMorgan Chase operated 5,229
Aubuchon and Wheelock
FEDERAL RESERVE BANK OF ST
.
LOUIS
RE V I EW
SEPTEMBER
/
OCTOBER
201 0 403
0
.3
0.2
0.1
0.0
10
15 20
D
ensity
F
ailed Commercial Banks (n = 162)
Non-Failing Banks (n = 8,307)
(ln) Total Assets
Kernel Density Plot of (ln) Total Assets for Bank Failures (2007:Q1–2010:Q1)
F
ailed Savings Institutions (n = 36)
Figure 5
Size Distribution of Commercial Banks (2006:Q2)
17
Kroszner and Strahan (1999) and Garrett, Wagner, and Wheelock
(2005) examine the determinants of state branching deregulation.
18
See Wheelock and Wilson (2009) and references therein for recent
estimates of scale economies in banking.
Aubuchon and Wheelock
404
SEPTEMBER
/
OCTOBER
201 0
FEDERAL RESERVE BANK OF ST
.
LOUIS
RE V I EW
Table 2
Largest 20 Bank Failures January 2007—March 2010
Total assets Total deposits Total Total states Entity
Bank name City State ($ Thousands) ($ Thousands) branches with a branch type
Washington Mutual Bank, FSB Henderson Nevada 350,890,182 210,626,236 2,167 15 S
Colonial Bank, National Association Montgomery Alabama 22,962,845 16,242,689 301 5 C
IndyMac Bank, FSB Pasadena California 22,743,262 9,575,579 26 1 S
Downey Savings and Loan Association Newport Beach California 17,464,594 11,936,431 172 2 S
Guaranty Bank Austin Texas 16,920,624 9,362,598 152 2 S
Ohio Savings Bank, FSB* Cleveland Ohio 16,605,531 11,188,582 56 3 S
BankUnited, FSB Coral Gables Florida 12,866,372 6,014,740 73 1 S
First Federal Bank of California, FSB Santa Monica California 10,256,842 5,542,113 32 1 S
Corus Bank, National Association Chicago Illinois 9,369,988 8,320,397 14 1 C
United Commercial Bank San Francisco California 8,280,022 5,497,301 47 4 C
Irwin Union Bank and Trust Co. Columbus Indiana 6,020,353 3,412,938 24 4 C
California National Bank Los Angeles California 5,518,094 4,573,222 66 1 C
Franklin Bank Houston Texas 5,091,755 2,533,644 36 1 S
PFF Bank and Trust Pomona California 4,382,916 3,140,649 30 1 S
NetBank Alpharetta Georgia 4,151,957 2,726,334 1 1 S
Park National Bank Chicago Illinois 3,573,050 2,931,298 26 1 C
Imperial Capital Bank La Jolla California 3,202,090 1,834,731 9 2 C
La Jolla Bank, FSB La Jolla California 2,773,055 1,532,533 10 2 S
San Diego National Bank San Diego California 2,356,452 2,055,567 21 1 C
Orion Bank Naples Florida 2,080,071 1,511,496 17 1 C
NOTE: Data are from the June 30, 2006, FDIC Summary of Deposits. S, savings institution; C, commercial bank. *On the date of its failure, Ohio Savings Bank was known as
Amtrust.
branches in 26 states. To the extent that branching
has facilitated geographic diversification or scale
economies, the U.S. banking system should be
less vulnerable to local economic shocks than in
the past.
19
Although the recent downturn in U.S.
house prices and economic recession affected
most of the country, the extent to which house
prices and personal incomes fell varied widely
across state and local markets. Hence, branching
may have afforded banks some protection against
downturns in local real estate markets and eco-
nomic activity.
The opportunity to operate branches in differ-
ent banking markets clearly does not insulate
banks from local economic downturns if they
choose not to diversify across markets. Heavy
investment in nonprime mortgages and mortgage-
backed securities produced significant losses for
many large banks with extensive branching net-
works, such as Washington Mutual. Most banks
that failed during 2007-10 operated far fewer
offices than Washington Mutual. As shown in
Table 1, the median number of branches operated
by banks that failed during 2007-10, other than
Washington Mutual, was four. Further, most banks
that failed had branches over only a limited geo-
graphic area: The median failed bank operated
branches in just three zip codes across two coun-
ties in a single state. A lack of widespread branch-
ing is not, however, a distinguishing characteristic
of banks that failed. The median non-failing bank
operated only three branches located in two zip
codes in a single county in a single state.
STATE BANK FAILURE RATES
The advent of interstate branch banking has
made it more difficult to discern the relationship
between changes in local economic conditions
and bank performance. However, as noted previ-
ously, most banks continue to operate in a limited
number of banking markets in a single state.
Hence, it remains interesting to consider the
extent to which bank failures are associated with
changes in local or regional economic conditions.
We identified the home state of every bank that
failed between January 1, 2007, and March 31,
2010, and calculated state-level failure rates as
(i) the ratio of the number of banks headquartered
in a state that failed to the total number of banks
headquartered in that state as of June 30, 2006;
and (ii) the ratio of the deposits held by failed
banks in a state to the total amount of deposits
held by all banks in that state as of June 30, 2006.
We used annual branch-level data on total deposits
for all U.S. banks to calculate the deposits-based
failure rate.
20
This measure captures the influence
on a state’s failure rate of the deposits in branches
of banks that are headquartered in another state.
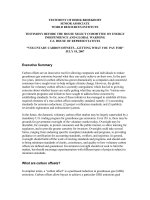
Figure 6 shows the distribution of the failure
rate (ratio of failed to total banks) across U.S.
states. Georgia had the highest number of failures,
with 36 (of 346 banks), but Nevada experienced
the highest failure rate, with 5 of 28 banks failing.
Arizona, California, and Oregon also had failure
rates of at least 8.5 percent. Fif teen states had
no bank failures during this period, including
six states in the Northeast (Delaware, Maine,
Massachusetts, New Hampshire, Rhode Island,
and Vermont), four southeastern states (Kentucky,
Mississippi, South Carolina, and Tennessee),
and two Great Plains states (Montana and North
Dakota).
Figure 7 shows the distribution of the deposits-
based failure rate measure across states. The
impact of interstate branching and differences in
the sizes of failed banks across states is apparent.
For example, only two small banks chartered in
New York failed, giving the state a bank failure
rate of only 0.99 percent. However, because of
the failure of Washington Mutual Bank, which
operated 209 branches with some $15 billion of
deposits in New York, 1.95 percent of the state’s
bank deposits were in banks that failed. California,
Nevada, and Washington are other states for which
Aubuchon and Wheelock
FEDERAL RESERVE BANK OF ST
.
LOUIS
RE V I EW
SEPTEMBER
/
OCTOBER
201 0 405
19
However, as discussed in more detail below, branching regula-
tions and other restrictions on market entry may have enhanced
the charter values of existing banks and thereby encouraged them
to assume less risk than banks in perfectly competitive markets.
Hence, the relationship between branching restrictions and bank
failures is ultimately an empirical question.
20
Our branch-level data on deposits are from the Summary of
Deposits database, which is maintained by the FDIC
(www2.fdic.gov/sod/index.asp). The appendix presents defini-
tions and source information for all variables and data used in
this article.
the failure of Washington Mutual caused the per-
centage of deposits in failed banks to exceed the
state’s bank failure rate. Similarly, the failure of a
single large bank (Corus Bank National Associa -
tion) caused Illinois to have a relatively high per-
centage of deposits in failed banks compared with
the state’s bank failure rate. By contrast, Georgia
had a relatively low percentage of deposits in
failed banks, despite a high failure rate based on
the number of failed banks, because most of the
banks that failed in Georgia were small.
STATE BANK FAILURE RATES
AND ECONOMIC CONDITIONS
The recent decline in U.S. house prices was
the largest and most widespread since the Great
Depression. Mortgage delinquency rates rose
throughout the United States and were a proxi-
mate cause of the financial crisis and recession.
The decline in U.S. house prices was particularly
problematic for savings institutions—entities
that historically have focused on residential mort-
gage lending. However, many commercial banks
have increased their real estate lending in recent
years because of increased competition in com-
mercial lending and apparent profit opportunities
in real estate lending.
21
For example, between
December 31, 1996, and December 31, 2006, real
estate loans (both residential and commercial)
rose from 39.5 percent to 57.4 percent of total U.S.
21
Small, community banks traditionally have dominated small busi-
ness lending, where close proximity and personal relationships
have been important for ascertaining the creditworthiness of poten-
tial borrowers. However, advances in information-processing
technology have increased competition in local bank markets by
making quantifiable information about potential borrowers more
readily available (Petersen and Rajan, 2002). In addition, the eas-
ing of branching restrictions and other entry barriers increased
competition in local banking markets.
Aubuchon and Wheelock
406
SEPTEMBER
/
OCTOBER
201 0
FEDERAL RESERVE BANK OF ST
.
LOUIS
RE V I EW
<1%
1-5%
5-10%
10-15%
>15%
Figure 6
Bank Failure Rates (2007-10)
commercial bank loans while commercial and
industrial loans fell from 25.2 percent to 19.0
percent of total loans.
22
Although house prices fell throughout the
United States, distress in housing and mortgage
markets was especially acute in states that had
experienced large increases in house prices in
preceding years. Correlations reported in Table 3
show that states with large increases in house
prices between 2003:Q3 and 2007:Q1, as meas-
ured by the state-level Federal Housing Finance
Agency (FHFA) House Price Index, also tended
to have (i) relatively high percentages of subprime
home mortgages as of 2006:Q4, (ii) large increases
in subprime mortgages as a percentage of all resi-
dential mortgages between 2003 and 2006, and
(iii) rapid growth in total real estate loans (resi-
dential and commercial) between 2003 and
2006.
23
Further, these states tended to have the
largest declines in house prices between 2007:Q1
and 2009:Q4.
Table 4 reports correlations of the number of
bank failures and the two failure rate measures
with various measures of state-level economic
conditions. As shown, the two failure rate meas-
ures are highly correlated with the percentage
change in house prices during both the period of
rising house prices (2003:Q3–2007:Q1) and the
period of falling prices (2007:Q1–2009:Q4). State
Aubuchon and Wheelock
FEDERAL RESERVE BANK OF ST
.
LOUIS
RE V I EW
SEPTEMBER
/
OCTOBER
201 0 407
<1%
1-5%
5-10%
10-20%
>20%
Figure 7
Percentage of Deposits in Failed Banks (2007-10)
22
These calculations are based on data from the FDIC Statistics on
Banking for all U.S. commercial banks (www2.fdic.gov/SDI/SOB/).
23
State-level data on real estate loans attribute all of a bank’s loans
to the state in which the bank is headquartered. Branch-level loan
data are not available. We report data for all insured commercial
banks, trust companies, and savings institutions as provided by
the FDIC. State-level delinquency rates measure the percent of all
mortgages past due (not including mortgages in the foreclosure
process), as reported by the Mortgage Bankers Association National
Delinquency Survey. Similarly, data for the number of conventional
subprime loans are from the Mortgage Bankers Association. See
the appendix for additional information.
Aubuchon and Wheelock
408
SEPTEMBER
/
OCTOBER
201 0
FEDERAL RESERVE BANK OF ST
.
LOUIS
RE V I EW
Table 3
Correlation of State-Level Economic Variables
Variable (1) (2) (3) (4) (5) (6) (7) (8) (9) (10) (11)
(1) Percentage change in the FHFA House Price 1.00
Index (2003:Q3–2007:Q4)
(2) Percentage change in the FHFA House Price –0.68 1.00
Index (2007:Q1–2009:Q4) (0.00)
(3) Percentage change in the level of gross loans 0.19 –0.31 1.00
secured by real estate for all insured commercial (0.18) (0.03)
banks, trusts, and savings institutions (2002-06),
annual data-year end
(4) Ratio of subprime mortgages to all mortgages 0.20 –0.59 0.11 1.00
(2006:Q4) (0.16) (0.00) (0.43)
(5) Change in the ratio of subprime mortgages 0.31 –0.53 0.20 0.69 1.00
to all mortgages (2003:Q3–2006:Q4) (0.03) (0.00) (0.16) (0.00)
(6) Change in the mortgage delinquency rate 0.46 –0.83 0.27 0.75 0.65 1.00
(all loans) (2009:Q4–2007:Q1) (0.00) (0.00) (0.06) (0.00) (0.00)
(7) Change in the unemployment rate 0.31 –0.63 0.14 0.58 0.52 0.77 1.00
(2009:Q4–2006:Q4) (0.03) (0.00) (0.33) (0.00) (0.00) (0.00)
(8) Percent change in real per capita income –0.19 0.56 –0.15 –0.57 –0.49 –0.62 –0.61 1.00
(2005 $) (2006-09), annual data (0.18) (0.00) (0.31) (0.00) (0.00) (0.00) (0.00)
(9) Percent change in nominal gross state product –0.13 0.54 0.16 –0.58 –0.34 –0.62 –0.67 0.62 1.00
(2006-08), annual data (0.37) (0.00) (0.27) (0.00) (0.01) (0.00) (0.00) (0.00)
(10) Change in the ratio of business bankruptcies 0.15 –0.15 0.06 0.11 0.10 0.18 0.19 –0.29 –0.25 1.00
to all establishments (2007-09) (0.29) (0.23) (0.68) (0.47) (0.51) (0.22) (0.20) (0.04) (0.08)
(11) Branching Restriction Indicator (2006), –0.11 0.14 0.14 –0.21 –0.21 –0.13 –0.12 –0.15 0.23 0.15 1.00
0 (no restriction) to 4 (highest restrictions) (0.46) (0.33) (0.32) (0.14) (0.14) (0.38) (0.40) (0.30) (0.11) (0.34)
NOTE: Numbers in parentheses represent p values indicating the statistical significance of the correlation coefficients.
failure rates are also highly positively correlated
with the percentage of subprime mortgages in
2006, the growth in the percentage of subprime
mortgages between 2003 and 2006, and the per-
centage increase in total real estate loans between
2003 and 2006. States that experienced the largest
increases in house prices during the boom, or the
largest declines during the bust, had the highest
bank failure rates, as did those with the most rapid
growth in subprime mortgage loans and total real
estate loans. Not surprisingly, since the delin-
quency rates on subprime mortgages are much
higher than those on prime loans, state bank fail-
ure rates are also highly positively correlated with
the increase in residential mortgage loan delin-
quency rates between 2006 and 2009.
24
Many states with large declines in house
prices also experienced relatively large declines
in personal income and gross state product and
relatively large increases in unemployment rates.
For example, Florida and Arizona were the only
states where real per capita personal income fell
more than 7 percent between 2006 and 2009;
along with Nevada and California, they were the
only states where the decline in house prices
between 2007 and 2009 exceeded 30 percent.
Aubuchon and Wheelock
FEDERAL RESERVE BANK OF ST
.
LOUIS
RE V I EW
SEPTEMBER
/
OCTOBER
201 0 409
24
Distress in commercial real estate markets has frequently been
cited as another cause of losses and bank failures during 2007-10
(e.g., Bair, 2010; Wutkowski, 2009). State-level data on commercial
real estate market conditions are not available; historically, how-
ever, many bank failures have been associated with downturns in
commercial real estate markets (FDIC, 1997).
Table 4
Correlation of Bank Failures (Rates) and Local Economic Conditions (2007-10)
F
ailure measure
Variable nfail_2010 failrt_06 dep_failrt06
House Price Index percent change (2003:Q3–2007:Q1) 0.09 0.50 0.41
(0.53) (0.00) (0.00)
House Price Index percent change (2007:Q1–2009:Q4) –0.37 –0.68 –0.61
(0.01) (0.00) (0.00)
Percent change in gross loans secured by real estate (2002-06) –0.02 0.48 0.72
(commercial and savings banks) (0.91) (0.00) (0.00)
Percent of subprime to all mortgages (2006:Q4) 0.24 0.40 0.40
(0.09) (0.00) (0.00)
Increase in percent of subprime mortgages (2003:Q3–2006:Q4) 0.28 0.47 0.40
(0.05) (0.00) (0.00)
Change in mortgage delinquency rate (2009:Q4–2007:Q1) 0.44 0.65 0.60
(0.00) (0.00) (0.00)
Percent change in real per capita income (2006-09) –0.40 –0.58 –0.41
(0.00) (0.00) (0.00)
Percent change in gross state product (2006-08) –0.23 –0.18 –0.11
(0.11) (0.20) (0.46)
Change in bankruptcy ratio (2007-09) 0.01 0.07 0.07
(0.95) (0.65) (0.61)
Change in unemployment rate (2009:Q4–2006:Q4) 0.40 0.51 0.48
(0.00) (0.00) (0.00)
Branching restriction (2006) 0.10 0.15 0.16
(0.49) (0.30) (0.27)
NOTE: Numbers in parentheses represent p values indicating the statistical significance of the correlation coefficients. Failure measure
definitions: nfail_2010, number of bank failures (2007–2010:Q1); failrt_06, number of bank failures (2007-10) divided by total banks in
2006:Q2; dep_failrt06, ratio of deposits of failed banks (2007-10) to total deposits (2006:Q2) calculated at the branch level.
Similarly, Michigan had the smallest increase in
gross state product between 2006 and 2008 and
had the fifth-largest decline in house prices, 17
percent, behind Arizona, California, Florida, and
Nevada. As shown in Table 4, bank failure rates
were higher in states that experienced relatively
large declines in real per capita personal income
or nominal gross state product between 2006 and
2008 (though the correlations with gross state
product are not statistically significant), and rela-
tively large increases in the unemployment rate
between 2006:Q4 and 2009:Q4. We found no
correlation, however, between bank failure rates
and changes in business bankruptcy rates between
2007 and 2009.
25
Lastly, we investigated the association
between market entry restrictions on banks and
state bank failure rates. As noted previously, many
states relaxed restrictions on branching and began
to permit entry by out-of-state bank holding com-
panies during the 1970s and 1980s, and a federal
prohibition on interstate branching was removed
in 1994. However, several states retained limits
on entry, such as caps on the share of a state’s
deposits that a single bank can hold and require-
ments that a bank seeking to enter a new market
must do so by acquiring an existing bank. Rice
and Strahan (2010) find that these types of entry
barriers reduce the supply of credit to small busi-
ness borrowers and increase interest rates on
loans by 25 to 45 basis points. Similarly, Favara
and Imbs (2009) find that relaxing restrictions on
bank entry increases the number and volume of
home mortgage loans originated by commercial
banks within a state and increases house prices.
Several studies find that branching and other
entry barriers affect state-level measures of eco-
nomic performance. For example, Jayaratne and
Strahan (1996) find that relaxation of state branch-
ing restrictions in the 1970s and 1980s signifi-
cantly increased state real income growth rates.
However, estimates of the impact of deregulation
on growth from studies that account for either the
possibility that slowly growing states were more
likely to deregulate (Freeman, 2002) or spatial
dependence in state growth rates (Garrett, Wagner,
and Wheelock, 2007) find considerably smaller
effects of deregulation on state income growth.
More recently, Acharya, Imbs, and Sturgess (2009)
find that branching restrictions limit the scope of
banks to pursue efficient diversification, which
in turn limits the diversification of investment
activity within a state.
The literature concludes that branching and
other entry regulations can inhibit efficient diver-
sification by banks and affect the cost and supply
of credit for borrowers. To the extent that diversi-
fication is limited, entry barriers might make banks
more vulnerable to local economic distress, as
discussed previously. Entry barriers might also
promote instability by protecting inefficient banks
from competitive forces. On the other hand, entry
barriers might allow incumbent banks to earn
higher-than-normal profits, which would tend to
encourage conservative practices and thereby keep
bank failure rates lower than failure rates in states
with low entry barriers.
26
Hence, the relationship
between entry barriers and bank failure rates is
an empirical question.
Rice and Strahan (2010) construct an index
of bank entry restrictions for each U.S. state, rang-
ing from 0 for no restrictions to a maximum of 4
for states that impose the most restrictions on bank
entry. Table 4 reports the correlation of values of
this index for December 2006 with state-level bank
failure rates for 2007-10. The correlation is posi-
tive, indicating that bank failure rates were higher
in states that imposed more entry restrictions, but
not statistically significant at conventional signifi-
cance levels. Hence, we find some weak evidence
that entry restrictions contributed to the high
bank failure rates observed in some states.
COMPARISON WITH 1987-92
The close association between state bank fail-
ure rates and economic conditions during 2007-10
25
We calculated the business bankruptcy rate as the number of
business bankruptcy filings during a year divided by the number
of private firms in existence in the fourth quarter of the prior year.
Data on bankruptcy filings are from the Administrative Office of
the United States Courts. Data on the number of private firms are
from the Bureau of Labor Statistics Quarterly Census of Employ -
ment and Wages.
Aubuchon and Wheelock
410
SEPTEMBER
/
OCTOBER
201 0
FEDERAL RESERVE BANK OF ST
.
LOUIS
RE V I EW
26
Keeley (1990) finds that increased competition reduces bank char-
ter values, which in turn encourages banks to increase asset risk
and hold less capital, and ultimately raises the risk of bank failure.
is reminiscent of previous episodes when the
United States experienced high numbers of bank
failures. Most recently, during the 1980s and
early 1990s, hundreds of commercial banks and
thrifts failed when states experienced large
declines in personal income and real estate prices.
States with large declines in real estate values
tended to sustain longer and deeper declines in
economic activity—and more bank distress—
than did other states (Wheelock, 2006). A similar
phenomenon occurred in the 1920s, when falling
commodity prices reduced agricultural incomes
and caused the failure of thousands of banks
located in farm states and other rural areas. States
where farm land values and cultivated acreage
had expanded the most during boom years sur-
rounding World War I experienced the highest
farm and bank failure rates subsequently (Alston,
Grove, and Wheelock, 1994).
Table 5 reports correlations of state bank fail-
ure rates for 1987-92 with various measures of
economic conditions. More than 200 commercial
banks failed in 1987—the most in any year since
the Great Depression—and the number of com-
mercial bank failures exceeded 100 in every year
through 1992.
27
A total of 884 commercial banks
failed between 1987 and 1992. Texas alone had
450 bank failures (among 1,955 active banks in
June 1986). Other states with high numbers of
failures included Oklahoma (78 failures among
528 banks), Louisiana (57 failures among 300
banks), and Colorado (38 failures among 435
banks). All four states experienced sharp declines
in state incomes when energy prices fell. Although
all four states also had relatively high bank failure
Aubuchon and Wheelock
FEDERAL RESERVE BANK OF ST
.
LOUIS
RE V I EW
SEPTEMBER
/
OCTOBER
201 0 411
27
Here we focus on commercial bank failures because comparable
data on thrift failures for 1987-92 are not available. We include
both commercial bank and thrift failures in Figures 1 and 2, but
the dating of thrift failures during the 1980s is imprecise because
many insolvent thrifts remained open when the Federal Savings
and Loan Insurance Corporation lacked the resources to resolve
them.
Table 5
Correlation of Bank Failures (Rates) and Local Economic Conditions (1987-92)
F
ailure measure
Variable nfail_1992 failrt_86 dep_failrt86
House Price Index percent change (1982:Q3–1987:Q1) –0.17 0.01 0.12
(0.23) (0.94) (0.40)
House Price Index percent change (1987:Q1–1992:Q4) –0.24 –0.38 –0.41
(0.10) (0.01) (0.00)
Percent change in gross loans secured by real estate (1982-86) 0.12 0.26 0.36
(commercial banks) 0.42 0.07 0.01
Change in mortgage delinquency rate (1992:Q4–1986:Q4) –0.12 –0.19 –0.12
(0.40) (0.18) (0.41)
Percent change in real per capita income (1986-92) –0.18 –0.54 –0.30
(0.21) (0.00) (0.03)
Change in unemployment rate (1992:Q4–1986:Q4) –0.15 –0.04 0.04
(0.30) (0.79) (0.80)
Percent change in gross state product (1986–1992) –0.10 –0.37 –0.32
(0.47) (0.01) (0.02)
Branching restrictions (1986:Q4) 0.32 –0.04 –0.00
(0.03) (0.79) (0.98)
NOTE: Numbers in parentheses represent p values indicating the statistical significance of the correlation coefficients. Failure measure
definitions: nfail_1992, number of commercial bank failures (1987-92); failrt_86: number of commercial bank failures (1987-92), divided
by total commercial banks in 1986:Q2; dep_failrt86: ratio of deposits of failed commercial banks (1987-92) to total deposits in all
commercial banks (1986:Q2), calculated at the branch level.
rates, both Alaska (where 5 of 16 banks failed)
and Arizona (where 14 of 53 banks failed) had
higher failure rates than Texas. Other states with
high failure rates included Connecticut (10 of 59
banks failed), New Hampshire (7 of 52 banks
failed), and Massachusetts (11 of 102 banks failed).
New England states experienced rapid income
growth and a real estate boom during the 1980s.
The New England economy slowed toward the
end of the decade, however, when cuts in federal
defense spending and increased competition in
the computer industry had a disproportionately
large impact on the region (FDIC, 1997). Among
U.S. census regions, New England experienced
the largest decline in real personal income during
the recession of 1990-91.
Although New England states experienced
rapid increases in house prices in the 1980s and
relatively sharp declines in house prices during
1987-92, other states with high bank failure rates
during 1987-92 did not have rapidly rising house
prices before the onset of bank failures. As shown
in Table 5, state bank failure rates for 1987-92 are
not highly correlated with changes in house prices
between 1982 and 1987, though they are corre-
lated with changes in house prices during 1987-92:
Failure rates typically were higher in states that
experienced larger declines in house prices. Bank
failure rates are not, however, correlated with
changes in mortgage loan delinquency rates
between 1986:Q4 and 1992:Q4. Thus, compared
with the bank failures of 2007-10, those of 1987-92
were not as strongly associated with distress in
housing markets.
28
As with the bank failures of 2007-10, state
bank failure rates for 1987-92 are strongly nega-
tively correlated with growth of per capita per-
sonal income and gross state product between
1986 and 1992. States with the largest declines
in personal income or gross state product tended
to have the highest bank failure rates. However,
bank failure rates are not closely correlated with
state unemployment rates. Finally, we find that
the number of bank failures in a state is positively
correlated with the presence of restrictions on
branch banking.
29
The four states with the most
bank failures—Texas, Oklahoma, Colorado, and
Louisiana—either prohibited or severely limited
branching within their borders. However, several
states with high bank failure rates or high percent-
ages of deposits in failed banks, such as Alaska,
Arizona, and most states in New England, per-
mitted statewide branching and their state bank
failure rates during 1987-92 are not closely corre-
lated with limits on branching within states. Of
course, banks in all states were prohibited from
operating branches in more than one state, and
this prohibition may have been a more important
impediment to diversification and scale than
branching restrictions within states.
30
CONCLUSION
The removal of legal restrictions on branch
banking, first by many states in the 1970s and
1980s and then by the federal government in the
1990s, led to a substantial consolidation of the
U.S. banking industry. By 2009, the number of
commercial banks in the United States was less
than half what it had been in 1984, when the
number of banks reached its postwar peak. Still,
because many U.S. banks operate only a few
branches in a single or small number of markets,
the geographic distribution of bank failures is
likely to reflect, to some extent, regional differ-
ences in economic conditions. Historically,
adverse shocks caused locally high numbers of
bank failures, as in Texas and New England in
28
However, commercial real estate market conditions may have
played important roles in both periods. Spong and Sullivan (1999,
pp. 73 and 74) note that between 1981 and 1986, tax laws allowed
investors to use an accelerated depreciation schedule for real prop-
erty, which tended to inflate commercial property values. The
removal of these tax shelters “helped to send the industry into a
downward spiral,” which was “at the forefront of many of the
banking problems of the 1980s and early 1990s.” Unfortunately,
as noted previously, state-level data on commercial real estate
market conditions are not available to examine the correlation of
commercial real estate conditions with bank failure rates.
Aubuchon and Wheelock
412
SEPTEMBER
/
OCTOBER
201 0
FEDERAL RESERVE BANK OF ST
.
LOUIS
RE V I EW
29
Here we use an index that takes a value of 1 for states that allowed
unlimited statewide branching, 2 for states that permitted limited
branching, and 3 for states that prohibited branching altogether
(as of 1986:Q4).
30
Meyer and Yeager (2001) and Yeager (2004) find that, in general,
the performance of small banks that operate within only one county
is more closely related to economic activity measured at the state
level than to activity within the county in which the bank is
located, suggesting that intrastate branching restrictions do not
prevent banks from achieving diversification within state borders.
the late 1980s and early 1990s. Small banks with
limited geographic diversification have been espe-
cially vulnerable to local economic shocks and
have tended to fail in higher numbers than larger
banks.
In several respects, the geographic patterns
of recent U.S. bank failures have been similar to
those of past episodes. During 2007-10, bank fail-
ure rates were higher in states with the largest
declines in personal income and gross state prod-
uct and the largest increases in unemployment
rates. Failure rates were also higher in states
experiencing the largest declines in house prices
and the largest increases in home mortgage delin-
quency rates. Those states also had the largest
increases in house prices and subprime mortgages
before 2007. On average, the percentages of bank
loans and assets devoted to home mortgages and
mortgage-backed securities rose during the hous-
ing boom, which made banks more vulnerable to
the subsequent decline in house prices. Unlike
previous episodes, banks that failed during this
episode tended to be somewhat larger on average
than non-failing banks. In particular, reflecting
the important role played by home mortgage dis-
tress during 2007-10, several large savings insti-
tutions failed.
We find that bank failure rates were only
modestly correlated with restrictions on intrastate
branch banking or bank entry, both in the recent
episode and during the failure wave of 1987-92.
However, evidence that bank failure rates during
2007-10 were closely correlated with measures
of state economic conditions suggests that the
long-standing prohibition of interstate branching,
though eliminated more than a decade ago, con-
tinues to influence the market structure and geo-
graphic distribution of bank failures today.
Aubuchon and Wheelock
FEDERAL RESERVE BANK OF ST
.
LOUIS
RE V I EW
SEPTEMBER
/
OCTOBER
201 0 413
REFERENCES
Acharya, Viral V.; Imbs, Jean and Sturgess, Jason. “Finance and Efficiency: Do Bank Branching Regulations
Matter?” Research Paper No. 06-36; Swiss Finance Institute Research, revised April 8, 2009.
Alston, Lee J.; Grove, Wayne A. and Wheelock, David C. “Why Do Banks Fail? Lessons from the 1920s.”
Explorations in Economic History, October 1994, 31(4), pp. 409-31.
Bair, Sheila C. “Remarks by FDIC Chairman Sheila C. Bair to the Commercial Mortgage Securities Association
Annual Conference.” Washington, DC, January 20, 2010;
www.fdic.gov/news/news/speeches/chairman/spjan2010.html.
Berger, Allen N. and DeYoung, Robert. “Technological Progress and the Geographic Expansion of the Banking
Industry.” Journal of Money, Credit, and Banking, September 2006, 38(6), pp. 1483-513.
Bullard, James B.; Neely, Christopher and Wheelock, David C. “Systemic Risk and the Financial Crisis: A Primer.”
Federal Reserve Bank of St. Louis Review, September/October 2009, 91(5 Part 1), pp. 403-17;
/>Calomiris, Charles W. “Do ‘Vulnerable’ Economies Need Deposit Insurance? Lessons from U.S. Agriculture in
the 1920s,” in Philip E. Brock, ed., If Texas Were Chile: A Primer on Banking Reform. San Francisco: Institute
for Contemporary Studies, 1992, pp. 237-314.
Curry, Timothy and Shibut, Lynn. “The Cost of the Savings and Loan Crisis: Truth and Consequences.” FDIC
Banking Review, Fall 2000, 13(2), pp. 26-35;
www.fdic.gov/bank/analytical/banking/2000dec/brv13n2_2.pdf.
Emmons, William R; Gilbert, R. Alton and Yeager, Timothy J. “Reducing the Risk at Small Community Banks:
Is It Size or Geographic Diversification that Matters?” Journal of Financial Services Research, April 2004,
25(2/3), pp. 259-81.
Favara, Giovanni and Imbs, Jean. “Credit Supply and the Price of Housing.” Working paper, Swiss Finance
Institute, December 2009;
www.fe.unl.pt/contents/html/File/INOVA%20PDF/Jean_Imbs.pdf.
Federal Deposit Insurance Corporation. History of the Eighties: Lessons for the Future. Washington, DC: FDIC,
1997;
www.fdic.gov/bank/historical/history/.
F
reeman, Donald G. “Did State Bank Branching Deregulation Produce Large Growth Effects?” Economics
Letters, May 2002, 75(3), pp. 383-89.
Garrett, Thomas A.; Wagner, Gary A. and Wheelock, David C. “Regional Disparities in the Spatial Correlation
of State Income Growth, 1977-2002.” Annals of Regional Science, September 2007, 41(3), pp. 601-18.
Garrett, Thomas A.; Wagner, Gary A. and Wheelock, David C. “A Spatial Analysis of State Banking Regulation.”
Papers in Regional Science, November 2005, 84(4), pp. 575-95.
Greenspan, Alan. “Testimony of Alan Greenspan before the Financial Crisis Inquiry Commission.” April 7, 2010;
/>Horvitz, Paul M. “The Causes of Texas Bank and Thrift Failures,” in Philip E. Brock, ed., If Texas Were Chile:
A Primer on Banking Reform. San Francisco: Institute for Contemporary Studies, 1992, pp. 131-60.
Jayaratne, Jith and Strahan, Philip E. “The Finance-Growth Nexus: Evidence from Bank Branch Deregulation.”
Quarterly Journal of Economics, August 1996, 111(3), pp. 639-70.
Keeley, Michael C. “Deposit Insurance, Risk, and Market Power in Banking.” American Economic Review,
December 1990, 80(5), pp. 1183-200.
Kroszner, Randall S. and Strahan, Philip E. “What Drives Deregulation? Economics and Politics of the Relaxation
of Bank Branching Restrictions.” Quarterly Journal of Economics, November 1999, 114(4), pp. 1437-66.
Leonnig, Carol D. “How HUD Mortgage Policy Fed the Crisis: Subprime Loans Labeled ‘Affordable.’” Washington
Post, June 10, 2008;
www.washingtonpost.com/wp-dyn/content/article/2008/06/09/AR2008060902626.html.
Meyer, Andrew P. and Yeager, Timothy J. “Are Small Rural Banks Vulnerable to Local Economic Downturns?”
Federal Reserve Bank of St. Louis Review, March/April 2001, pp. 25-38;
/>Peterson, Mitchell A. and Rajan, Raghuram G. “Does Distance Still Matter? The Information Revolution in
Small Business Lending.” Journal of Finance, December 2002, 57(6), pp. 2533-70.
Rice, Tara and Strahan, Philip E. “Does Credit Supply Affect Small-Firm Finance?” Journal of Finance, June
2010, 65(3), pp. 861-89.
Spong, Kenneth. Banking Regulation: Its Purposes, Implementation, and Effects. Fifth edition. Kansas City, MO:
Federal Reserve Bank of Kansas City, 2000;
www.kansascityfed.org/banking/bankingpublications/RegsBook2000.pdf.
Spong, Kenneth and Sullivan, Richard J. “The Outlook for the U.S. Banking Industry: What Does the Experience
of the 1980s and 1990s Tell Us?” Federal Reserve Bank of Kansas City Economic Review, Fourth Quarter 1999,
pp. 65-83.
Wheelock, David C. “What Happens to Banks When House Prices Fall? U.S. Regional Housing Busts of the
1980s and 1990s.” Federal Reserve Bank of St. Louis Review, September/October 2006, 88(5), pp. 413-29;
/>Wheelock, David C. and Wilson, Paul W. “Are U.S. Banks Too Large?” Working Paper No. 2009-054B, Federal
Reserve Bank of St. Louis, December 2009;
/>Wutkowski, Karey. “U.S. Bank Failures Pass 100 Mark for 2009.” Reuters Business and Financial News,
October 23, 2009;
www.reuters.com/article/idUSTRE59M5GT20091024.
Yeager, Timothy J. “The Demise of Community Banks? Local Economic Shocks Are Not to Blame.” Journal of
Banking and Finance, September 2004, 29(9), pp. 2135-53.
Aubuchon and Wheelock
414
SEPTEMBER
/
OCTOBER
201 0
FEDERAL RESERVE BANK OF ST
.
LOUIS
RE V I EW
Aubuchon and Wheelock
FEDERAL RESERVE BANK OF ST
.
LOUIS
RE V I EW
SEPTEMBER
/
OCTOBER
201 0 415
APPENDIX
Variable Definitions and Data Sources
V
ariable Definition Data source
Bank failure data
nfail_2010 Number of bank failures (2007–2010:Q1) FDIC Failed Bank List
www.fdic.gov/bank/individual/failed/banklist.html
failrt_06 Number of bank failures (2007-10) divided by total FDIC Failed Bank List; FDIC Summary of Deposits
banks in 2006:Q2 (SOD) www2.fdic.gov/sod/
dep_failrt06 Ratio of deposits of failed banks (2007-10) to total FDIC SOD
deposits (2006:Q2) calculated at the branch level
nfail_1992 Number of commercial bank failures (1987-92) FDIC Historical Statistics on Banking (HSOB)
www2.fdic.gov/hsob/
failrt_86 Number of commercial bank failures (1987-92) divided FDIC HSOB; Consolidated Reports of Condition
by total commercial banks in 1986:Q2, by state and Income (Call Reports)
dep_failrt86 Ratio of deposits of failed commercial banks (1987-92) Call Reports
to total deposits in all commercial banks (1986:Q2)
Local economic conditions (2007-10)
hpi_chg03_07 Percentage change in the FHFA House Price Index Federal Housing Finance Agency
(2003:Q3–2007:Q1)
hpi_chg07_09 Percentage change in the FHFA House Price Index Federal Housing Finance Agency
(2007:Q1–2009:Q4)
loan_chg02_06 Percentage change in the level of gross loans secured FDIC Statistics on Depository Institutions (SDI)
by real estate for all insured commercial banks, trusts, www2.fdic.gov/SDI/index.asp
and savings institutions (2002-06), annual data-year end
subratio06 Ratio of subprime mortgages to all mortgages (2006:Q4) Mortgage Bankers Association
sub_chg03_06 Change in the ratio of subprime mortgages to all Mortgage Bankers Association
mortgages (2003:Q3–2006:Q4)
deliq_chg07_09 Change in the mortgage delinquency rate (all loans) Mortgage Bankers Association
(2007:Q1–2009:Q4)
unemp_chg06_09 Change in the unemployment rate (2006:Q4–2009:Q4) Bureau of Labor Statistics
pci_chg06_09 Percent change in real per capita income (2005 $) Bureau of Economic Analysis
(2006-09), annual data
gdp_chg06_08 Percent change in nominal gross state product Bureau of Economic Analysis
(2006-08), annual data
bbq_chg07_09 Change in the ratio of business bankruptcies to all Administrative Office of the United States Courts;
establishments (2007-09) Bureau of Labor Statistics Quarterly Census of
Employment and Wages
restrict06 Branching Restriction Indicator, 0 (no restriction) Rice and Strahan (2010)
to 4 (highest restrictions)
Local economic conditions (1987-92)
hpi_chg82_87 Percentage change in the FHFA House Price Index Federal Housing Finance Agency
(1982:Q3–1987:Q1)
hpi_chg87_92 Percentage change in the FHFA House Price Index Federal Housing Finance Agency
(1987:Q1–1992:Q4)
loan_chg82_86 Percentage change in the level of gross loans secured FDIC Statistics on Depository Institutions (SDI)
by real estate for all insured commercial banks and www2.fdic.gov/SDI/index.asp>
trusts (1987-92), annual data-year end
all_chg86_92 Change in the mortgage delinquency rate (all loans) Mortgage Bankers Association
(1986:Q4–1992:Q4)
pci_chg86_92 Percent change in real per capita income (2005 $) Bureau of Economic Analysis
(1986-92), annual data
gdp_chg86_92 Percent change in nominal gross state product Bureau of Economic Analysis
(1986-92), annual data
restrict86 Branching Restriction Indicator, Authors’ calculations
1 (unlimited statewide branching);
2 (limited branching);
3 (branching prohibited)
416
SEPTEMBER
/
OCTOBER
201 0
FEDERAL RESERVE BANK OF ST
.
LOUIS
RE V I EW