34 macro additional slides
Bạn đang xem bản rút gọn của tài liệu. Xem và tải ngay bản đầy đủ của tài liệu tại đây (1.41 MB, 47 trang )
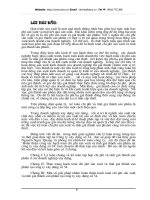
N. Gregory Mankiw
Principles of
Macroeconomic
s
Sixth Edition
21
The Influence of
Monetary and Fiscal Policy Premium
PowerPoint
on Aggregate Demand
Slides by
© 2012 Cengage Learning. All Rights Reserved. May not be copied, scanned, or duplicated, in whole or in part, except for use as
permitted in a license distributed with a certain product or service or otherwise on a password-protected website for classroom use.
Ron
In this chapter,
look for the answers to these questions:
• How does the interest-rate effect help explain the
slope of the aggregate-demand curve?
• How can the central bank use monetary policy to
shift the AD curve?
• In what two ways does fiscal policy affect
aggregate demand?
• What are the arguments for and against
using policy to try to stabilize the economy?
© 2012 Cengage Learning. All Rights Reserved. May not be copied, scanned, or duplicated, in whole or in part, except for use as
permitted in a license distributed with a certain product or service or otherwise on a password-protected website for classroom use.
2
Introduction
Earlier chapters covered:
the long-run effects of fiscal policy
on interest rates, investment, economic
growth
the long-run effects of monetary policy
on the price level and inflation rate
This chapter focuses on the short-run effects
of fiscal and monetary policy,
which work through aggregate demand.
© 2012 Cengage Learning. All Rights Reserved. May not be copied, scanned, or duplicated, in whole or in part, except for use as
permitted in a license distributed with a certain product or service or otherwise on a password-protected website for classroom use.
3
Aggregate Demand
Recall, the AD curve slopes downward for three
reasons:
The wealth effect
the most important
The interest-rate effect
of these effects for
The exchange-rate effect
the U.S. economy
Next:
A supply-demand model that helps explain the
interest-rate effect and how monetary policy
affects aggregate demand.
© 2012 Cengage Learning. All Rights Reserved. May not be copied, scanned, or duplicated, in whole or in part, except for use as
permitted in a license distributed with a certain product or service or otherwise on a password-protected website for classroom use.
4
The Theory of Liquidity
Preference
A simple theory of the interest rate (denoted r)
r adjusts to balance supply and demand
for money
Money supply: assume fixed by central bank,
does not depend on interest rate
© 2012 Cengage Learning. All Rights Reserved. May not be copied, scanned, or duplicated, in whole or in part, except for use as
permitted in a license distributed with a certain product or service or otherwise on a password-protected website for classroom use.
5
The Theory of Liquidity
Preference
Money demand reflects how much wealth
people want to hold in liquid form.
For simplicity, suppose household wealth
includes only two assets:
Money – liquid but pays no interest
Bonds – pay interest but not as liquid
A household’s “money demand” reflects its
preference for liquidity.
The variables that influence money demand:
Y, r, and P.
© 2012 Cengage Learning. All Rights Reserved. May not be copied, scanned, or duplicated, in whole or in part, except for use as
permitted in a license distributed with a certain product or service or otherwise on a password-protected website for classroom use.
6
Money Demand
Suppose real income (Y) rises. Other things
equal, what happens to money demand?
If Y rises:
Households want to buy more g&s,
so they need more money.
To get this money, they attempt to sell some of
their bonds.
I.e., an increase in Y causes
an increase in money demand, other things equal.
© 2012 Cengage Learning. All Rights Reserved. May not be copied, scanned, or duplicated, in whole or in part, except for use as
permitted in a license distributed with a certain product or service or otherwise on a password-protected website for classroom use.
7
ACTIVE LEARNING
1
The determinants of money demand
A. Suppose r rises, but Y and P are unchanged.
What happens to money demand?
B. Suppose P rises, but Y and r are unchanged.
What happens to money demand?
© 2012 ©
Cengage
2012 Cengage
Learning.
Learning.
All Rights
AllReserved.
Rights Reserved.
May notMay
be copied,
not be copied,
scanned,scanned,
or duplicated,
or duplicated,
in wholeinorwhole
in part,
or in
except
part,for
except
use as
for use as
permitted
permitted
in a license
in a distributed
license distributed
with a certain
with a certain
productproduct
or service
or service
or otherwise
or otherwise
on a password-protected
on a password-protected
website website
for classroom
for classroom
use.
use.
8
ACTIVE LEARNING
1
Answers
A. Suppose r rises, but Y and P are unchanged.
What happens to money demand?
r is the opportunity cost of holding money.
An increase in r reduces money demand:
households attempt to buy bonds to take
advantage of the higher interest rate.
Hence, an increase in r causes a decrease in
money demand, other things equal.
© 2012 ©
Cengage
2012 Cengage
Learning.
Learning.
All Rights
AllReserved.
Rights Reserved.
May notMay
be copied,
not be copied,
scanned,scanned,
or duplicated,
or duplicated,
in wholeinorwhole
in part,
or in
except
part,for
except
use as
for use as
permitted
permitted
in a license
in a distributed
license distributed
with a certain
with a certain
productproduct
or service
or service
or otherwise
or otherwise
on a password-protected
on a password-protected
website website
for classroom
for classroom
use.
use.
9
ACTIVE LEARNING
1
Answers
B. Suppose P rises, but Y and r are unchanged.
What happens to money demand?
If Y is unchanged, people will want to buy the
same amount of g&s.
Since P is higher, they will need more money to
do so.
Hence, an increase in P causes an increase in
money demand, other things equal.
© 2012 ©
Cengage
2012 Cengage
Learning.
Learning.
All Rights
AllReserved.
Rights Reserved.
May notMay
be copied,
not be copied,
scanned,scanned,
or duplicated,
or duplicated,
in wholeinorwhole
in part,
or in
except
part,for
except
use as
for use as
permitted
permitted
in a license
in a distributed
license distributed
with a certain
with a certain
productproduct
or service
or service
or otherwise
or otherwise
on a password-protected
on a password-protected
website website
for classroom
for classroom
use.
use.
10
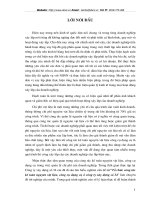
How r Is Determined
Interest
rate
MS curve is vertical:
Changes in r do not
affect MS, which is
fixed by the Fed.
MS
r1
Eq’m
interest
rate
MD1
MD curve is
downward sloping:
A fall in r increases
money demand.
M
Quantity fixed
by the Fed
© 2012 Cengage Learning. All Rights Reserved. May not be copied, scanned, or duplicated, in whole or in part, except for use as
permitted in a license distributed with a certain product or service or otherwise on a password-protected website for classroom use.
11
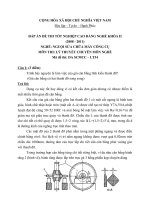
How the Interest-Rate Effect
Works
A fall in P reduces money demand, which lowers r.
Interest
rate
P
MS
r1
r2
P1
MD1
P2
AD
MD2
M
Y1
Y2
Y
A fall in r increases I and the quantity of g&s demanded.
© 2012 Cengage Learning. All Rights Reserved. May not be copied, scanned, or duplicated, in whole or in part, except for use as
permitted in a license distributed with a certain product or service or otherwise on a password-protected website for classroom use.
12
Monetary Policy and Aggregate Demand
To achieve macroeconomic goals, the Fed can
use monetary policy to shift the AD curve.
The Fed’s policy instrument is MS.
The news often reports that the Fed targets the
interest rate.
More precisely, the federal funds rate, which
banks charge each other on short-term loans
To change the interest rate and shift the AD curve,
the Fed conducts open market operations
to change MS.
© 2012 Cengage Learning. All Rights Reserved. May not be copied, scanned, or duplicated, in whole or in part, except for use as
permitted in a license distributed with a certain product or service or otherwise on a password-protected website for classroom use.
13
The Effects of Reducing the Money Supply
The Fed can raise r by reducing the money supply.
Interest
rate
P
MS2 MS1
r2
P1
r1
AD1
MD
M
AD2
Y2
Y1
Y
An increase in r reduces the quantity of g&s demanded.
© 2012 Cengage Learning. All Rights Reserved. May not be copied, scanned, or duplicated, in whole or in part, except for use as
permitted in a license distributed with a certain product or service or otherwise on a password-protected website for classroom use.
14
ACTIVE LEARNING
2
Monetary policy
For each of the events below,
- determine the short-run effects on output
- determine how the Fed should adjust the money
supply and interest rates to stabilize output
A. Congress tries to balance the budget by cutting
govt spending.
B. A stock market boom increases household
wealth.
C. War breaks out in the Middle East,
causing oil prices to soar.
© 2012 ©
Cengage
2012 Cengage
Learning.
Learning.
All Rights
AllReserved.
Rights Reserved.
May notMay
be copied,
not be copied,
scanned,scanned,
or duplicated,
or duplicated,
in wholeinorwhole
in part,
or in
except
part,for
except
use as
for use as
permitted
permitted
in a license
in a distributed
license distributed
with a certain
with a certain
productproduct
or service
or service
or otherwise
or otherwise
on a password-protected
on a password-protected
website website
for classroom
for classroom
use.
use.
15
ACTIVE LEARNING
2
Answers
A. Congress tries to balance the budget by
cutting govt spending.
This event would reduce agg demand and
output.
To stabilize output, the Fed should increase MS
and reduce r to increase agg demand.
© 2012 ©
Cengage
2012 Cengage
Learning.
Learning.
All Rights
AllReserved.
Rights Reserved.
May notMay
be copied,
not be copied,
scanned,scanned,
or duplicated,
or duplicated,
in wholeinorwhole
in part,
or in
except
part,for
except
use as
for use as
permitted
permitted
in a license
in a distributed
license distributed
with a certain
with a certain
productproduct
or service
or service
or otherwise
or otherwise
on a password-protected
on a password-protected
website website
for classroom
for classroom
use.
use.
16
ACTIVE LEARNING
2
Answers
B. A stock market boom increases household
wealth.
This event would increase agg demand,
raising output above its natural rate.
To stabilize output, the Fed should reduce MS
and increase r to reduce agg demand.
© 2012 ©
Cengage
2012 Cengage
Learning.
Learning.
All Rights
AllReserved.
Rights Reserved.
May notMay
be copied,
not be copied,
scanned,scanned,
or duplicated,
or duplicated,
in wholeinorwhole
in part,
or in
except
part,for
except
use as
for use as
permitted
permitted
in a license
in a distributed
license distributed
with a certain
with a certain
productproduct
or service
or service
or otherwise
or otherwise
on a password-protected
on a password-protected
website website
for classroom
for classroom
use.
use.
17
ACTIVE LEARNING
2
Answers
C. War breaks out in the Middle East,
causing oil prices to soar.
This event would reduce agg supply,
causing output to fall.
To stabilize output, the Fed should increase MS
and reduce r to increase agg demand.
© 2012 ©
Cengage
2012 Cengage
Learning.
Learning.
All Rights
AllReserved.
Rights Reserved.
May notMay
be copied,
not be copied,
scanned,scanned,
or duplicated,
or duplicated,
in wholeinorwhole
in part,
or in
except
part,for
except
use as
for use as
permitted
permitted
in a license
in a distributed
license distributed
with a certain
with a certain
productproduct
or service
or service
or otherwise
or otherwise
on a password-protected
on a password-protected
website website
for classroom
for classroom
use.
use.
18
Liquidity traps
Monetary policy stimulates aggregate demand by
reducing the interest rate.
Liquidity trap: when the interest rate is zero
In a liquidity trap, monetary policy may not work,
since nominal interest rates cannot be reduced
further.
However, central bank can make real interest
rates negative by raising inflation expectations.
Also, central bank can conduct open-market ops
using other assets—like mortgages and corporate
debt—thereby lowering rates on these kinds of
loans. The Fed pursued this option in 2008–2009.
© 2012 Cengage Learning. All Rights Reserved. May not be copied, scanned, or duplicated, in whole or in part, except for use as
permitted in a license distributed with a certain product or service or otherwise on a password-protected website for classroom use.
19
Fiscal Policy and Aggregate Demand
Fiscal policy: the setting of the level of govt
spending and taxation by govt policymakers
Expansionary fiscal policy
an increase in G and/or decrease in T
shifts AD right
Contractionary fiscal policy
a decrease in G and/or increase in T
shifts AD left
Fiscal policy has two effects on AD...
© 2012 Cengage Learning. All Rights Reserved. May not be copied, scanned, or duplicated, in whole or in part, except for use as
permitted in a license distributed with a certain product or service or otherwise on a password-protected website for classroom use.
20
1. The Multiplier Effect
If the govt buys $20b of planes from Boeing,
Boeing’s revenue increases by $20b.
This is distributed to Boeing’s workers (as wages)
and owners (as profits or stock dividends).
These people are also consumers and will spend
a portion of the extra income.
This extra consumption causes further increases
in aggregate demand.
Multiplier effect: the additional shifts in AD
that result when fiscal policy increases income
and thereby increases consumer spending
© 2012 Cengage Learning. All Rights Reserved. May not be copied, scanned, or duplicated, in whole or in part, except for use as
permitted in a license distributed with a certain product or service or otherwise on a password-protected website for classroom use.
21
1. The Multiplier Effect
A $20b increase in G
initially shifts AD
to the right by $20b.
The increase in Y
causes C to rise,
which shifts AD
further to the right.
P
AD3
AD2
AD1
P1
$20 billion
Y1
© 2012 Cengage Learning. All Rights Reserved. May not be copied, scanned, or duplicated, in whole or in part, except for use as
permitted in a license distributed with a certain product or service or otherwise on a password-protected website for classroom use.
Y2
Y3
Y
22
Marginal Propensity to Consume
How big is the multiplier effect?
It depends on how much consumers respond to
increases in income.
Marginal propensity to consume (MPC):
the fraction of extra income that households
consume rather than save
E.g., if MPC = 0.8 and income rises $100,
C rises $80.
© 2012 Cengage Learning. All Rights Reserved. May not be copied, scanned, or duplicated, in whole or in part, except for use as
permitted in a license distributed with a certain product or service or otherwise on a password-protected website for classroom use.
23
A Formula for the Multiplier
Notation: G is the change in G,
Y and C are the ultimate changes in Y and C
Y = C + I + G + NXidentity
Y = C + G I and NX do not change
Y = MPC Y + G because C = MPC Y
solved for1 Y
Y =
G
1 – MPC
The multiplier
© 2012 Cengage Learning. All Rights Reserved. May not be copied, scanned, or duplicated, in whole or in part, except for use as
permitted in a license distributed with a certain product or service or otherwise on a password-protected website for classroom use.
24
A Formula for the Multiplier
The size of the multiplier depends on MPC.
E.g.,
if MPC = 0.5 multiplier = 2
if MPC = 0.75 multiplier = 4
if MPC = 0.9 multiplier = 10
1
Y =
G
1 – MPC
The multiplier
A bigger MPC means
changes in Y cause
bigger changes in C,
which in turn cause
more changes in Y.
© 2012 Cengage Learning. All Rights Reserved. May not be copied, scanned, or duplicated, in whole or in part, except for use as
permitted in a license distributed with a certain product or service or otherwise on a password-protected website for classroom use.
25