ON THE DETERMINANTS OF CAPITAL STRUCTURE: AN EMPIRICAL STUDY OF VIETNAMESE LISTED FIRMS
Bạn đang xem bản rút gọn của tài liệu. Xem và tải ngay bản đầy đủ của tài liệu tại đây (256.22 KB, 42 trang )
JEAN MOULIN LYON 3 UNIVERSITY
VIETNAM UNIVERSITY OF COMMERCE
MASTER FINANCE AND CONTROL
THESIS
ON THE DETERMINANTS OF CAPITAL STRUCTURE:
AN EMPIRICAL STUDY OF VIETNAMESE LISTED FIRMS
Supervisor: Prof. Duc Khuong NGUYEN
Hanoi 2013
Acknowledgements
I am very grateful to my supervisor, Prof. Duc Khuong Nguyen for his encouragement, guidance and support from the start till the end of my master thesis. I am also thankful
to my parents for their continuous support. I appreciate the help from Prof. Manh Chien Vu
and Prof. Laurence Abadie. Last but not least, I am very thankful to Prof. Hoang Nguyen for
his encouragement to do my master degree.
1
TABLE OF CONTENTS
Acknowledgements...................................................................................................................1
LIST OF FIGURES..................................................................................................................4
Executive Summary..................................................................................................................5
1. INTRODUCTION.................................................................................................................7
1.1. BACKGROUND.............................................................................................................7
1.2. RESEARCH OBJECTIVES............................................................................................8
1.3. OUTLINE STRUCTURES..............................................................................................8
2. LITERATURE REVIEW....................................................................................................9
2.1. CAPITAL STRUCTURE................................................................................................9
2.2. CAPITAL STRUCTURE IN FINANCIAL THEORY.................................................10
2.2.1. THE TRADE-OFF THEORY..................................................................................10
2.2.2. THE AGENCY COST THEORY..............................................................................11
2.2.3. THE PECKING-ORDER THEORY........................................................................11
2.3. EMPIRICAL EVIDENCE.............................................................................................12
2.3.1. EVIDENCE FROM DEVELOPING COUNTRIES.................................................13
2.3.2. EVIDENCE FROM DEVELOPED COUNTRIES..................................................13
2.4. OVERVIEW OF VIETNAMESE ECONOMY AND STOCK MARKETS................14
3. RESEARCH METHODOLOGY AND HYPOTHESIS..................................................16
3.1. CHARACTERISTICS OF VIETNAM'S STOCK MARKET:.....................................16
3.2. DATA COLLECTION..................................................................................................16
3.3. HYPOTHESIS...............................................................................................................16
3.3.1. Firm size..................................................................................................................17
3.3.2. Profitability.............................................................................................................17
3.3.3 Growth.....................................................................................................................17
3.3.4. Tangibility of asset..................................................................................................18
3.3.5. Liquidity..................................................................................................................18
3.3.6. State capital ratio:..................................................................................................18
3.4. PRACTICAL METHOD:..............................................................................................20
3.4.1. Dependent variable:................................................................................................20
3.4.2. Independent variable:.............................................................................................20
3.4.3. The model:..............................................................................................................21
4. EMPERICAL RESULT.....................................................................................................22
4.1. MEAN AND MEDIAN ANALYSIS:...........................................................................22
4.2. CORRELATIONS.........................................................................................................25
4.3. EMPIRICAL FINDINGS..............................................................................................27
2
5. CONCLUSIONS AND RECOMMENDATIONS............................................................31
5.1. Conclusion of the study:................................................................................................31
5.2. Limitations of this study................................................................................................33
REFERENCES:......................................................................................................................34
LISTS OF 88 LISTED FIRMS ON HOSE...........................................................................38
3
LIST OF FIGURES
List of tables
Table 1: Table of Hypothesis and Empirical findings
Table 2: Descriptive statistic
Table 3: Descriptive statistic divided by type of ownership of companies
Table 4: Correlation matrix
Table 5: Impact of explanatory variables on total debt to total assets
Table 6: Impact of explanatory variables on short-term debt to total assets
Table 7: Impact of explanatory variables on long-term debt to total assets
4
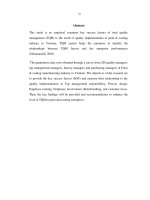
Executive Summary
There exists or not an optimal capital structure to every business and if so, how its affect to value firm is always an argumentative topic in the financial community over the past
decades. Capital structure has been an important focus point in the literature since Modigliani
and Miler (1958) have published their seminal research article, entitled “The cost of capital,
corporation finance and theory of investment” in the American Economic Review. The M&M
theory on capital structure claims that in an efficient market and in the absence of taxes, bankruptcy costs, and asymmetric information, the value of a firm is independent of capital structure.
Several theories have been developed in the attempt to arrive at one that is able to explain the financing behavior of companies as well as establishing whether an optimal capital
structure exists. Theories such as agency theory (Jensen & Meckling, 1976) trade-off theory
(Modigliani and Miler, 1963) and Pecking order theory (Myer & Majluf, 1984; Myer, 1984),
with the latter two being the most dominant, have been developed and used in the attempt to
explain companies’ capital structure. The trade-off theory advances that the choice of capital
structure in a firm is a result of a trade-off theory between the benefits of debt, such as those
arising from interest debt tax shields, and the costs of debt, such as indirect and direct bankruptcy costs (Myers, 1984), whereas the pecking order theory state that companies prefer the
cheapest source of funding, which due to information asymmetry, means companies prefer internal to external funding as well as debt to equity funding (Myer & Majluf, 1984).
Numerous studies have carried out empirical tests of capital structure theories, trying
to establish whether they could explain the capital structure of company as well as figuring
out which determinants were important when considering companies’ capital structure in developed countries and developing countries.
By learning about the situation of Vietnam businesses, I recognized Vietnam businesses does not focus on building the capital structure consistent with its business, while enterprises in developing countries, it is the first issue to decide for the formation and development of a business.
To build an appropriate capital structure, Vietnam companies need to understand in
such conditions, their capital structure is subject to the impact of these factors. Our main objective is to contribute to help Vietnamese businesses build an optimal structure, so I choose
research question “Indentify factors that affect the capital structure, inspection in Vietnam”.
This study used data from 88 non-financial companies listed on the Ho Chi Minh Stock
Exchange from 2008-2012, including 88 firms has largest market value by industry. All financial data of 88 companies are derived from the financial statements on the website of these
companies.
5
Synthesis and analysis of qualitative data combined with statistical analysis of quantitative data, comparing the results obtained with the previous results have been presented in order to clarify the research problem. Tool use econometric models run on software Stata11.
This study aims to help the managers and the scientists have the empirical evidence
about the factors affecting on the capital structure of listed companies on the Ho Chi Minh
Stock Exchange.
This study shows that: the factors that affect the capital structure of Vietnam firms are
profitability, tangibility, size, growth, liquidity; and the factors impact on capital structure
strongest is size, probability and liquidity, in which:
- Relationship between capital structure and profitability is negative
- Firms that are larger in size tend to have more leverage.
- Liquidity has negative correlation with total debt to total assets.
- Tang has negative correlation with short-term debt and positive correlation with
long-term debt.
- Firms with more growth opportunities tend to have more long-term debt
- State companies tend to use more leverage than other companies
The negative relationships between profitability and leverage; positive relationships between
growth and long-term debt are confirming the presence of Pecking-order theory in determining the financing behavior of Vietnam firms. The strong positive relationships between size
and leverage support the theoretical predictions of Trade-off theory.
In addition, the research results show the company is listed on the HCM City Stock Exchange
to use less long-term debt, this can be explained by the corporate bond market in Vietnam has
not found development, should be funded by businesses dependent on equity, short-term loans
from banks and commercial credits. Design thinking for increased funding for many businesses need to promote development of the corporate bond market.
Key word: “Capital structure”, “leverage”, “debt”,
6
1. INTRODUCTION
1.1. BACKGROUND
In finance, the capital structure is the most debatable topic and continues to keep researchers pondering. Capital structure refers to mix debt and equity used by a firm in financing its assets. The capital structure decision is one of the most important decisions made by financial management. The capital structure decision is at the center of many other decisions in
the area of corporate finance. These include dividend policy, project financing, issue of longterm securities, financing of mergers, buyouts and so on. One of the many objectives of corporate financial manager is to ensure the lower cost of capital and thus maximize the wealth
of shareholders. Capital structure is one of the effective tools of management to manage the
cost of capital. An optimal capital structure is reached at point where the cost of capital is the
lowest.
Much on the empirical research on the determinants of firm’s capital structure has
been directed largely towards companies listed in developed countries, such as the US, UK
and Western Europe (Rajan and Zingales, 1995; Wald, 1999; Franck and Usha, 2002); little
work has been done to further our knowledge of capital structure within developing countries
that have different institutional structures. Recently, Booth et al (2001) provided the first empirical study to test the explanatory power of capital structure models in developing countries.
The study used data from 10 developing countries to assess whether capital structure theory
was portable across countries with different institutional structures. It investigated whether the
stylized facts, which were observed from the studies of developed countries, could apply only
to these markets or whether they had more general applicability. The results were somewhat
skeptical of this premise. They provided evidence that firms’ capital choice decisions in developing countries were affected by the same variables as they were in developed countries.
Nevertheless, there were persistent differences of institutional structure across countries indicating that specific country factors were at work. Their findings suggest that although some of
the insights from modern finance theory are portable across countries, much remains to be
done to understand the impact of different institutional features on capital structure choices.
Booth et al. (2001) selected countries operating a market-orientated economic system,
which bore many similarities to developed countries. It is interesting and important to know
how capital structure theories work in a transitional economy environment within which institutional structures differ not only from developed countries but also from developing
economies. Vietnam is the developing and transitional economy in the world, and therefore is
chosen as the focus of this study. It is hoped to answer the questions as following:
- The impact of firm-specific factors on the capital structure of the Vietnam firms?
7
- What are the results that can be achieved from testing of variables indentified from
theories?
- What variables can be derived from the theories of capital structures?
1.2. RESEARCH OBJECTIVES
In short, the purposes of the research are:
(1) An overview of the theory of capital structure in order to see the importance of an
optimal capital structure, the rationale for the development of the business in the long term.
(2) To understand the factors that affect the capital structure of a business is a lot of researchers to analyze and debate to see the direction the impact of these factors on the capital
structure of a business.
(3) To survey and provide empirical evidence for the impact of these factors in Vietnam through surveys capital structure of listed companies on the stock exchange in Ho Chi
Minh City (HOSE) in the economic model amount, then gives an overview of and practical
capital structure for Vietnamese business.
1.3. OUTLINE STRUCTURES
The remaining part of the thesis is structured as follows. Section Two offers a literature review on capital structure, capital structure in financial theory and empirical evidence,
and an overview of Vietnamese economy. Section Three provides research methodology; with
characteristic of Vietnam’s stock market, data collection and the last discuss the practical
method used in order to conduct the econometric analysis of Vietnam listed companies’ capital structures. Section Four present, discuss and evaluates the findings. Section Five conclusion and recommendation the study.
8
2. LITERATURE REVIEW
2.1. CAPITAL STRUCTURE
Capital structure is the mix of financial instruments used to finance real investments
by corporations. Capital structure mention to the way businesses seeking financing through a
combination of plans to sell shares, options to purchase shares, bonds and loans. Optimal capital structure is the plan, which is now the smallest capital cost and highest stock prices.
A capital structure is consistent with all important decisions by businesses not only
need to maximize the benefits obtained from individuals and organizations related to business
and business activities, but also by the impact of this decision to the business capability of enterprises in the competitive environment.
Optimal capital structure involves trade-offs between costs and business benefits. Financing with loan capital created "tax shield" for businesses, while reducing the level of dispersion management decisions (especially with a limited number of business opportunities
and investments). The burden of debt, on the other hand training is offered to business pressures. Funding from the share capital does not create user cost of capital for businesses. However, shareholders may intervene in business activities operating high expectations on the efficiency of production and business investors also create considerable pressure for managers.
Capital structure has been an important focus point in literature since Modigliani and
Miler stated publishing their research about it in 1958 and 1963, with the following assumptions:
- No transaction costs
- No bankruptcy costs
- Firms issue only two types of claims: risk-free debt and equity
- Capital markets are complete
- Capital markets are competitive (individuals and firms are price takers)
- No taxes
Under the above set of assumptions, Modigliani and Miler showed that:
- Proposition I: A firm’s total market value is independent of its capital structure
- Proposition II: A firm’s cost of equity increases linearly with debt-equity ratio
During the decades which have passed since the emergence of Modigliani and Miler’s propositions regarding capital structure, a vast amount of research, in somewhat different directions,
have added quite a bit of new knowledge in the discussion regarding capital structure, which
will be reviewed in this chapter. The starting point of that will be to look at what could argued
to be “mainstream” financial research in the field of capital structure, post Modigliani and
Miler.
9
2.2. CAPITAL STRUCTURE IN FINANCIAL THEORY
Taking its theoretical point of departure mainly from what could be defined as traditional finance discourse, a number of newer theories, at least in comparison to the Miller and
Modigliani propositions, have in recent decades emerged for explaining a company’s choice of
capital structure. The ones reviewed in this section will be the trade-off theory, the agency cost
theory and the pecking-order theory.
2.2.1. THE TRADE-OFF THEORY
The trade-off theory explains firms’ choice of leverage by a trade-off between the benefits and
costs of debt. A trade-off of costs and benefits of borrowing, holding the firm's assets are
viewed as determiner of a firm’s optimal debt ratio. Main focus of a firm is to substitute debt
for equity, vice versa in order to find optimal debt ratio and maximize value of the firm.
Hence, trade-off theory can be summarized as balancing the different benefits and costs
associated with debt financing to have optimal capital structure. Debt also has disciplining
role because of reduction in free cash flow (Myers, 1984, p.577-578).
When a firm adjusts the optimum debt ratio, costs, and therefore lags, which are called as adjustment costs, make optimal capital structure of each firm different (Myers, 1984, p.576).
Graham and Harvey (2001) suggest that firms need to identify their optimal capital structure
and endeavor to reach and keep it. As it is understood, there is large deviation in optimal capital structure among firms.
Tax shield is also important point of the theory. Firms can deduct interest payment of debt
from tax, as a result net incomes of the firms increase. In order to maximize tax shield, firms
may choose higher debt levels (Graham, 2000, p. 1906). Therefore, firms with higher debt are
expected to have better financial performance. However, high amount of debt may cause risk
of bankruptcy and raising agency costs occurring between owners and managers (Brealey and
Myers, 2003). As it is seen, the theory does not only explain taxes and tax shields but effect of
financial distress due to high leverage. It propose that firm’s target capital structure is designed
by taxes, financial distress (cost of bankruptcy), and the agency conflict (Graham, 2000, p.
1907).
According to trade-off framework, firms set a target debt-to-value ratio and gradually moving
towards it, in much the same way that a firm adjusts dividends to move towards a target payout
ratio (Myers, 1984, p. 576). Many studies also support this framework such as Hovakimian,
Opler and Titman (2001), Fama and French (2002) Gaud, Jani, Hoesli, and Bender (2005),
Smith and Watts (1992), Byoun and Rhim (2003). These studies propose that firms move towards their target ratio over the long run or the short term and the target debt ratio and actual
debt ratio is an important aspect to take into consideration.
10
2.2.2. THE AGENCY COST THEORY
Jensen and Meckling (1976) who are founders of the agency cost theory, subsequently define
the agency relationship inside the firm as: "A contract under which one or more person (the
principal) engages another person (the agent) to perform some service on their behalf which
involves delegating some decision making authority to the agent”.
According to the agency theory, the way of professional management style, which is the separation of ownership and management may result agency conflicts that is caused by insufficient
work effort of manager, indulging in perquisites, choosing inputs or outputs according to one’s
preferences. Due to these reasons, a firm may fail to maximize its value. Conversely, with
these reasons one can maximize his/her own wealth and utility (Berger & Bonaccorsidipatti,
2006).
However, the theory suggests that choosing best/optimal capital structure may mitigate agency
conflicts and decrease agency cost. Therefore, according to the theory, high leverage/debt ratio help a firm to reduce its agency cost and mitigate agency conflicts. This debt ratio
also encourages managers to act more in the interests of shareholders. As a result, the firm’s
value increases.
2.2.3. THE PECKING-ORDER THEORY
The so called pecking-order theory or pecking-order hypothesis was developed by Stewart
Myers in 1984, as a way of describing the corporate finance behavior that he has observed
and based on that he pointed out three major points that corporate finance managers tends
to adhere to and that is highly relevant for capital structure choices. Myers’ (1984, p. 581)
three points are provided below:
1) Managers want to maintain stable shareholder dividends over time, despite possible fluctuations in earnings, stock prices or investment opportunities.
2) Mangers prefer internal financing compared to external financing, i.e. funds which are
raised through the issuing of new either debt or equity shares.
3) If external financing is necessary, managers opt for the least risky option first and so on.
Myers ranks different securities based on their perceived riskiness, with going from straight
debt on one end of the spectrum, through common stock on the other end.
Thus it is argued that corporate financing behavior are a result of information asymmetry and
that investors are under informed about the value of projects within a company for instance,
leading to that the company surrenders a substantial amount of a projects net present value to
the investors, when utilizing external financing, particularly external equity financing. This is
because the cost of debt financing is smaller than equity financing, as the differences in the
market’s and the management valuation of it are smaller than in the case of equity financing.
To avoid getting into this scenario with external financing however, it is argued that companies
maintain financial slack at all times, thus being able to internally finance its profitable projects.
11
Financial slack as such could be defined as cash and marketable securities that the company
holds (Myers, 1984, p. 590)
2.3. EMPIRICAL EVIDENCE
After knowing theories of capital structure we need so see how much research work has been
done on capital structure with regard to justify the predictions of these theories by collecting
empirical evidence from all around the world. Is there any difference between developed and
developing world with regard to source of finance? As mentioned below all the empirical evidence in the literature of capital structure subject to specific condition in which prediction of
some theories work while hypothesis of other theories do not. Likewise the behavior of firms
to adjust the capital structure is changing when they are confronted certain internal (company
specific) and external (outside of the firm) situation. Myers (2001) states all three theories of
capital structure are conditional because they work under their own set of assumption. It
means none of three theories can give vivid picture in practicing the capital structure. Eldomiaty and Ismail (2009) argue that in practice, business conditions are dynamic that cause firms
changing their capital structure thus moving from one theory to another, for example, when
the tax rate increases firms issuing debt for taking advantage of tax shield (Trade-off theory).
When debt becomes less attractive to issue then firms may seek financing from retained earnings (Pecking-order theory).
Cook and Tang (2010) posit well macroeconomic conditions help firm to adjust capital structure toward target quicker than that in bad macroeconomic conditions. Korajczyk and Levy,
(2003) argue that ―our results support the hypothesis that unconstrained firms time their issue choice to coincide with periods of favorable macroeconomic conditions, while constrained firms do not. Barry et al (2008) argue that interest rate affects the leverage; firms issue more debt when interest rate is low as compare to its historical level. Hennessy and
Whited (2005) argue more liquid firms hold lower level of leverage. They say debt issue is
more attractive when it is used to purchase back equity than when borrowed amount is distributed in shareholders.
There can be many economic (country specific) factors such as GDP growth, interest rate, inflation, capital market development and situational factors which directly or indirectly affect
the capital structure of the firm. Graham and Harvey (2001) depict that firms consider the 17
price appreciation of share before issuing it, and debt rating and financial flexibility before issuing debt. Miao (2005) claims to introduce competitive equilibrium model of capital structure and industry dynamics, and says firms make capital structure decision on the basis of peculiar technology shocks.
2.3.1. EVIDENCE FROM DEVELOPING COUNTRIES
Relatively little research work on firms’ financing decision has been done in developing coun12
tries (Shah & Khan, 2007). The main difference between developing and developed world is
that in developed world firms finance their leverage with long term debt and short term debt is
mainly contributing in leverage of firms in developing world (Booth et al 2001). Tong and
Green (2005) inspect capital structure of listed Chinese companies and find evidence in the
support of pecking order theory (Cobham & Subramaniam, 1998). Huang and Song (2006)
examine capital structure of 1200 Chinese firms and find the results consistent with Trade-off
theory and Pecking order theory of capital structure. Eldomiaty and Ismail (2009) examine the
capital structure of Egyptian firms and find the evidence supporting Trade-off theory. Gurcharan, (2010) examines the capital structure firms in selected four developing ASEAN countries
and finds significant negative relationship between profitability and growth in all four counties but other determinants of capital structure are treating differently in each country. Booth
et al (2001) investigate capital structure of 10 developing countries and argue that there is
negative relationship between tangibility and leverage in Pakistan, Brazil, India and Turkey
unlike the corresponding results in G7 by (Rajan & Zingales, 1995). While investigating capital structure of Pakistani companies (Shah and Hijazi 2004) also do not find significant relationship between tangibility and leverage. Chakraborty, 2010) argue the positive relationship
between tangibility and leverage of Indian firms. Booth et al (2001) and (Shah and Hijazi,
2004) find evidence supporting pecking-order theory. As mention above, evidences in developing world indicate the dominancy of pecking order theory as compared to trade-off theory.
2.3.2. EVIDENCE FROM DEVELOPED COUNTRIES
It has been unanimously observed that most of the empirical research on corporate capital
structure is conducted in developed world (Mazur, 2007). Margaritis & Psillaki (2007) investigate capital structure of 12,240 firms in New Zealand and find evidence consistent with
agency cost model. Frank & Goyal, (2009) examine capital structure of publically traded
American companies from 1950 to 2003 and find the evidence supporting some versions of
trade-off model. Beattie et al (2006) conducted survey research in which they examine the
capital structure of listed UK firms and evidence support the predictions of trade off theory as
well as pecking order theories. Huang & Ritter (2009) argue that US firms finance their operations more with external equality than debt if cost of equity capital is low. Lipson & Mortal
(2009) investigate the relationship between liquidity and capital structure of US firms and find
negative relationship between liquidity and debt. Cook & Tang (2010) investigate the financing behavior of US firms in good and bad economic condition and find that US firm adjust
their capital structure more quickly in good economic condition than bad. Antoniou et al
(2008) investigate capital structure of firm and find the evidences supporting Pecking-order
theory and Trade-off theory of capital structure. Bancel & Mittoo (2004) conduct survey in 16
European countries and find the evidences consistent with Trade-off theory of capital structure. Rajan & Zingales (1995) investigate the capital structure of firms in G7 countries and
find the similar treatment of variables of capital structure in all seven industrialized countries.
Brounen et al (2006) conducted survey to investigate the capital structure of firms in Europe
13
and find the evidences consistent with pecking order theory. Allen & Mizuno (1989) examine
the financing decision of the Japanese firms and find evidences consistent with pecking order
theory. Pushner (1995) 18 analyses the capital structure of Japanese firms and finds evidence
consistent with agency cost theory. The evidence from Switzerland also supports pecking order and trade-off (Drobetz & Fix, 2005).
2.4. OVERVIEW OF VIETNAMESE ECONOMY AND STOCK MARKETS
From 2007 to 2012 is the period witnessed a lot of volatility in the economy in general and
Vietnam Vietnam's stock market in particular. Therefore, the capital structure of firms in the
market is more volatile due to the economy. During this period, the capital structure of the
business by the book value (long-term debt on the book value of equity) generally range from
10% - 15% and the variation between the year is not too large. However, the capital structure
of the market value (long-term debt ratio on market value of equity) have very large fluctuations between years and reflects more clearly the impact of the economy the capital structure
of the business. Although the value of the book or market value of the overall capital structure
of Vietnam enterprises have long-term debt ratio is not too high (below 15%). This shows that
Vietnam now mainly used by owners of capital (equity) rather than debt.
In 2007 was a year of prosperous development of Vietnam's economy with GDP growth rate
of 8.48% annually on average, macroeconomic stability, the base rate of the period was
8.25%. This period of development is very favorable for most businesses in the Vietnam market. Especially in 2007, there are many businesses successful IPO, sold 100% of the issued
shares and earned huge surplus stock. It's a great motivation boost Vietnam businesses continue to grow. Businesses tend to use more equity than debt to financial leverage tends to decrease. In terms of book value, long-term debt in 2007 is 12.77%, based on market value;
long-term debt in 2007 was 8.1%.
After a period of prosperity, in 2008, brought to Vietnam market more "waves" with the
global financial crisis to make people spend limited countries making enterprises in the field
of import Shedding border. At the same time, rising domestic inflation (22.97%), so the base
rate also increased (12% - 14%) and reduced GDP growth (6.23%). As investors lost confidence in Vietnam's stock market, the VN-INDEX plummeting (from 1100 peak of 2007, the
VN-Index dropped to 286 in 2008). Stocks that depreciate businesses can not use the advantage of the equity that can not borrow because interest rates fluctuate constantly due to the
macroeconomic policies of the government to stabilize the economy.
Expressed most clearly the devaluation of equity on the stock market as measured by the rate
of long-term market value. Long-term debt ratio calculated as the average market value in
2008 increased the number of years of mutations observed (17.06%). The cause of this sudden
increase is due to the devaluation of equity investors lost confidence in Vietnam's stock market, many investors withdraw capital or sell-off led to the collapse of the market school.
14
2008 also began a difficult period of Vietnam's economy in the years that followed. 2009 and
2010, thanks to the stimulus package, lending support of the government of Vietnam to implement corporate restructuring towards capital-intensive rather than capital-intensive outstanding shares as before. Also in 2009 and 2010, but the stock market has not really recovered
fully but there were positive changes, so that the rate of long-term debt by market value is not
excessively high, such as in in 2008.
2011 stock market plunge, rising inflationary pressures, production and business activities of
small and medium enterprises at a disadvantage from the high interest rates while consistently
implementing government policy tight monetary and fiscal impact negatively on the construction industry and mining industry, construction material production, manufacturing enterprises have difficulty with nearly 50,000 corporate dissolution and bankruptcy.
2012 Vietnam's stock market remains volatile due to many reasons both objective and subjective. Despite the economic bright spots as relatively low inflation, stable exchange rate, interest rate reduction, increased exports and trade balance surplus the trend of divestment of corporations, public corporations with restructuring problems in not only the organization but
also in the credit markets that SOE is difficult to improve significantly in the medium term.
Overall, in the 5 years of observation (2008-2012), long-term debt by market value is always
lower than long-term debt by the book value because the market value of equity is generally
higher than its book value due to the reflection of market expectations on the future growth of
the business. Particularly, only in 2008 was long-term debt by market value is higher than the
book value of equity this year due to falling prices because of the collapse of the stock market
in Vietnam.
The following is an analysis of the components of the capital structure of Vietnam enterprises
in the industries represented in the Vietnam market listing on the stock exchanges TP. Ho Chi
Minh City (HOSE).
The selected sectors are divided into 13 main sectors (according HOSE), including 88 companies listed on HOSE shares with a total market value of each industry's largest.
Institutional environment for the activities of the Company are listed on the Vietnam stock
market has two following highlights:
- Vietnam is a country in transition from command economy to a market economy.
- Most of the companies listed on the stock market of Vietnam, formerly known as the stateowned companies, although were privatized but the government has a stake in the company.
3. RESEARCH METHODOLOGY AND HYPOTHESIS
3.1. CHARACTERISTICS OF VIETNAM'S STOCK MARKET:
Institutional environment for the operation of the company is listed on the Vietnam
stock market have two highlights, as the followings:
15
- Vietnam is a country in transition from oriented economy to the market economy
- Almost all listed firms on Vietnam's stock market has formerly state-owned companies, although was privatized but the government has a stake in the company this. It is not dif ficult to understand that Vietnam is different institutional structures for developed countries
and other developing countries. For example, in the world of Modigliani and Miller (2), the tax
will not affect the capital structure decisions of firms in the command economy. Because, just
as all state companies and banks are also benefiting from tax. Therefore, this article aims to
consider the factors affecting the capital structure of companies listed on the stock market is
nothing like Vietnam and other countries around the world.
In that state ownership is dummy variable, this variable has a value of 1 if the company is under state corporate law in 2005 (with the state share percentage of 51% or more),
whereas the cost value is 0.
3.2. DATA COLLECTION
This study used data from 88 non-financial companies listed on the Ho Chi Minh Stock Exchange from 2008-2012, including 88 firms has largest market value by industry. All financial
data of 88 companies are derived from the financial statements on the website of these companies.
Synthesis and analysis of qualitative data combined with statistical analysis of quantitative
data, comparing the results obtained with the previous results have been presented in order to
clarify the research problem. Tool use econometric models run on software Stata11.
3.3. HYPOTHESIS
The previous study has shown a number of factors that affect the capital structure of the business as the characteristics of economy, tangible fixed assets, taxation, company size, profitability, opportunities, growth and the volatility of earnings etc.. In his research, Harris and Raviv
(1991) summarized that financial leverage increases with tangible fixed assets, non-debt tax
shields, investment opportunities and firm size, lever down with fluctuations in income, advertising costs, the probability of bankruptcy, profitability and proprietary products. However, the
relationship between these factors and capital structure is not stable. Empirical research results
often change and sometimes opposed to theory. Furthermore, when comparing the capital
structure between the different countries, the institutional differences may influence the relationship between financial leverage and other factors.
Aside from the more recent theories regarding capital structure steaming mainly from what
could be labeled as rather traditional financial research, there has also been attempts made in
research to complement that view with other areas from the field of business administration,
for instance strategy, innovation, firm growth and, arguably, marketing. A number of those
complimentary theories will be reviewed here and will be utilized for summarizing factors
from these complimentary views that are argued to influence a company’s capital structure.
16
[
3.3.1. Firm size
It is presented, more often than not by tangible assets (either fixed assets or total assets) and is
postulated, under the Trade-off theory that is positively related to debt. The underlying argument is that big companies (i.e companies with large quantities of tangible assets) face less
volatility in their fortunes, and, therefore can have more financial risks in the form of debts.
The effect of size on leverage under the pecking order Theory of Capital Structure is given by,
among others, Harris and Raviv (1991) and Rajan, R.G and Zingales (1995). They argue that
firms with fewer tangible assets will have more debt since debt is used as a signal for future
prospects. Titman and Wessels (1988) both found evidence to support the negative hypothesis
between size and leverage. Size, in this study, is measured by taking into consideration the natural log of the fixed assets (LOGFA).
Accordingly, we propose the first hypothesis:
H1a: Firm size is expected to have a positive impact on leverage.
H2a: Firm size is expected to have a negative impact on leverage.
3.3.2. Profitability
Firm’s profitability is another important variable for conventional prescriptions, credited with
the ability to be relevant predictor of debt levels. Highly profitable companies are able to generate more retained earnings and therefore, are able to rely more on the internal resources for
financing growth, which would reduce the need to resort to external funds like debts. Hence,
debt and profitability are inversely related; a negative relation between debt and profitability is
also tenable as the latter speaks about the ability of the companies’ to repay. The asymmetric
information approach also assigns negative relations. The company’s profitability is represented, in this study, by (profit after tax) ÷ (Total Assets) and is referred to as PROFIM.
Accordingly, we propose the second hypothesis, H2: Profitability is negatively related to capital structure.
3.3.3 Growth
It generates demands for external capital and growth opportunities and needs signals to reach
the investors. The asymmetric information approach develops positive relationships between
Debt and Growth opportunities. Long and Malitx (1985) and Lang, Ofek and Stulz (1996)
found positive relation between leverage and growth opportunities. Some emperical evidence
in support of this negative relationship can be found in Rajan and Zingales (1995) and Barclay
and Smith (1996). According to the pecking order theory, high growth firms have a greater
need for funds, are more likely to exhaust internal funds, and so can be expected to borrow
more. In this study, the measure of growth opportunities by Price/Earnings (P/E) ratio (GRPE).
Base on this, we present the following hypothesis;
H3a: Growth is positively related to capital structure.
17
H3b: Growth is negatively related to capital structure.
3.3.4. Tangibility of asset
Theories generally state that tangibility is positively related to leverage. Since the tangible assets can be used as collateral in external borrowing, the presence of a large fraction of tangible
assets of a firm help to get bank loans at lower interest rate and it also help to reduce the risk
the lender suffering from the agency cost of debt. Negative relationships have been reported
between leverage and fixed assets in small and medium firms (Daskalakis and Psillaki, 2009)
and in less developed economies (Joever, 2006). The proxy used in this study to measure the
value of tangible assets of the company is the ratio of fixed assets to total assets
Base on this, we present the fourth hypothesis, including:
H4a: The tangible assets is positively related to capital structure.
H4b: The tangible assets is negatively related to capital structure.
3.3.5. Liquidity
Firm prefer internal financing to external financing. Therefore, firm are likely to create liquid
reserves from retained earnings. If the liquid assets are sufficient to finance the investments,
firms will have no need to raise external funds. Here we use the current ratio (current assets divided to current liabilities) as a proxy of liquidity. Firm with higher liquidity ratios are preferred to acquire more debt because of great ability to meet short term obligations (Ozkan,
2001). Hennessy and Whited (2005) argue more liquid firms hold lower level of leverage
On this study, we propose the fifth hypothesis, H5: Liquidity is negatively related to capital
structure:
3.3.6. State capital ratio:
State capital in the company is one of the unique features of the company is listed on the Vietnam stock market and haven’t got any theory mention to the relationship between the state
capital ratio with capital structure and firm performance. Theoretically, Leland and Pyle
(1977) argue that leverage is positively correlated with the extent of managerial equity ownership. However, empirical studies produce mixed results: for example, Berger, Ofek and Yermack (1997) confirm such positive correlation, while Friend and Lang (1988) give opposite
results. According to recent theories of Jean J Xue Chen and Yen (2004), state capital ratio is
negative relationship to financial leverage, but not statistically significant.
On this study, we propose the sixth hypothesis, H6: State owner is positively related to capital
structure for the following reasons:
First, by the relationship before equitation, the state owned companies often creditors
willing to lend.
Second, the company usually state capital access loans with cheaper cost than other
18
types of businesses
Table 1: Table of Hypothesis and Empirical findings:
Determinant
Predicted sign
by the
theories
Profitability
G7
Hypothesis
Countries
Developed
countries
-
-
-(+b)
-(+a)
-
-
Tangibility
+
+/-
+
+
-(+)
-
Size
+/-
+/-
-(+)
-a(+a)
-(+)
-
Growth
+/-
+/-
-
-a(+)
-(+)
+
Liquidity
+/-
-
State
+
Developing countries
China
-
Note:
"+" means that leverage increases with the factor.
"-" means that leverage decreases with the factor.
"+/-" means that both positive and negative relations between leverage and the factor
are possible theoretically if in "Theoretical Predicted Signs" column or have found empirically
if in 'Major Empirical Studies' Results' column. "?" means that no clear prediction or empirical
study result.
“a”
: Indicates that the result was either not statistically different from zero at conventional significance levels or that the result was weak in a non-statistical sense.
“b”
: Indicates that the result is weak in a statistical sense.
Sources:
G7 countries: (Rajan - Zingales, 1995)
Developed countries: (Harris - Raviv, 1991), i.e., a survey of the following emperical
studies: (Bradley, et al., 1984), (Chaplinsky Niehaus, 1990), (Friend - Lang, 1988), (Gonedes,
et al., 1988), (Long - Malitz, 1985), (Kester, 1986), Kim - Sorensen, 1986), (Marsh, 1982), Titman - Wessels, 1988).
Developing countries: (Booth et al., 2001).
China: (Huang - Song, 2002), Jean J Xue Chen and Yen (2004)
19