Comparison of rapid methods for detectio
Bạn đang xem bản rút gọn của tài liệu. Xem và tải ngay bản đầy đủ của tài liệu tại đây (1.64 MB, 8 trang )
Article
pubs.acs.org/est
Comparison of Rapid Methods for Detection of Giardia spp. and
Cryptosporidium spp. (Oo)cysts Using Transportable Instrumentation
in a Field Deployment
Hans-Anton Keserue,†,‡,§ Hans Peter Füchslin,†,∥ Matthias Wittwer,⊥ Hung Nguyen-Viet,†,#,▽
Thuy Tram Nguyen,● Narong Surinkul,◊ Thammarat Koottatep,◊ Nadia Schürch,⊥ and Thomas Egli†,§,*
Swiss Federal Institute for Aquatic Science and Technology (Eawag), Ü berlandstrasse 133, P.O. Box 611, CH-8600, Dübendorf,
Switzerland
‡
Federal Office of Public Health (FOPH), Schwarzenburgstrasse 165, CH-3097, Liebefeld, Switzerland
§
Institute of Biogeochemistry and Pollutant Dynamics (IBP), ETH Zurich, Universitätsstrasse 16, CH-8092 Zurich, Switzerland
∥
Bachema AG, Analytische Laboratorien, Rütistrasse 22, CH-8952 Schlieren, Switzerland
⊥
Spiez Laboratory, Federal Office for Civil Protection (FOCP), Austrasse, CH-3700 Spiez, Switzerland
#
Department of Epidemiology and Public Health, Swiss Tropical and Public Health Institute, P.O. Box, CH-4002, Basel, Switzerland
▽
Centre for Public Health and Ecosystem Research (CENPHER) and International Livestock Research Institute (ILRI), Hanoi
School of Public Health (HPPH), 138 Giang Vo, Hanoi, Vietnam
●
Division of Enteric Infections, Department of Microbiology, National Institute of Hygiene and Epidemiology, Hanoi, Vietnam
◊
School of Environment, Resources and Development, Asian Institute of Technology, P.O. Box 4, Klong Luang, Pathumthani 12120,
Thailand
†
S Supporting Information
*
ABSTRACT: Reliable, sensitive, quantitative, and mobile rapid
screening methods for pathogenic organisms are not yet readily
available, but would provide a great benefit to humanitarian
intervention units in disaster situations. We compared three
different methods (immunofluorescent microscopy, IFM; flow
cytometry, FCM; polymerase chain reaction, PCR) for the rapid
and quantitative detection of Giardia lamblia and Cryptosporidium parvum (oo)cysts in a field campaign. For this we deployed
our mobile instrumentation and sampled canal water and
vegetables during a 2 week field study in Thailand. For
purification and concentrations of (oo)cysts, we used filtration
and immunomagnetic separation. We were able to detect considerably high oo(cysts) concentrations (ranges: 15−855 and 0−
240 oo(cysts)/liter for Giardia and Cryptosporidium, respectively) in 85 to 300 min, with FCM being fastest, followed by PCR,
and IFM being slowest due to the long analysis time per sample. FCM and IFM performed consistently well, whereas PCR
reactions often failed. The recovery, established by FCM, was around 30% for Giardia and 13% for Cryptosporidium (oo)cysts. It
was possible to track (oo)cysts from the wastewater further downstream to irrigation waters and confirm contamination of salads
and water vegetables. We believe that rapid detection, in particular FCM-based methods, can substantially help in disaster
management and outbreak prevention.
■
In contrast, rapid detection methods, e.g., flow cytometry
(FCM), immunofluorescent microscopy (IFM), and polymerase chain reaction (PCR) may provide results after only a few
hours and can also detect noncultivable organisms. Especially in
crisis situations, international intervention units would highly
benefit from the capability to analyze food, clinical, and water
INTRODUCTION
The 2010 Haiti earthquake, including the associated outbreak
of cholera, demonstrated the need for reliable and rapid
monitoring of water quality to prevent the spread of
waterborne pathogens, especially in disaster management.1,2
Conventional approaches for evaluating the microbial water
quality based on standard plating for indicator bacteria take
from 18 h to several days and methods for specific pathogen
detection take days up to weeks until a result is obtained.3−6
Furthermore, for a range of pathogens including protozoan
parasites, plating methods are not applicable.7−9
© XXXX American Chemical Society
Received: May 18, 2012
Revised: July 19, 2012
Accepted: July 20, 2012
A
dx.doi.org/10.1021/es301974m | Environ. Sci. Technol. XXXX, XXX, XXX−XXX
Environmental Science & Technology
Article
risk and obtain evidence for contamination of these products by
the irrigation water. For all samples, standard methods, i.e.,
heterotrophic plate count (HPC), turbidity, E. coli count,
conductivity, and the flow cytometric total bacterial cell count
(TCC) were included.
samples for pathogenic organisms within hours, preferably by
using conveniently transportable instrumentation. Therefore, a
rapid detection approach based on immunological staining,
immunomagnetic separation, and flow cytometric detection was
developed,10 which is compatible with mobile instrumentation.
Giardia lamblia and Cryptosporidium parvum are the major
intestinal parasites in humans worldwide and among the most
common reasons for diarrheal disease.11 Large waterborne
outbreaks are documented to have been caused by these
pathogens, which have been classified as “neglected diseases” by
the WHO.12 Infection is maintained through the fecal-oral
route by the (oo)cysts that are environmentally inert and highly
robust against chlorination.13 Agriculture and human wastewater are major sources of contamination 14 and since not only
humans but also many invertebrates can be infected, there is a
high potential for zoonotic transmission.13,15 Drinking water is
considered as the major cause for infections,16,17 and (oo)cysts
can be detected in over 80% of U.S. surface waters.18
Furthermore, many infections are estimated to be associated
with food, such as shellfish, fresh fruit juices, raw milk products,
and raw salads.19,20
Low numbers of oo(cysts) can cause human infection, i.e.,
10−100 for Giardia lamblia21,22 and 10−1000 for Cryptosporidium parvum.23 The approved standard method for oo(cysts)
detection, USEPA 1623,24 is based on filtration, purification,
and microscopic quantification and is considered tedious and
time-consuming with low and variable recoveries, especially for
environmental water samples.19,25 A blind survey conducted in
different routine laboratories resulted in recoveries ranging
from 0.8 to 22.3%, averaging 9.3% for spiked samples.26 Thus, it
is very difficult to establish a useful and cost-effective
monitoring program under field conditions using this
method.27 In some recent outbreaks, typical warning signals,
like elevated turbidity or coliform counts, did not show
abnormalities early enough, thus these indicators cannot
provide safety.28 A typical example is the huge Milwaukee
Cryptosporidium outbreak in 1993.29
Thailand is a fast-developing country with a high economic
growth rate. There are extensive networks of man-made
waterways that are used for trade, agriculture, flood protection,
defense, waste management, and transport. The urban
population is steadily increasing, but the infrastructure is not
developing at the same pace. Thus major parts of domestic and
commercial wastewaters are released untreated into these
canals.30 Although, the practice of recycling nutrients has
economical and ecological benefits, it is opposed by the
inherent infection risks. Of health concern is that these waters
are used for irrigating and fertilizing rice and vegetable fields
and thus contamination of agricultural products cannot be
excluded. Hence, the population is highly exposed to infection
risks not only when consuming contaminated foodstuffs, but
also when interacting with this water.31
In our study, we first evaluated the performance of our
pathogen concentration and purification approach and
compared rapid analysis methods (FCM, IFM, PCR) for the
detection of the parasites Giardia spp. and Cryptosporidium spp.
with mobile instrumentation in a set up similar to humanitarian
missions. Second, we tried to quantify the pathogen flow from a
wastewater inlet to 100 m downstream locations where people
are actually exposed (Figure S1 of the Supporting Information,
SI) and to evaluate the reduction in pathogen load due to
dilution effects or sedimentation. In addition, we analyzed
irrigation water, salad and vegetables to evaluate consumer’s
■
MATERIALS AND METHODS
Organisms. Reference Giardia lamblia and Cryptosporidium
parvum (oo)cysts were obtained from Waterborne Inc. (107
cyst and 107 oocysts, New Orleans, LA, U.S.) each stored in 8
mL of sterile PBS (phosphate buffered saline, 150 mM NaCl,
15 mM KH2PO4, 20 mM Na2HPO4, 27 mM KCl, pH 7.4;
Sigma-Aldrich, St. Louis, MO, U.S.) at 4 °C.
Instrument Deployment. All materials used in this study
were shipped from Switzerland to Thailand by air cargo in 6
transport boxes with a total weight of 249 kg. We installed the
instruments in an empty lab at the Asian Institute of
Technology and tested functionality with oo(cysts) reference
solutions prepared in Switzerland. Only electricity, benches,
fridges, and freezers of the lab infrastructure were used.
Sampling. The field campaign lasted two weeks and 24
environmental water samples (2 L) were collected from canal
water systems of the Klong Luang Municipality, Pathumthani
Province, Thailand (Table S1, Figure S2 of the SI). Canal water
samples were taken directly in front the wastewater inlets and
from bridges 100 m downstream of the wastewater inlet
(Figure S3 of the SI). A custom-made 2 L sample collector was
immersed approximately 30 cm into the water. Water can enter
the sampler from top and bottom and the bottom opening is
blocked by a plastic ball when the sampler is removed from the
water. Washed and rinsed with 0.22 μm-filtered water 1 L screw
cap glass bottles were used to transport the samples. Samples
were cooled by ice and transported in less than 3 h to our
laboratory, where they were processed instantly. Temperatures
and pH of all samples were measured directly after sampling
with an hand-held instrument (EcoSense pH100, YSI Inc.,
Yellow Springs, OH, U.S.). Additionally, to assess the exposure
for field workers as well as the exposure risk for consumers,
samples were collected from salad field irrigation water
connected to the canals, from freshly harvested lettuce, washed
lettuce and Morning Glory (syn. Ipomoea aquatica, water
spinach, Figure S4 of the SI).
Preparation of Salad and Vegetable Samples. From
lettuce heads, leaves were removed with gloves and around 500
g of leaves were washed individually in 300 mL PBST (1 × PBS
with 0.005% Tween 80 (Fluka) added). For Morning Glory,
the leaves with the flower stem were taken and washed in buffer
as described above. The rinsing water was then filtered and
further processed like the water samples. Results are given for
200 g (“a serving”) to have a basis for sample comparison
(Table 1).
Table 1. (Oo)cysts Detected in the Irrigation Water, Salads
and Vegetables with Either FCM or IFM
IFM
sample description
irrigation water, 1 L
unwashed lettuce, 200 g
washed lettuce, 200 g
Morning Glory, 200 g
B
FCM
Giardia cyst count
10
16.7
15.7
38
0
25
17.6
50
IFM
FCM
Cryptosporidium
oocyst count
3
1.2
0
4
3
0
1.3
10
dx.doi.org/10.1021/es301974m | Environ. Sci. Technol. XXXX, XXX, XXX−XXX
Environmental Science & Technology
Article
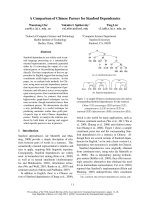
Figure 1. FCM dot plots of green (FL1 −520 nm) vs red (FL3 −630 nm) fluorescence signals. Letters in the plots represent the different clusters,
where “Cry” is for Cryptosporidium, “Gia” for Giardia, and AC for a presumptive autofluorescent algae cluster (always below “AC”). All other
annotations in the plots are from the original FCM software outputs that cannot be removed without modifying the images. Plot A: Spiked (oo)cysts
in canal water with intended double-staining technique and appropriate gating, employing an additional red fluorescent dye for Cryptosporidium
staining. The algae cluster interfered with the original gate for Cryptospordium, so a protocol without the red dye was used. Plot B: Calibration
measurement with spiked cysts in PBS buffer and oocysts and single-staining, employed throughout this study. Plot C: Spiked (oo)cysts in canal
water with the staining and gating presented in this work. Plots D to F illustrate the different background levels encountered in environmental
samples.
Sample Processing. The protocol was adapted from
Keserue and co-workers;10 briefly, 1 L water samples were
vacuum filtered through a 47 mm diameter, 30 μm nylon-net
filter (Millipore, Billerica, MA, U.S.) and subsequently through
a 47 mm diameter, 2 μm-pore-size polycarbonate track etch
filter (PCTE, Sterlitech Corporation, Kent, WA, U.S.) and
resuspended in 5 mL of sterile PBST by vortexing vigorously
for 5 min. Then we added 10 μL of 10% BSA (Bovine serum
albumin, Sigma, Steinheim, Germany) and 3 μL IgG rabbit
polyclonal FITC-conjugated cell surface specific antibodies
(A100FLK, Waterborne Inc.). Samples were incubated for 15
min at 30 °C (ambient) temperature in the dark. After
incubation, 100 μL of colloidal, superparamagnetic anti-FITC
MACS MicroBeads (Miltenyi Biotec, Bergisch Gladbach,
Germany) were added and incubated for 30 min on ice at
around 5 °C, protected from light. The extraction column
(MACS MS Column, Miltenyi Biotec) was placed in the
magnet and the sample was run through the column.
Subsequently, the column was washed with 3 × 2 mL of 0.22
μm-filtered PBST. The column was then removed from the
magnet and retained cells were eluted with 1 mL of PBS flushed
through the column with the provided piston. This positive
fraction was collected and split into 300 μL fractions for
analysis by flow cytometry, fluorescence microscopy, and PCR.
Flow Cytometry. Flow cytometric detection was performed
with a light (17 kg) and mobile (43 × 37 × 16 cm) Partec
CyFlow SL flow cytometer (Partec GmbH, Mü n ster,
Germany), equipped with a 20 mW blue solid-state laser
emitting light a 488 nm and a volumetric counting sample port.
Optical filters were adjusted to measure green fluorescence at
520 nm (FL1), red fluorescence at 630 nm (FL3), the sideward
scatter (SSC) at 488 nm, and the forward scatter (FCS) at 488
nm. The trigger was set on green fluorescence. Events were
defined based on forward scatter (FCS), sideward scatter
(SSC), 520 nm (FL1) and 630 nm (FL3) fluorescence. Results
were presented by plotting the histograms as well as dot plots
for: FL1 versus SSC, FL1 versus FL3, FL1 versus FSC, and FCS
versus SSC. For quantification, we applied defined gating
regions, Gate R1 for Giardia and gate R2 for Cryptosporidium
(Figure 1, Figure S5 of the SI). Green and red fluorescence are
emitted by the FITC and since the red signal is only a fraction
of the intensity the amplification (gain) for this signal is very
high. The specific instrumental gain settings used for green
fluorescence, red fluorescence, forward scatter, and sideward
scatter canals were 291.0, 551.0, 222.5, and 242.0, respectively.
The flow speed rate was 3 μL/second, implying a counting rate
of less than 500 events / second and a total duration of about
3.5 min per measurement.
Fluorescence Microscopy. From each water sample, 300
μL of the immunomagnetically enriched and purified samples
were filtered onto a 14-mm diameter and 0.20 μm pore size
GTPB microscopy black membrane filter (Millipore) by using a
filter holder (Millipore No. XX3001240). The black membrane
filter was then placed on a microscopy glass slide. After
approximately 1 h of air-drying, 5 μL of antifade mounting
medium (Waterborne, Inc., New Orleans, USA) was added to
the stained cells on the membrane and the filter was covered
with a cover slide suitable for fluorescent microscopy. The
samples were examined within 5 h after collection using a very
light (9.6 kg), mobile PrimoStar iLED microscope (Zeiss, Jena,
Germany) at 1000× magnification. For counting, the whole
filter was screened for parasites in about 30−45 min. The
parasites were detected based on green fluorescence, size, and
shape.
qPCR. DNA extraction and PCR protocol were adapted
from Guy and colleagues.32 Briefly, from each water sample 300
C
dx.doi.org/10.1021/es301974m | Environ. Sci. Technol. XXXX, XXX, XXX−XXX
Environmental Science & Technology
Article
Table 2. Recovery Experiments of the Complete Method (Filtration Resuspension, Immunolabelling, Immunomagnetic
Separation, and Flow Cytometric Detection) with Surface Waters from Canalsa
organism
sampling week
Giardia
Giardia
Cryptosporidium
Cryptosporidium
1
2
1
2
no. of environmental
(oo)cysts
55.0
48.3
31.7
51.7
±
±
±
±
15
15.3
7.7
28.4
no. of spiked
(oo)cysts
5,525
4,225
7,600
10,400
±
±
±
±
100
79
217
505
no. of recovered organisms
1,720
1,300
990
1,400
±
±
±
±
328
221
138
74
recovery of
spiked organisms, % ± CV, %
30.1
29.6
12.6
13.0
±
±
±
±
6.2
5.6
2.0
1.2
a
The numbers of (oo)cysts are given per liter. Recovery is given in percentage after subtraction of the environmental organisms ± coefficient of
variation (CV) in %, (n = 3).
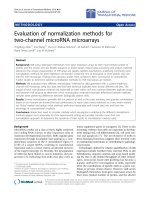
Figure 2. Comparison of the detection methods used. Top bar chart for Giardia lamblia and bottom chart for Cryptosporidium parvum quantification.
The x-axis represents the sampling points with the sampling date (four sampling sites for each date; see Table S1 of the SI). For comparison, we
added the salad and vegetable samples in the charts. Let. stands for lettuce.
μL of the immunomagnetically enriched and purified sample
were subjected to DNA extraction using the EZ1 DNA Tissue
Kit (Qiagen, Hilden, Germany) on the transportable (29 kg)
EZ1 BioRobot (Qiagen). Modifications of the manufacturer’s
protocol were employed, adding a sequence of three freeze−
thaw cycles. Cycles consisted of 30 min freezing at −20 °C,
subsequent thawing at 90 °C and three 30 s sonication runs at a
maximum value of 240 W (Elmasonic S10H, Elma GmbH,
Singen, Germany). Total DNA was eluted in 200 μL of buffer
whereof 5 μL was used for each PCR reaction. PCR reactions
were run in doublets using the Qiagen QuantiFast PCR SYBER
GREEN mix on a transportable Mastercycler realplex (18 kg,
Eppendorf, Hamburg, Germany). The primers used for Giardia
were targeted against β-Giardin P241 and for Cryptosporidium
against COWP P702 (Mycrosynth, Balgach, Switzerland)
(Table S 2 of the SI). The primer concentration was 1 μM
per reaction.32 For each PCR run a triplicate standard curve for
Cryptosporidia parvum and Giardia lamblia (oo)cysts (10 2−10
/mL) was run for control. Total time to result for our PCR
approach was about 200 min.
Recovery Evaluation. Recovery was determined by FCM
only, since we reported recently very good agreement for
comparison of FCM and IFM counts of spiked Giardia cysts in
tap and wastewater.10 Thus, diluted oo(cyst) stock solution was
stained with fluorescent antibodies as described above and
directly counted by FCM in order to prepare the spiking
concentrations. Triplicates of two liter canal water sample were
divided into two one liter aliquots; one aliquot was spiked with
a defined amount of (oo)cysts, then the concentration of
(oo)cysts was determined in both aliquots. Thus, the recovery
in % represents the fraction of recovered parasites, after
subtracting the naturally occurring ones, compared to the
spiking value (Table 2).
5
D
dx.doi.org/10.1021/es301974m | Environ. Sci. Technol. XXXX, XXX, XXX−XXX
Environmental Science & Technology
Article
Other Measured Parameters. The total flow cytometric
bacterial cell concentration (TCC) was determined as
described earlier.33 Turbidity of the samples was measured
with a Hach 2100 turbidimeter (Hach Company, Loveland,
CO) according to the instructions of the manufacturer. Results
are given in nephelometric turbidity units (NTU). The
heterotrophic plate count (HPC) and the E. coli count was
performed with the most probable number method according
to APHA-AWWA-WPCF, Standard methods for the examination of water and wastewater, 21st edition. For the HPC, the
spread plate method on R2A agar with incubation at 28 °C for
5 days was performed.34 For E. coli Section 9221F was
applied.35
Statistical Analysis. Linear regressions were performed
with Microsoft Excel, Pearson correlations were computed with
IBM SPSS, and box plots and Wilcoxon signed rank test were
generated with Graph Pad Prism.
Since the theoretical detection limit of the PCR is one
(oo)cyst and given our dilution of the extracted DNA, we
estimate for our approach a detection limit of 40 (oo)cysts per
reaction. Thus, in a number of cases, the (oo)cyst
concentration was below the detection limit of our method.
However, it is most likely that in the many other cases where
concentrations were above this limit, as indicated by IFM and
FCM, detection was hampered by inhibitory compounds, which
can be considered ubiquitous in canal waters. Such interference
of inhibitory compounds in natural water samples with PCR
detection is often reported in literature.36−38
Comparison of the Detection Methods. For Giardia
lamblia, concentrations ranged from 3 to 347, 15 to 855, and 39
to 4,074 cysts per liter for IFM, FCM, and PCR, respectively
(Medians: 32, 60, 165). Generally, PCR indicated higher cyst
concentrations than the other two methods, but often gave a
false negative result (13 out of 27 samples, i.e., ∼48%). FCM
and IFM gave consistently similar results, though the FCM
count was usually (in 93% of samples) higher (Figure 2).
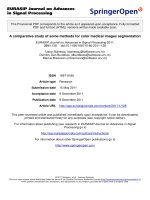
Because of the high false negative rate of the PCR analysis we
linearly correlated only FCM vs IFM, leading to a Pearson
correlation for FCM vs IFM of r = 0.867, p < 0.0001, n = 24
and a linearization function of y = 0.35x + 16.2 for the surface
water samples (Figure 3).
■
RESULTS
After transport and installation all instrumentation was tested
successfully with precounted reference samples and/or
calibration beads for precise quantification.
Water Samples. The water samples had an average
temperature of 29.7 ± 2.3 °C and an average pH of 6.57 ±
0.14.
Flow Cytometry. The Giardia cysts could be discriminated
well from background signals 10 (Figure 1). Since Cryptosporidium oocysts are considerably smaller than Giardia cysts, we
originally intended to use in this study a double-staining
approach to better discriminate the oocysts. Therefore, RPhycoerythrin-labeled antibodies (A400 R-PE, Waterborne
Inc.) against Cryptosporidium parvum were used as an additional
red fluorescence emitter for the oocysts. However, in many of
the canal water samples signals from an autofluorescent
presumptive algal cluster overlapped with the Cryptosporidium
signals (Figure 1, plot A) and therefore we had to refrain from
using this stain in this field study. Thus, the Cryptosporidium
cluster is smaller and more distinct but closer to the Giardia
gate and to the background signals; hence, false-positive results
from background signals in this gate cannot be excluded. Given
the fact, that we had some zero oocyst counts and did detect
cysts in the single digit range the number of false positives
cannot be very high. The recoveries evaluated by FCM are
listed in Table 2.
Immunofluorescent Microscopy. It was possible to
clearly identify labeled Giardia spp. and Cryptosporidium spp.
(oo)cysts based on shape, size, and FITC-fluorescence. Since
the portable microscope used did not include a violet or UV
light source, we were unable to visualize the distinct nuclei with
the additional DAPI-staining as proposed by USEPA 1623.24
Often fluorescent particles such as algae and supposedly
fragments from destroyed oocysts were observed. The drying of
the samples on the slides may have destroyed some of the
oocysts.
qPCR. The linear equations of the Ct values for the controls
(10 2−10 5 oo(cysts)/mL) were y(log10) = −0.4332x + 16.12
(R2 = 0.9677), and y(log10) = −0.295x + 11.9 (R2 = 0.986) for
Giardia and Cryptosporidium, respectively.
For Giardia, the quantification by PCR, if successful,
performed well, but for almost 50% of the cases we did not
obtain a result. For Cryptosporidium only two of the 27 samples
tested showed a positive result (Figure 2).
Figure 3. Linear regression for FCM versus IFM quantification.
For Cryptosporidium parvum, concentrations ranged from 0
to 220 oocysts per liter for IFM, and from 0 to 240 oocysts per
liter for FCM detection. While PCR detection failed except for
two samples, FCM and IFM did give consistently similar results
with 67% of the samples with higher FCM counts. The Pearson
correlation for the results from all surface water samples was r =
E
dx.doi.org/10.1021/es301974m | Environ. Sci. Technol. XXXX, XXX, XXX−XXX
Environmental Science & Technology
Article
0.767, p < 0.0001, n = 24 and a linearization function of y =
0.60x − 5.0 for the surface water samples (Figure 3).
Overviews of the measured (oo)cyst concentrations per
sampling point and the reduction of oo(cysts) from wastewater
inlet to downstreams locations can be found in the Supporting
Information (Figures S6 and S7).
Vegetable Samples. We sampled irrigation water, lettuce
and Morning Glory to test for contamination due to their
exposure to canal water. Directly after harvesting the lettuce
was briefly washed by the farmers with irrigation water to
eliminate the soil prior to being sold on the market. Therefore,
we took samples from unwashed and washed lettuce. The
Morning Glory was directly harvested in the canal, as this plant
grows on the water surface. Consistent with the assumption
that the fecal contamination from the wastewater will eventually
contaminate the food, we found up to 50 Giardia cysts and up
to 10 Cryptosporidium oocysts in the salad and Morning Glory
per 200 g of sample (Table 1).
Comparison to Other Parameters Measured. For all
other measured parameters, we found high and variable values
underlining the high complexity of this matrix (Figure S8 of the
SI). Apart from the above-described obvious correlations
between the Giardia and Cryptosporidium data obtained with
different methods (FCM and IFM), we also found some with
the other measured parameters. HPC and E. coli counts
correlated well (Pearson; r > 0.5; p < 0.005) with the Giardia
cyst load. Surprisingly, the TCC did not correlate with any
other parameter, whereas the conductivity did correlate well
with turbidity, E. coli, and HPC counts (Table S3 of the SI).
cells by repeated freeze and thaw cycles, which was shown to be
crucial for DNA extraction efficiency. Since dry and liquid
nitrogen are neither easy to transport by air cargo nor
everywhere available, freezing of the samples had to be
performed at −20 °C, which substantially prolonged the cell
disruption process. These suboptimal conditions might have led
to a lower extraction yield due to DNA degradation processes
and inefficient cell disruption. Last but not least, the biological
complexity of the sample matrix may impair primer specificity
and lower the PCR efficiency due to inhibitors.
FCM detection was very fast and convenient and worked
very satisfactory for Giardia. The performed single-staining
approach lead to the Cryptosporidium cluster being very close to
the background and Giardia cyst signals, leading to a risk of
some false-positive signals. Nevertheless, the detection method
might be improved by another double-staining approach that
helps in discriminating, e.g., autofluorescent algae from
oo(cysts), and decrease the risk for false-positive results.
Furthermore, the integration of viability indicator stains, such as
propidium iodide revealing oo(cyst) integrity with good
correlation to in vitro excystation protocols,39 would further
improve these methods.
For assessing the pathogen flow in a water system based on
the reduction of cysts by IFM and FCM we showed that both
methods provide similar results (Figure S7 of the SI).
In summary, Giardia FCM and IFM compared sufficiently
well, whereas for Cryptosporidium the FCM method needs
improvement. Nevertheless, compared to USEPA 1623 our
method performs sufficiently well, as our approach does meet
the minimum criteria for USEPA 1623 that are 11 to 100%
recovery of Cryptosporidium and 14 to 100% recovery of
Giardia. Furthermore, two studies employing USEPA 1623
found average recoveries in high turbid samples to be 0.5−22%
and 17−35% for Giardia and Cryptosporidium detection,
respectively.27,40 This underlines the potential usefulness of
the here presented purification approach.
Since the successful application of PCR in highly soiled
samples was demonstrated previously,30−32 we conclude that
PCR is dependent on optimal conditions that cannot be easily
maintained in field campaigns. IFM has the advantage of visual
confirmation and higher specificity, whereas the FCM method
is more sensitive and faster, since the time per analysis takes
only 4 min instead of 30 and more minutes for the microscopic
counting. At the state of the art presented here, we propose to
apply FCM for the initial rapid screening of water samples with
IFM as a useful addition for control and confirmation in case of
ambiguous FCM results.
Pathogen Concentrations. Although we did not adjust
the presented data according to the determined recovery, the
observed contamination with pathogens was substantial. The
reduction of organisms was very variable from wastewater inlet
to exposure locations and, therefore, the spatial distance from
the wastewater inlet cannot provide safety (Figures S6 and S7
of the SI). Consequently, the infection risk when in contact
with these waters is very high and precautions similar to when
dealing with wastewater are recommended. We could
demonstrate that the brief salad wash prior to distribution
did not reduce the pathogen load. As the vegetables were
considerably contaminated and other sources of contamination
were out of the question, we could show the transfer of
pathogens from the wastewater to foodstuffs.
Outlook. Rapid detection tools for microorganisms based
on molecular and immunological technology can be trans-
■
DISCUSSION
Laboratory Setup. For this 2-week mission, all instrumentation, consumables, and additional equipment was transported from Switzerland to Thailand and our lab was set up in
the Asian Institute of Technology. Although based in a
laboratory, we used only lab benches, fridges, freezers, and
electricity to carry out the three methods. If necessary, for
completely remote and independent field missions, all of these
could be made available, since all of our instrumentation can be
run on 12 V batteries.
Methods. Our IMS approach employed superparamagnetic
particles that require a high gradient magnetic field and the
passage through a column for enrichment. This approach was
sufficient for our samples but obviously the performance was
reduced compared to other surface water samples (average
recoveries >80%, 10), as these columns are neither designed nor
optimized for surface water samples and are prone to clog very
fast. Beads with stronger paramagnetic properties of the beads
would be advantageous to allow a magnetic separation without
a column.
IFM detection was very tedious and time-consuming, though
the visual confirmation of the size and morphology is a great
benefit of this method. In highly turbid samples, the major
drawback is the formation of layers of particles on the filter,
which can cover and obscure the fluorescent target organisms.
Missing of (oo)cysts due to viewer fatigue may also be a reason
for the consistently lower count of IFM versus FCM.
The poor performance of PCR to detect Giardia and
Cryptosporidium in the tested water samples can be attributed to
multiple factors. Since we had no possibility to restrict the
elution volume of the DNA extraction (e.g., by SpeedVac) only
a small fraction (5 μL of 200 μL) could be employed for a
single PCR run. A further issue might be the disruption of the
F
dx.doi.org/10.1021/es301974m | Environ. Sci. Technol. XXXX, XXX, XXX−XXX
Environmental Science & Technology
Article
(11) Laberge, I.; Griffiths, M. W.; Griffiths, M. W. Prevalence,
detection and control of Cryptosporidium parvum in food. Int. J. Food
Microbiol. 1996, 32, 1−26.
(12) Karanis, P. Giardia and Cryptosporidium: Occurrence in water
supplies. In Encyclopedia of Environmental Health; Elsevier: Burlington,
2011; pp 946−954.
(13) Smith, H. V.; Cacciò, S. M.; Cook, N.; Nichols, R. A. B.; Tait, A.
Cryptosporidium and Giardia as foodborne zoonoses. Vet. Parasitol.
2007, 149, 29−40.
(14) Smith, H. V.; Rose, J. B. Waterborne cryptosporidiosis. Parasitol.
Today 1990, 6, 8−12.
(15) Monis, P. .; Thompson, R. C. Cryptosporidium and Giardiazoonoses: Fact or fiction? Infect. Genet. Evol. 2003, 3, 233−244.
(16) Marshall, M.; Naumovitz, D.; Ortega, Y.; Sterling, C.
Waterborne protozoan pathogens. Clin. Microbiol. Rev. 1997, 10,
67−85.
(17) Rose, J. B.; Slifko, T. R. Giardia, Cryptosporidium, and Cyclospora
and their impact on foods: A review. J. Food Prot. 1999, 62, 1059−
1070.
(18) LeChevallier, M. W.; Norton, W. D.; Lee, R. G. Occurrence of
Giardia and Cryptosporidium spp. in surface water supplies. Appl.
Environ. Microbiol. 1991, 57, 2610−2616.
(19) Smith, H. V.; Nichols, R. A. B. Cryptosporidium: Detection in
water and food. Exp. Parasitol. 2010, 124, 61−79.
(20) Smith, R.; Von Tress, M.; Tubb, C.; Vanhaecke, E. Evaluation of
the ScanRDI as a rapid alternative to the pharmacopoeial sterility test
method: Comparison of the limits of detection. PDA J. Pharm. Sci.
Technol. 2010, 64, 356−363.
(21) Rendtorff, R. C. The experimental transmission of Giardia
lamblia among volunteer subjects. In Waterborne Transmission of
Giardiasis; U.S. Environmental Protection Agency: Cincinnati, OH,
1978; pp 64−81.
(22) Rendtorff, R. C. The experimental transmission of human
intestinal protozoan parasites. II. Giardia lamblia cysts given in
capsules. Am. J. Hyg. 1954, 59, 209−220.
(23) Chappell, C. L.; Okhuysen, P. C.; DuPont, H. L.; Sterling, C. R.;
Tzipori, S. Chapter 7 - Cryptosporidium parvum volunteer study:
Infectivity and immunity. In Cryptosporidium; Elsevier: Amsterdam,
2003; pp 79−81.
(24) U.S. Environmental Protection Agency USEPA method 1623:
Cryptosporidium and Giardia in water by filtration/IMS/FA. In; EPA
821-R-01−025; Office of Water, U. S. Environmental Protection
Agency: Washington, D.C., 2005; Vol. EPA 821-R-01−025.
(25) Guillot, E.; Loret, J. F. Waterborne Pathogens: Review for the
Drinking Water Industry; IWA Publishing: London, United Kingdom,
2010.
(26) Clancy, J. L.; Gollnitz, W. D.; Tabib, Z. Commercial labs: How
accurate are they? J. Am. Water Works Assoc. 1994, 89−97.
(27) DiGiorgio, C. L.; Gonzalez, D. A.; Huitt, C. C. Cryptosporidium
and Giardia recoveries in natural waters by using Environmental
Protection Agency method 1623. Appl. Environ. Microbiol. 2002, 68,
5952−5955.
(28) Goldstein, S. T.; Juranek, D. D.; Ravenholt, O.; Hightower, A.
W.; Martin, D. G.; Mesnik, J. L.; Griffiths, S. D.; Bryant, A. J.; Reich, R.
R.; Herwaldt, B. L. Cryptosporidiosis: An outbreak associated with
drinking water despite state-of-the-art water treatment. Ann. Intern.
Med. 1996, 124, 459−468.
(29) Mac Kenzie, W. R.; Schell, W. L.; Blair, K. A.; Addiss, D. G.;
Peterson, D. E.; Hoxie, N. J.; Kazmierczak, J. J.; Davis, J. P. Massive
outbreak of waterborne Cryptosporidium infection in Milwaukee,
Wisconsin: recurrence of illness and risk of secondary transmission.
Clin. Infect. Dis. 1995, 21, 57−62.
(30) Anceno, A. J.; Ozaki, M.; Dang, Y. N. D.; Chuluun, B.; Shipin,
O. V. Canal networks as extended waste stabilization ponds: Fate of
pathogens in constructed waterways in Pathumthani Province,
Thailand. Water Sci. Technol. 2007, 55, 143−156.
(31) Diallo, M. B. C.; Anceno, A. J.; Tawatsupa, B.; Houpt, E. R.;
Wangsuphachart, V.; Shipin, O. V. Infection risk assessment of
ported by plane and set into operation within a few hours. With
these new techniques and instrumentation, it is possible to
analyze different environmental samples for protozoan
pathogens within hours. This approach can also be adapted
for the detection of pathogenic bacteria 41 and other sample
matrices. In particular, FCM detection appeared to be very
convenient, and given some optimizations, it allows an easy,
fast, cost-effective (∼30 USD vs >200 USD for USEPA 1623
consumables cost per sample 42), and reliable monitoring with
considerable potential for automation. Therefore, we believe
that in the near future this detection method could be applied
successfully by intervention units abroad.
■
ASSOCIATED CONTENT
S Supporting Information
*
Detailed descriptions of the sampling sites, methods, and data.
This material is available free of charge via the Internet at
.
■
AUTHOR INFORMATION
Corresponding Author
*.
Notes
The authors declare no competing financial interest.
■
ACKNOWLEDGMENTS
We thank Dr. Ho Ky Quang Minh for his assistance in
analyzing the physicochemical parameters. We thank the
Federal Office for Civil Protection (Spiez Laboratory), the
Swiss Federal Institute of Aquatic Science, and Technology
(Eawag) the Swiss Federal Office for Public Health (FOPH),
and the Swiss National Centre of Competence in Research
(NCCR) North-South for the financial backing of this project.
■
REFERENCES
(1) Wampler, P. Pick sanitation over vaccination in Haiti. Nature
2011, 470, 175.
(2) Webster, P. C. Lack of clean water exacerbates cholera outbreak
in Haiti. CMAJ 2011, 183, E83−E84.
(3) McCoy, W. F.; Olson, B. H. Relationship among turbidity,
particle counts and bacteriological quality within water distribution
lines. Water Res. 1986, 20, 1023−1029.
(4) Bej, A. K.; McCarty, S. C.; Atlas, R. M. Detection of coliform
bacteria and Escherichia coli by multiplex polymerase chain reaction:
Comparison with defined substrate and plating methods for water
quality monitoring. Appl. Environ. Microbiol. 1991, 57, 2429−2432.
(5) Allen, M. J.; Edberg, S. C.; Reasoner, D. J. Heterotrophic plate
count bacteriaWhat is their significance in drinking water? Int. J.
Food Microbiol. 2004, 92, 265−274.
(6) Reasoner, D. J. Heterotrophic plate count methodology in the
United States. Int. J. Food Microbiol. 2004, 92, 307−315.
(7) Diamond, L. S.; Harlow, D. R.; Cunnick, C. C. A new medium for
the axenic cultivation of Entamoeba histolytica and other Entamoeba.
Trans. R. Soc. Trop. Med. Hyg. 1978, 72, 431−432.
(8) Rice, E. W.; Schaefer, F. W. Improved in vitro excystation
procedure for Giardia lamblia cysts. J. Clin. Microbiol. 1981, 14, 709−
710.
(9) Robertson, L. J.; Campbell, A. T.; Smith, H. V. In vitro
excystation of Cryptosporidium parvum. Parasitology 1993, 106 (Pt 1),
13−19.
(10) Keserue, H.-A.; Füchslin, H. P.; Egli, T. Rapid detection and
enumeration of Giardia lamblia cysts in water samples by
immunomagnetic separation and flow cytometric analysis. Appl.
Environ. Microbiol. 2011, 77, 5420−5427.
G
dx.doi.org/10.1021/es301974m | Environ. Sci. Technol. XXXX, XXX, XXX−XXX
Environmental Science & Technology
Article
diarrhea-related pathogens in a tropical canal network. Sci. Total
Environ. 2008, 407, 223−232.
(32) Guy, R. A.; Payment, P.; Krull, U. J.; Horgen, P. A. Real-time
PCR for quantification of Giardia and Cryptosporidium in environmental water samples and sewage. Appl. Environ. Microbiol. 2003, 69,
5178−5185.
(33) Hammes, F.; Berney, M.; Wang, Y.; Vital, M.; Köster, O.; Egli,
T. Flow-cytometric total bacterial cell counts as a descriptive
microbiological parameter for drinking water treatment processes.
Water Res. 2008, 42, 269−277.
(34) APHA, AWWA, and WPCF 9215 Heterotrophic plate count. In
Standard Methods for the Examination of Water and Wastewater;
American Public Health Association: Washington, DC., USA., 2005.
(35) APHA, AWWA, and WPCF 9221 F. Escherichia coli procedure.
In Standard Methods for the Examination of Water and Wastewater;
American Public Health Association: Washington, DC., USA., 2005.
(36) Rochelle, P. A.; De Leon, R.; Stewart, M. H.; Wolfe, R. L.
Comparison of primers and optimization of PCR conditions for
detection of Cryptosporidium parvum and Giardia lamblia in water.
Appl. Environ. Microbiol. 1997, 63, 106−114.
(37) McIntyre, L.; Hoang, L.; Ong, C. S. L.; Lee, P.; Isaac-Renton, J.
L. Evaluation of molecular techniques to biotype Giardia duodenalis
collected during an outbreak. J. Parasitol. 2000, 86, 172−177.
(38) Cacciò, S. M.; De Giacomo, M.; Aulicino, F. A.; Pozio, E.
Giardia cysts in wastewater treatment plants in Italy. Appl. Environ.
Microbiol. 2003, 69, 3393−3398.
(39) Campbell, A. T.; Robertson, L. J.; Smith, H. V. Viability of
Cryptosporidium parvum oocysts: correlation of in vitro excystation
with inclusion or exclusion of fluorogenic vital dyes. Appl. Environ.
Microbiol. 1992, 58, 3488−3493.
(40) Krometis, L.-A. H.; Characklis, G. W.; Sobsey, M. D.
Identification of particle size classes inhibiting protozoan recovery
from surface water samples via U.S. Environmental Protection Agency
Method 1623. Appl. Environ. Microbiol. 2009, 75, 6619−6621.
(41) Füchslin, H. P.; Kötzsch, S.; Keserue, H.-A.; Egli, T. Rapid and
quantitative detection of Legionella pneumophila applying immunomagnetic separation and flow cytometry. Cytometry 2010, 77A, 264−
274.
(42) Feng, Y.; Zhao, X.; Chen, J.; Jin, W.; Zhou, X.; Li, N.; Wang, L.;
Xiao, L. Occurrence, source, and human infection potential of
Cryptosporidium and Giardia spp. in source and tap water in Shanghai,
China. Appl. Environ. Microbiol. 2011, 77, 3609−3616.
H
dx.doi.org/10.1021/es301974m | Environ. Sci. Technol. XXXX, XXX, XXX−XXX