Characteristics of the recirculation sector of fintish aquaculture in the united statesand canada
Bạn đang xem bản rút gọn của tài liệu. Xem và tải ngay bản đầy đủ của tài liệu tại đây (1.44 MB, 19 trang )
Cha
ra
c
t
e
r
i
s
t
i
c
so
fth
eR
e
c
i
r
cu
la
t
ionS
e
c
to
ro
fF
in
t
i
sh
Aqua
cu
l
tu
r
einth
eUn
i
t
edS
ta
t
e
sandCanada
2,E
J
.D
e
l
abb
io1*
,B
.R
.Mu
rphy1,G
.R
. John
son
.H
a
l
l
e
rm
an1
1
V
i
rg
in
i
aPo
ly
t
e
chn
i
cIn
s
t
i
tu
t
eandS
t
a
t
eUn
iv
e
r
s
i
ty
D
ep
t
.F
i
sh
e
r
i
e
sandW
i
ld
l
i
f
eS
c
i
en
c
e
s
B
l
a
ck
sbu
rg
,V
i
rg
in
i
a 24061
-0321USA
F
i
shP
a
tho
logyUn
i
t
,A
t
l
an
t
i
cV
e
t
e
r
in
a
ryCo
l
l
eg
e
,
fP
r
in
c
eEdw
a
rdI
s
l
and
Un
iv
e
r
s
i
tyo
,C
an
ad
a
Ch
a
r
lo
t
t
e
town
,PE
IEOG2XO
2
*Correspondingauthor
,cu
r
r
en
tadd
r
e
s
s
:
B
lu
e
f
i
e
ldS
t
a
t
eCo
l
l
eg
e
P
.O
.Box286
B
lu
e
f
i
e
ld
,W
e
s
tV
i
rg
in
i
a2
4
7
0
1USA
E
-m
a
i
l
:jd
e
l
abb
io@b
lu
e
f
i
e
ld
.wvn
e
t
.
edu
ABSTRACT
Inth
eau
tumno
f2001
,asu
rv
eyw
a
scondu
c
t
edtoex
am
in
eb
a
s
i
cf
a
rm
p
rodu
c
t
ionandhum
anr
e
sou
r
c
ech
a
r
a
c
t
e
r
i
s
t
i
c
so
fr
e
c
i
r
cu
l
a
t
ionf
a
c
i
l
i
t
i
e
s
inth
eUn
i
t
edS
t
a
t
e
sandC
an
ad
acu
r
r
en
t
lyg
row
ingf
in
f
i
sh
.An 86%
f
r
e
spon
s
er
a
t
ew
a
sa
ch
i
ev
ed
.Th
esu
rv
eyd
a
t
aind
i
c
a
t
eth
a
tth
i
ss
e
c
to
ro
aqu
a
cu
l
tu
r
ei
squ
i
t
eh
e
t
e
rog
en
eou
s
.Th
enumb
e
randpound
so
ff
i
sh
p
rodu
c
edi
squ
i
t
ev
a
r
i
ab
l
e
,w
i
thp
r
e
s
en
c
eo
fsm
a
l
l
,m
ed
ium
-andl
a
rg
e
s
i
z
edf
a
rm
sinth
i
ss
e
c
t
o
r
.R
e
c
i
r
cu
l
a
t
iont
e
chno
log
i
e
sa
r
eemp
loy
edto
fbo
thw
a
rmw
a
t
e
randco
ldw
a
t
e
rf
i
sh
e
sinbo
th
cu
l
tu
r
eaw
id
ev
a
r
i
e
tyo
s
a
l
tw
a
t
e
randf
r
e
shw
a
t
e
rs
i
tu
a
t
ion
s
.Th
efou
rf
i
sh
e
smo
s
t common
ly
g
rowninr
e
c
i
r
cu
l
a
t
ionun
i
t
sinth
eUn
i
t
edS
t
a
t
e
sandC
an
ad
aa
r
eA
t
l
an
t
i
c
s
a
lmonsmo
l
t
s
,t
i
l
ap
i
a
,hyb
r
ids
t
r
ip
edb
a
s
sando
rn
am
en
t
a
lf
i
sh
e
s
.Ah
igh
p
ropo
r
t
iono
ff
a
c
i
l
i
t
i
e
su
s
ingr
e
c
i
r
cu
l
a
t
iont
e
chno
log
i
e
su
s
epump
ed
ff
a
c
i
l
i
t
i
e
s
g
roundw
a
t
e
ra
sap
r
im
a
ryw
a
t
e
rsou
r
c
e
.Ov
e
r40%o
r
ep
r
e
s
en
t
edinth
esu
rv
eyr
e
lyonas
ing
l
ew
a
t
e
rsou
r
c
etosu
s
t
a
inth
e
i
r
op
e
r
a
t
ionandh
av
en
os
e
cond
a
ryw
a
t
e
rsou
r
c
ea
sb
a
ckup
.M
an
ag
em
en
t
fr
e
c
i
r
cu
l
a
t
ionf
a
c
i
l
i
t
i
e
sa
r
eh
igh
lyedu
c
a
t
ed
;mo
r
e th
an74%
p
e
r
sonn
e
lo
o
fr
e
spond
en
t
sr
epo
r
t
edho
ld
inga
tl
e
a
s
tanund
e
rg
r
adu
a
t
ed
eg
r
e
e
.Th
e
m
a
jo
r
i
ty o
fp
e
r
sonn
e
lm
an
ag
ing r
e
c
i
r
cu
l
a
t
ionf
a
c
i
l
i
t
i
e
sa
r
em
idd
l
e
ag
ed
ind
iv
idu
a
l
swhoh
av
eov
e
r1
0y
e
a
r
so
fr
e
l
a
t
edwo
rkexp
e
r
i
en
c
e
.Th
e
In
t
e
rn
a
t
ion
a
lJou
rn
a
lo
fR
e
c
i
r
cu
l
a
t
ingAqu
a
cu
l
tu
r
e
,Vo
lum
e4
5
findings of this study represent the first empirical description of the
recirculation sector of finfish aquaculture in the United States and
Canada.
INTRODUCTION
Over the past 25 years, aquaculture has been one of the fastestgrowing sectors of US agriculture. In 1974, the farm gate value of all
US aquaculture products was $45 million; by 1998, it had increased
to almost $1 billion (USDA 2000). The 1998 Federal Census on
Aquaculture (USDA 2000) indicated that there were over 4,000
aquaculture operations in the United States. These operations
represent all sectors of aquaculture production (mollusks, finfish,
crustaceans and plants). Many of these operations are quite small.
Almost 50% of the aquaculture operations in the United States have
an annual income of $25,000 or less (USDA 2000). These census data
show that only a small percentage of the total US aquaculture
industry currently uses recirculation technology. Of the 4,000
operations in existence, only 328 US fish farms identify themselves
as "recirculation" facilities. However, due to the use of unclear
terminology in the census, this number may be inflated and therefore
misleading. The definition identifying recirculation operations was
"reuse of water in an aquaculture facility (closed system) rather than
releasing into nature and continually being replaced by new water
(open system)". The use of this definition allowed a variety of
activities that are pseudo-aquaculture in nature to be included under
the recirculation category. For example, among the 328 recirculation
facilities identified were operations run by fishermen to hold captured
wild crustaceans during market lulls and when the animals are preand post-molt (and therefore less marketable).
The Canadian aquaculture industry also has grown substantially
over the past two decades. Between 1984 and 1995, Canadian
aquaculture production increased at an annual rate of 21.6% (FAO
1997). The Canadian Aquaculture Industry Alliance (CAIA) predicted
that finfish producers will double 2001 production by the year 2006
(OCAD 2001). Similar to the US industry, the recirculation sector of
the Canadian aquaculture industry lacks quantitative and qualitative
description.
6
International Journal of Recirculating Aquaculture, Volume 4
METHODS
A survey instrument was developed and administered to gather baseline
information about facilities using recirculation technology in the United
States and Canada. For this study, the defining element for a recirculation
facility was that the operation "had to use a biofilter in its fish culture
system". Information on currently operating recirculation facilities was
obtained from three different and independent sources:
( 1) government aquaculture representatives for each state and province,
(2) representatives from national associations representing particular
sectors of aquaculture, and
(3) feed company representatives and research groups who have
professional interaction with the recirculation sector of aquaculture.
Information from the three sources was cross-referenced to develop a
final mailing list representing the current status of this sector. The initial
sampling frame consisted of 162 facilities.
In spring 2001, the survey questionnaire and mailing protocol were
developed using a modified version of Dillman's Total Design Method
(TDM) (Dillman 1978). The questionnaire was pre-tested with six different
managers of finfish rearing units in the United States and Canada. These
managers represented different components of the finfish sector (business,
research and demonstration facilities) and were asked to complete the
questionnaire, give detailed comments on areas for improvement, and
identify areas of ambiguity. Following the pre-test, the questionnaire was
revised, printed, and mailed to 162 facilities in the United States and
Canada. The questionnaire was composed of 43 questions. Three
consecutive mailings were made during the fall of 2001. Each mailing
included a cover letter, the complete questionnaire, and a stamped, return
envelope. An incentive (a cookbook of farmed trout recipes) was offered to
those respondents who returned the questionnaire promptly. Respondents
were identified by a randomly-assigned number only.
Data Analysis
Response data were analyzed using Statistical Package for Social
Sciences (SPSS, version 11.0, SPSS Inc., Chicago, IL, USA) software.
Most of the data collected through the survey were nominal in nature;
International Journal of Recirculating Aquaculture, Volume 4
frequency distributions were constructed for responses to all questions
within nominal response categories. There were four continuous
variables in the results; frequency distributions and other summary
statistics were produced for these variables.
RESULTS
Overall, there was an 86% response rate to the survey. Correctly
identifying the target people (names and addresses) before the first
mailing of the questionnaire was key to achieving the high response rate
of this study. One hundred and forty-one completed questionnaires were
returned, but 10 of the respondents did not use a biofilter in their
operation, and therefore did not fit the study's defining frame of a
"recirculation" facility. The following results, therefore, incorporate data
obtained from 131 facilities in the United States and Canada. Seventyone percent of the respondents were from the United States (n=93) and
29% were from the Canada (n=38). The data represent information
obtained from facilities in 32 states and 8 provinces.
Production Characteristics of Recirculation Units
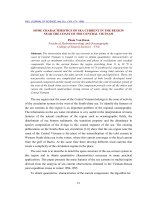
The recirculation sector of aquaculture is composed of small-, mediumand large-sized farms (Figure 1). A breakdown of the sector by size of
production (annual volume of fish) shows that the majority of
recirculation operations (58%) produce 22,679.6 kg (50,000 lbs) or less
of fish per year. Medium-sized farms (producing >22,680.1 kg [50,000
lbs] to 113,398.1 kg [250,000 lbs] of fish per year) comprise 25% of the
sector. The remaining 17% of the farms are large farms that individually
produce over 113,398 kg (250,000 lbs) of fish per year. Five very large
farms (annual production greater than 453,592.4 kg [1 million pounds])
responded to the survey. Two of these farms produce tilapia
(Oreochromis spp.), and one each grow Atlantic salmon (Salmo salar),
chinook salmon (Oncoryhynchus tchawytscha), and hybrid striped bass
(Marone sp.). Annual production expressed as number of fish produced
was similar to production by weight (Table 1). Small-sized farms,
producing fewer than 50,000 fish annually, comprised 41 % of the
respondents, medium-sized farms, those producing 50,000 to 500,000
fish per year comprised 26% of the respondents, and large-sized farms,
those growing more than 500,000 fish per year represented 28%.
International Journal of Recirculating Aquaculture, Volume 4
o-2,268 (O - 5,000 lbs)
-
~
2,268.4 - 4,536 (5001 - 10,000 lbs)
-o
4,536.4 - 9072 (10,001 - 20,000 lbs)
Q)
g
9,072.3 - 22,679.6 (20,001 - 50,000 lbs)
e
22,680.1 - 45,359.2 (50,001 - 100,000 lbs)
~
45,359.7 -113,398.1 (100,001 - 250,000 lbs)
-0
a..
::::s 113,398.5 - 226,796.2 (250,001 - 500,000 lbs)
~
226,796.6 - 453,592.4 (500,001 - 1 million lbs)
more than 453,592.4 (more than 1 million lbs)
0
10
20
30
40
50
Frequency
Figure I: Annual production (kg) for recirculation facilities in the United States and Canada.
Fish Produced
Count
Percent Cumulative Percent
31
24.4
24.4
10,001 - 20,000 fish
7
5.5
29.9
20,001 - 50,000 fish
14
11.0
40.9
50,001 - 100,000 fish
7
5.5
46.5
100,001 - 250,000 fish
12
9.4
60.6
250,001 - 500,000 fish
14
11.0
71.7
500,001 - million fish
12
9.4
81.1
1 million - 1.5 million fish
12
9.4
90.6
more than 1.5 million fish
12
9.4
100.0
127
100.0
O- 10,000 fish
Total
Table I: Annual numbers offish produced in recirculation facilities in the United States and
Canada
International Journal of Recirculating Aquaculture, Volume 4
9
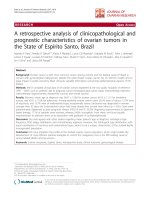
Eighty-five percent of recirculation facilities were freshwater
operations (Figure 2). The primary water source for 48% of the
respondents was well water. Chlorinated municipal water was the second
most common primary water supply (24%) for recirculation facilities.
The respondents were also queried regarding secondary water sources
used during a production cycle. Well water (28%) and chlorinated
municipal water (18%) were the most commonly used secondary water
sources for recirculation facilities (Table 2). Surface water was used by
14% of the respondents as a secondary water source. However, over
40% of the facilities used only a single water source and did not have a
secondary water source for use in times of emergency.
well water
48.1%
chlorinated water
23.7%
other
3.8%
artificial seawater
5.3%
spring water
7.6%
surface water
5.3%
pumped seawater
6.1%
Figure 2: Main source of water for recirculation units in the United States and Canada.
Sixty-two percent (62%) of respondents used recirculation technology
for business purposes, i.e., for profit-oriented production (Table 3). At
present, recirculation technology is not frequently used for education (8%
of respondents) or for demonstration (3%) purposes. However, the survey
population included only college and university aquaculture programs and
did not include secondary schools. We recognize that many secondary
schools use small-scale recirculation systems in their natural science and
agriculture curricula (there are over 20 of these units in secondary schools
10
International Journal of Recirculating Aquaculture, Volume 4
Source of Water
well water - fresh
chlorinated water
surface water
artificial saltwater
pumped saltwater
spring water
reverse osmosis
saltwater well
only one water source
Total responses
1
Count
Percent
Responses
Percent 1
Cases
34
22
17
6
5
5
4
3
50
23.3
15.1
11.6
4.1
3.4
3.4
2.7
2.1
34.2
27.6
17.9
13.8
4.9
4.1
4.1
3.3
2.4
40.7
146
100.0
118.7
Respondents we1-e allowed to report more than one answei'. Indicated percent represents the proportion of respondents
reporting each particular answer.
Table 2: Secondary source of water supply for recirculation facilities in the United States and
Canada.
Purpose
Business
Research
Education
Demonstration
Total
Count
Percent
81
37
10
3
61.8
28.6
7.6
2.3
131
100.0
Table 3: Main purpose ofrecirculation operations in United States and Canada.
in the State of West Virginia alone; (Don Michael, WV Dept. of
Education, personal communication). However, these secondary school
units have little or no production output, and many are not functional yearround; thus, they were excluded from the survey population.
For respondents who indicated that business was the main purpose for
using recirculation technology (Table 4), the most common business
activities were: 1) growing fish for the food market (59%), 2) growing
fish for sale to other farmers for grow-out (46%) and 3) supplying fish
eggs to others (21 %). Under the heading "other business activities",
public aquaria, education outreach, and supplying fry to others for growout to smolt stage were each identified more than once.
International Journal of Recirculating Aquaculture, Volume 4
11
Business activity
Grow food fish to market size
Supply fish for others to grow-out
Supply fish eggs to others
Grow fish for the ornamental market
Grow fish for stocking in natural waters
Grow fish for the bait market
Other
1
Count
Percent
51
40
18
14
11
2
10
58.6
45.5
20.7
16.1
12.6
2.3
11.5
1
Respondents were allowed to mention more than one answer. Indicated percent represents the proportion of respondents
mentioning each particular answer.
Table 4: Types of business activities using recirculation technology in the United
States and Canada.
The four fish types most frequently grown in recirculation facilities in
the United States and Canada are tilapia (15%), Atlantic salmon (13%),
ornamental fishes (9%) and hybrid striped bass (8%) (Table 5).
Collectively, these four fish types constitute 45% of the sector. Fishes
belonging to the family Salmonidae represented almost 28% of the fish
taxa grown as the primary crop in recirculation facilities. Seventeen
different categories of fish were identified in the questionnaire, plus a
write-in area to report on other fish types not mentioned in the
questionnaire. In the "other" category (n=48), a wide variety of different
species were reported, including some saltwater species (Table 6).
When operators were asked to identify which taxa of fishes they had
grown in the past, more facilities had grown rainbow trout
(Oncorhynchus mykiss) than any other fish type (46% of cases) (Table 7).
Tilapia was the second most common fish type grown in the past (39%
of cases).
The three life stages most commonly reared in recirculation operations
(Table 8) were fingerlings (96% ), fry (77% ), and eggs (73% ). Smolts
constituted the smallest percentage of life stages grown (27% ), but this is
not surprising since this life stage is specific only to the group of
facilities that grow salmonids.
Many facilities did not know the survival rates of the earliest life stages,
but they did have this information for later life stages (Table 9). Overall,
the highest rates of survival were found in the later life stages. From fry to
12
International Journal of Recirculating Aquaculture, Volume 4
Count
Name
26
23
15
14
Tilapia spp.
Atlantic salmon
Ornamental fishes
Hybrid striped bass
Arctic charr
Flatfish
Rainbow trout
Yellow perch
Brook trout
Chinook salmon
Sturgeon
Brown trout
Catfish
Baitfishes
Bass - LM and SM
Sunfishes
Others
9
9
8
8
5
3
3
1
1
1
1
1
48
Percent
Responses
14.8
13.1
8.5
8.0
5.1
5.1
4.5
4.5
2.8
1.7
1.7
0.6
0.6
0.6
0.6
0.6
27.3
Table 5: Types or species offish currently produced in recirculation facilities in the United
States and Canada.
Freshwater species
lake whitefish
hybrid carp
walleye
tiger trout
paddlefish
razorback sucker
white bass
cobia
coho salmon
white seabass
bonytail
mummichog
carp
grass carp
striped bass
pacu
Rio Grande silvery minnow
Japanese medaka
Marine species
cod
sea bream
haddock
Asian catfish
muttonfish
black sea bass
Table 6: "Other" fishes grown as primary production (fish crop) in recirculation
facilities in the United States and Canada.
International Journal of Recirculating Aquaculture, Volume 4
13
Name
Rainbow trout
Tilapia spp.
Ornamental fishes
Hybrid striped bass
Catfish
Atlantic salmon
Sturgeon
Sunfish
Brook trout
Yellow perch
Baitfish
Bass- LM and SM
Arctic charr
Chinook salmon
Flatfishes
Brown trout
Chum salmon
Others
Total responses
1
Percent
Responses
Percent 1
Cases
36
30
26
21
19
17
16
16
15
15
14
14
14
8
8
5
2
24
12.0
10.0
8.7
7.0
6.3
5.7
5.3
5.3
5.0
5.0
4.7
4.7
4.7
2.7
2.7
1.7
0.7
8.0
46.2
38.5
33.3
26.9
24.4
21.8
20.5
20.5
19.2
19.2
17.9
17.9
17.9
10.3
10.3
6.4
2.6
30.8
300
100.0
384.6
Count
Respondents were allowed to mention more than one answer. Indicated percent represents the proportion of respondents
mentioning each particular answer.
Table 7: Fishes that have been grown in the past in current recirculation units in the United
States and Canada.
Percent of
Responses
Percent
Cases
Life stage
Count
Egg
Fry
Fingerling
Smalt
Yearling
Adult fish
Food market-sized fish
Broodfish
94
99
124
34
68
83
69
70
14.7
15.4
19.3
5.3
10.6
12.9
10.8
10.9
72.9
76.7
96.1
26.4
52.7
64.3
53.5
54.3
Total responses
641
100.0
496.9
1 Respondents
1
were allowed to mention more than one answei: Indicated percent repre.
Table 8: Life stages grown in recirculation facilities in the United States and Canada.
14
International Journal of Recirculating Aquaculture, Volume 4
market-sized fish, over 50% of the respondents reported survival rates of
90% or greater. Survival rates of the different life stages is a point of
sensitivity both from a business performance standpoint and in terms of
the fish culture ability of personnel. Therefore, it was not surprising that
38% of the respondents chose not to answer this particular question.
Use of recirculating technologies to grow fish is not limited to "new"
facilities. The mean number of years of operation for the different farms
responding to the survey was 11. The most frequently reported age of a
facility was 6 years. However, it is important to note that the question on
the survey did not ask the length of time that the operation had been using
recirculation technology, but rather asked the number of years the facility
had been operating. This wording was purposeful; many facilities embrace
recirculation technologies in a step-wise fashion over a fairly long time.
Therefore, the data on years of operation is indicative of the longevity of
operation of the facility rather than the history of its use of recirculation
technology. It is interesting to note that both old and new operations are
using the technology and that age of the facility was not necessarily a
criterion or obstacle to employment of the technology. However, newer
facilities more frequently are using recirculation technology.
Characteristics of personnel of recirculation units
One purpose of the survey was to describe key characteristics of
personnel managing recirculation units in the United States and Canada.
A number of survey questions were directed towards characterizing
staffing and personnel attributes.
Seventy percent of recirculation operations had 1 to 8 full-time
employees. The most common situation in recirculation units is to have
one full-time employee, but there is a broad range of staff size for fulltime employees among the different facilities (Table 10). Most
operations had a low number of part-time staff (the modal number of
part-time staff employed at recirculation facilities in the United States
and Canada is 2). Sixty-six percent of operations had 1 to 5 part-time
staff (Table 10).
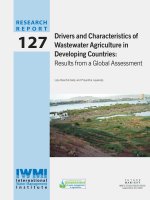
Overall, the majority of managers operating recirculation facilities in
the United States and Canada are middle-aged, highly educated and wellexperienced in aquaculture. Manager's ages ranged from 22 to 72 years
(Figure 4) . The average age for a manager was 43 years (mode = 45
International Journal of Recirculating Aquaculture, Volume 4
15
Rate of Survival
Life stage
More than
90%
90%
80%
70%
60%
Not known
40%
30%
20%
10%
1.2
1.2
-
-
-
24.7
From fertilized eggs
to eye-up
12.3
17.3 18.5
13.6
6.2
4.9
From eyed-egg
to hatch
23.0
23.0
14.9
11.5
3.4
2.3
1.1
-
-
-
-
20.7
From hatch
to first feeding
23.1
22.0
11.0
9.9
5.5
3.3
5.5
2.2
-
-
-
17.6
From first feeding
to fry
24.1
20.7 17.2
8.0
5.7
4.6
1.1
1.1
2.3
1.1
-
13.8
From fry
to fingerling
35.8
15.8
11.6
8.4
4.2
5.3
2.1
2.1
1.1
2.1
-
11.6
From fingerling to
yearling (smelt)
40.4
23.1
15.4
6.7
1.0
1.9
1.0
2.9
-
-
1.0
6.7
From yearling
to market
43.8
24.7
9.0
5.6
-
-
-
3.4
-
1.1
9.0
From market
to broodfish
39.1
18.8 10.1
2.9
-
-
2.9
2.9
21.7
1.4
Table 9: Average rates ofsurvival reported/or life stages held in recirculation facilities in the United States and Canada.
-
Less than
10%
50%
Indicates no response in this category.
Number
of Staff
Full-time
Percent
Count
Part-time
Count
Percent
8
6
18
15
1-5
74
59
80
66
6 -10
25
20
15
12
11 -15
10
8
4
3
16 - 20
5
4
3
2
> 21
4
3
2
2
126
100
122
100
0
Totals
Table JO: Number of employees in recirculation facilities in the United States and Canada.
years). Greater than 74% of the respondents had an undergraduate degree
or higher level of education (Table 11). Personnel managing recirculation
units have a considerable amount of practical experience in aquaculture
as well as a high level of formal education. The managers who responded
to this survey had on average 15 years of experience working in
aquaculture, with the majority of managers having between 15 to 25
years of work experience.
Count
Percent
Cumulative
Percent
Less than high school
2
1.5
1.5
High school diploma
8
6.2
7.7
Some college
9
6.9
14.6
Community College graduate
15
11.5
26.2
Bachelor's Degree
34
26.2
52.3
62
47.7
100.0
130
100.0
Level of Education
Graduate Degree
Total
Table I I: Level of education ofpersonnel operating recirculation facilities in the United States
and Canada.
International Journal of Recirculating Aquaculture, Volume 4
17
0.0 - 5.0
5.0 - 10.0
10.0 - 15.0
15.0 - 20.0
c
0
20.0 - 25.0
25.0 - 30.0
~
..... 30.0 - 35.0
Q)
a. 35.0 - 40.0
0
0
40.0 - 45.0
en 45.0 - 50.0
.....
Cl3
~
50.0 - 55.0
55.0 - 60.0
i---------------~
Std.Dev.= 12.25
60.0 - 65.0 .-...-------------~Mean= 11.2
65.0 - 70.0 .___ _ _ _ _ _ _ _ _ _ _ _ __.N = 122
20
10
0
30
40
Number of Facilities
Figure 3: Age offacilities using recirculation technology to produce finjlsh in the United States
and Canada.
17.5 - 22.5
22.5 - 27.5
27.5 - 32.5
32.5 - 37.5
en 37.5 - 42.5
.....
Cl3
42.5 - 47.5
~ 47.5 - 52.5
52.5 - 57.5
Std.Dev.= 9.22
57.7 - 62.5
62.5 - 67.5
67.5 - 72.5
------------------!
0
10
20
30
40
Mean= 42.6
N = 129
50
Frequency
Figure 4: Age ofpersonnel operating recirculation facilities in the United States and Canada.
18
International Journal of Recirculating Aquaculture, Volume 4
0.0 - 5.0
5.0 - 10.0
10.0 - 15.0
15.0 - 20.0
C/'J 20.0- 25.0
.....
(tj
25.0 - 30.0
~
Std.Dev. = 8.60
30.0 - 35.0
Mean= 15.1
35.0 - 40.0
N = 129
40.0 - 45.0
0
10
20
30
Frequency
Figure 5: Years of work experience in aquaculture ofpersonnel managing recirculation
facilities in the United States and Canada.
DISCUSSION
Recirculating aquaculture systems have been under development in the
United States and Canada for the past 30 years. As recently as 10 years
ago, however, Masser et al. (1992) commented that "recirculating systems
still have not proven to be an economical method of food fish culture".
Data from this survey however, indicate that significant shifts have
occurred in this sector of aquaculture during the past decade. Business
enterprises, specifically facilities growing fish for the food fish market, are
today the predominant users of recirculating technologies in the United
States and Canada. Masser et al. (1992) also mentioned that "to date, most
commercial systems have failed". Here, also, much has changed. Although
business failure is common in aquaculture, the survey results show that the
sector has expanded and diversified in size and purpose, and that many
commercial operations have withstood the test of time. Our survey
provides quantitative and qualitative information on many aspects of
recirculation aquaculture including size of production, water sources used,
and qualifications of personnel working in recirculation facilities. This
background information is important for understanding the current status
of this still-developing sector. Efforts continue in many areas around the
United States and Canada to develop recirculating technologies as a means
to grow fish efficiently. These technologies are expected to increase in
International Journal of Recirculating Aquaculture, Volume 4
19
importance in future aquaculture production, driven largely by the
increasing shortage of large quantities of suitable water needed for more
traditional methods of finfish culture. Therefore, it seems appropriate that
the current status of recirculating technology in United States and Canada
be considered to provide a context for how best to develop this sector
through the future. A thorough understanding of the constituents in a
sector is a key requirement for successful oversight. Previous to this
study, however, no information was available on the characteristics of the
recirculation sector of aquaculture in the United States and Canada. For
government agencies and policymakers to promote growth and to respond
effectively to issues related to the recirculation sector of aquaculture, they
must have an accurate account of the status of the sector. Likewise, up to
this point, researchers have had little empirical information on the
biological, physical and managerial characteristics of the recirculation
sector of aquaculture, and were to that degree limited in providing
research efforts that are applicable to the current situation. Armed with
information collected in this study, educators and extension specialists
should be better able to assist personnel within the recirculation sector
with learning instruments and informational resources that are relevant to
the sector's needs.
Our data show that the recirculating sector is diverse, both in terms of
sizes of farms using recirculating technology and the types and life
stages of fish grown. The current mix of small, medium and large farm
enterprises suggests that this sector is quite early in its development. In
most agri-businesses, because of the commercial realities of economy of
scale, an industry eventually evolves to having few participants growing
very large volumes of product. In the present group of respondents,
there were five very large farms - possible indication that this sector is
already evolving toward large volume production units. Government
agencies, educators and extension specialists must plan their
programming to account for the fact that annual production of only one
of these large farms exceeds the total annual production of all of the
farms grouped in the small-farm category (n=69).
One key finding of this study is that the recirculation sector of
aquaculture is reliant on groundwater sources for its operation. Because
of this, participants in this sector are vulnerable to changes in
groundwater availability due either to changes in hydrological conditions
or changes in policy or regulation regarding groundwater access and
20
International Journal of Recirculating Aquaculture, Volume 4
consumption. Any restriction that is applied to groundwater use for
aquaculture will impact this sector more severely than other finfish
growing sectors. In addition, the findings suggest that research in support
of recirculation technologies would fruitfully be directed towards solving
key problems associated with the use of groundwater for fish culture.
These problems include hazards associated with lethal gas levels, certain
fish disease conditions which are more pronounced with the use of
groundwater (i.e. nephrocalcinosis) and operational difficulties
associated with some types of groundwater (Muir 1994). Our results
also show that fully 40% of operations have no secondary water supply.
Extension agents might discuss the importance of backup water supplies
and explore technical alternatives with clients in their region.
The results of this study may have uncovered a key reason why some
recirculation operations that are viable on paper do not succeed in reality.
Theoretically, one of the major advantages of recirculation over flowthrough culture of finfish is the reduced amount of water required to
grow an equal volume of fish. The "cost" of accessing water in
recirculation systems is supposedly lower. However, the "cost" of using a
water source is a variable factor in the economics of these operations,
and our survey indicates that within the recirculation sector, a broad
range of water sources are used to grow fish. Pre-treatment water "costs"
prior to applying the water to fish or eggs can include costs associated
with dechlorination, purchase and installation of equipment to reduce
incoming pathogen load, and construction of mixing chambers to adjust
water chemistry. Likewise, the necessary post-treatment of a facility's
effluent is often influenced by the source of its incoming water. Many
economic models of recirculation technologies fail to account for the
variety of incoming water sources used and the differences in costs
associated with this choice of water source.
The recirculation sector has changed over time with respect to fish
species grown. Only a few fish species are currently grown in large
quantities using recirculation technology. The diversity of species that
farmers have attempted to raise indicates that aquaculture enterprises are
seeking and continue to experiment with alternative applications of the
technology. At the same time, use of recirculation technology is an
initially expensive fish culture endeavor, and therefore it must be
acknowledged that market forces, not biological success, may drive the
application of recirculating technology to new species.
International Journal of Recirculating Aquaculture, Volume 4
21
Management personnel in the recirculating sector of aquaculture are
highly educated. Because management capability is usually a
combination of formal education and experience, it is quite promising for
the development of this sector that the personnel managing these units
have on average 10 years of related work experience. Although this
sector is considered one of the newcomers to aquaculture production, it
has a fairly solid human resource base with respect to skilled
management personnel. Indeed, there is no other sector of agricultural
enterprise with such a high frequency of higher levels of education at the
management level. Government regulators, policy makers and extension
agents should be aware of this level of education in order to interact
effectively with this group. Vehicles of communication (e.g., workshops,
extension bulletins) should provide information at a sophisticated level
in order to be viewed as relevant and useful by this group of
aquaculturists.
ACKNOWLEDGMENTS
This research was funded by the Department of Fisheries and Wildlife
Sciences, College of Natural Resources, Virginia Polytechnic Institute
and State University, Blacksburg, Virginia, USA.
REFERENCES
Dillman, D. A. 1978. Mail and Telephone Surveys: The Total Design
Method. John Wiley & Sons, Inc. New York, NY, USA.
FAO Fisheries Department. Review of the State of World Aquaculture.
FAO Fisheries Circular 1997. No. 886 FIRl/C886 (Rev.1). FAO,
Rome, Italy.
Losordo, T. M. Recirculating Aquaculture Production Systems: The
Status and Future. Aquaculture Magazine 1998, 24[1], 38-45.
Losordo, T. M., Westerman, R. An Analysis of Biological, Economic,
and Engineering Factors Affecting the Cost of Fish Production in
Recirculating Aquaculture Systems. Journal ofthe World Aquaculture
Society 1994, 25,103-203.
22 International Journal of Recirculating Aquaculture, Volume 4
Masser, M. P., Rakocy, J., Losordo, T. M. Recirculating Aquaculture
Tank Production Systems: Management of Recirculating Systems.
SRAC Publication 1992, No. 452, 1-12. Southern Regional Aquaculture Center, Mississippi State University, Starkville, MS, USA.
Michael, Don. West Virginia Department of Education, 1900 Kanawha
Blvd, Charleston, WV, 25305, USA.
Muir, J. F. Water Reuse Systems in Aquaculture. INFO FISH International 1994, 6, 40-46.
Office of the Commissioner for Aquaculture Development (OCAD).
Canadian Aquaculture Industry Profile 2001. OCAD, Ottawa, Ontario,
Canada.
Rosenthal, H. Environmental Issues and the Interaction of Aquaculture
with Other Competing Resources Users. In Coldwater Aquaculture to
the Year 2000. Proceedings of the Huntsman Marine Science Centre
Symposium, St. Andrews, Canada, September 6-8 1995; Burt, M. D.
B., Waddy, S.L. (Eds.) 1997. Aquaculture Association Canada Special
Publication 2, St. Andrews, NB, Canada.
United States Department of Agriculture. 1997 Census of Aquaculture
(1998). Special Studies Part 3, AC97-SP-3, Washington, D.C., USA.
International Journal of Recirculating Aquaculture, Volume 4
2~