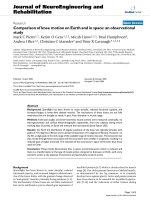
Comparison of atlantic salmon net pen and recirculating aquaculture systems economical, technological and environmental issues
Bạn đang xem bản rút gọn của tài liệu. Xem và tải ngay bản đầy đủ của tài liệu tại đây (1.17 MB, 63 trang )
Faculty of Biosciences, Fisheries and Economics
Comparison
of Atlantic salmon net pen and
recirculating aquaculture systems: economical,
technological and environmental issues
—
Vitaly Dekhtyarev
Master thesis in International fisheries management
November 2014
Picture credit: akvagroup.com
Acknowledgement
I would like to express my sincere gratitude to the supervisors Øystein Hermansen
(Nofima AS) for inspiring cooperation, encouragement and comprehensive explanation of the
practical issues related to aquaculture industry, and Arne Eide (UiT) for patience, very useful
comments on theoretical parts of the research and the responsiveness even during his sabbatical.
They have helped me to develop a critical way of thinking and objective cognition of scientific
information.
A special thankfulness from me to Jens Revold, Ane-Marie Hektoen, lecturers
participating in the International fisheries management program and administration of the
University of Tromsø for such a great opportunity to improve not solely professional knowledge,
but also intercultural communication skills.
My dear wife Alyona has my warmest undying gratitude for being with me all this hard
time during master thesis preparation and for her whole-hearted support.
ii
Abstract
The modern aquaculture industry is a rapidly developing sector of the fisheries industry.
Among the fish species reared in marine waters Atlantic salmon (Salmo salar) shares a
significant part. Nowadays, the largest salmon producing countries are Norway, Chile and
Scotland. The common technology used in the salmon production is a sea cage, which is
presented in a form of floating plastic rings or robust metal installations fastened to a barge. In
both cases, the fish is placed in the net in the open sea, and therefore, production is highly
dependent on the external factors, such as environmental conditions, disease and parasites
presence.
Recirculating aquaculture systems (RAS) have been used to supply smolts for further
production of market-size salmon at sea. Nowadays, this system is suggested to provide the
whole production cycle from smolt- to market-size in the closed environment with optimal
biological conditions. Nonetheless, the existing projects require higher initial investment costs
than the conventional net pen farm.
In the present work, comparison analysis of net pen system and RAS has been performed
on the basis of the economic analysis of salmon aquaculture farm suggested by Trond Bjørndal
and Frank Asche in “The Economics of Salmon Aquaculture”, 2nd edition (2011) and report
“Profitability analysis of the NIRI technology for land-based salmon farming” (2008) by Krisin
Roll, Arve Gravdal and Asbjørn Bergheim. The analysis includes compilation of biological and
bio-economical models for the both systems. Missing or out-of-date information has been
replaced by new data from additional sources such as research articles, industrial reports and
expert opinions. The net present value (
) and internal rate of return (
) are the main
measures that have been used in analysis.
The overall conclusion from the comparison has shown that RAS is around 12 mil NOK
less profitable than net pen farm in ten years time horizon, while
in both cases is positive.
However, other findings from the research revealed an unreliability of the scaling method in
respect to RAS, without detailed description of the farm production capacity and equipment.
Besides, investment costs estimation is dependent on many factors that are complex and require
a thorough investigation.
At the same time, in spite of scientific and industrial analyses show lower impact on the
environment from RAS in comparison to the net pen aquaculture system, it may be questioned in
terms of RAS location and power source use.
iv
v
Table of content
Acknowledgement .......................................................................................................................... ii
Abstract...........................................................................................................................................iv
Table of content ..............................................................................................................................vi
1. Introduction ................................................................................................................................. 1
1.1. Aquaculture industry overview ............................................................................................1
1.2. Objectives ............................................................................................................................. 4
1.3. Constraints ............................................................................................................................ 4
1.4. Hypotheses ........................................................................................................................... 4
2. Aquaculture systems .................................................................................................................... 5
2.1. Issues related to net pen aquaculture technology ................................................................. 5
2.2. Advantages of RAS ............................................................................................................ 11
2.3. Niri AS system design ........................................................................................................ 14
2.4. Sea farm design .................................................................................................................. 16
3. Methods and parameters estimation .......................................................................................... 17
3.1. Biological model ................................................................................................................ 17
3.1.1. Growth ......................................................................................................................... 17
3.1.2. Feed conversion ratio .................................................................................................. 19
3.1.3. Mortality ...................................................................................................................... 20
3.2. Economic model ................................................................................................................. 20
3.2.1. Revenue ....................................................................................................................... 20
3.2.2. Price ............................................................................................................................. 21
3.2.3. Costs ............................................................................................................................ 22
3.2.3.1. Fixed costs ........................................................................................................... 22
3.2.3.2. Variable costs ......................................................................................................23
3.2.4. Optimal harvest time ...................................................................................................24
3.2.5. Net present value ......................................................................................................... 25
3.2.6. Internal rate of return ................................................................................................... 25
3.2.7. Project duration ........................................................................................................... 26
3.2.8. Investments .................................................................................................................. 26
4. Results ....................................................................................................................................... 29
4.1. Biological development ...................................................................................................... 29
4.2. Price and value ................................................................................................................... 30
4.3. Optimal harvest time .......................................................................................................... 32
4.4. Production plan ................................................................................................................... 33
4.5. Net present value and IRR .................................................................................................. 36
4.6. Average cost comparison ................................................................................................... 38
5. Discussion.................................................................................................................................. 41
6. Conclusion ................................................................................................................................. 51
References ..................................................................................................................................... 53
vi
1. Introduction
1.1. Aquaculture industry overview
Fish farming is a fast growing industry that has developed significantly over the last
decades and is expected to continue to increase in the coming years (FAO, 2014). As a part of
fish production aquaculture has shown a very rapid increase in production and doubled the
quantity over the last decade from 32.4 million tonnes in 2000 to 66.6 million tonnes in 2012.
That was around 40% of the total global fish production, which in 2012 was 158 million tonnes
(Figure 1) (FAO, 2014).
Figure 1. Total World fish production 1950-2012, million tons (FAO, 2014).
At the end of 2012, the most common farmed species are finfishes that form 57.9% (38.5
million tonnes) of the total aquaculture production, then follow molluscs – 22.8% (15.2 million
tonnes), crustaceans – 9.7% (6.4 million tonnes), marine finfishes – 8.33% (5.5 million tonnes)
and other aquatic animals which total share is 1.3% (FAO, 2014).
Atlantic salmon takes a significant place among the farmed diadromous fishes (Figure 2)
and together with other salmonids it forms more than a half of the total diadromous fishes
production since 1990s. However, maximum share of salmonids in the total production has been
registered in 2001 (70.4%) and started declining afterwards (FAO, 2012).
1
Figure 2. Production volume distribution among farmed diadromous fishes (FAO, 2012).
Technologies and systems for farming fish have evolved over time. Established as a
changing of fish natural habitats, then activity turned into installation of ponds along coastline
and in lakes. Farming in made of earth ponds implies use of impervious materials and barriers as
a measure limiting inner and outer water exchange, fish movement and excluding escapes. This
system has been used for centuries in Asia and Europe. Individual households often use this
technique because of its constructing simplicity for; as it only requires digging a pool and
carrying out the production process. The young fish in such facility are bought from breeders or
occur naturally. Feeding may be performed by using households by-products (Subasinghe and
Currie, 2005a).
From the knowledge assembled by fishermen and seafarers, engineers in aquaculture has
developed techniques allowing to benefit from allocation of fish sea cages in offshore areas
(Subasinghe and Currie, 2005b). The most common technique today is a sea pen that was
developed in the 1980s. Since then, industrial production has increased, and instead of using a
single pens, up to 14 pens are in operation. They are produced in form of steel cages, that can
better sustain predator attacks, and plastic cages. The latter are relatively not costly and therefore
more common. The size of modern plastic pen has increased significantly in diameter and depth
comparing to first farms, from 5 m and 4 m to 50 m and 40 m, respectively. The cages are
fastened to a barge where equipment and personnel is placed. The barges are movable with pens,
besides it allows in some systems to submerge the pens in order to protect from stormy weather.
The fish rearing process starts when the water temperature is suitable, usually from March to
October in Norway and from September to March in Chile. As the water temperature is a
2
significant factor for fish growth, biological development of the same species differs because of
site-related factors (Asche and Bjørndal, 2011).
Environment and existing aquaculture industry are highly interacted, what makes the
latter very vulnerable to any changes in water chemistry, temperature condition and biological
organisms spreading, such as diseases and parasites. The sites are located in areas where the
marine currents and tidal waters provide the required aeration and water exchange for optimal
production (Paisley et al., 2010).
Among the most significant factors negatively influencing salmonids marine farms are
vibrosis, furunculosis, Infectious Pancreatic Necrosis (IPN), Heart and Skeletal Muscle
Inflammation (HSMI), Infectious Salmon Anaemia (ISA) and Sea lice (Asche et al., 2009;
Marine Harvest, 2012).
In addition to diseases, the existing coastal aquaculture facilities may suffer from natural
predators, such as seals and birds, and weather conditions, for example, storms or floods may
damage floating cages with fish of other parts of the farm (FAO, 2012; Marine Harvest, 2014).
Beside these natural factors, the changes of legal regulations and restrictions toward protection
of wild stocks and habitats may substantially reduce the number of available sites for fish
farming and increase costs of environmental impacts (Paisley et al., 2010).
However, technological innovation has allowed development of a new type of
aquaculture system where the farming process can be carried out in an isolated environment
(Subasinghe and Currie, 2005b). Rearing fish in man-controlled and regulated condition has
become a basis for the hatcheries industry, as we know it today. In such systems, the fish may
also be reared for food or ornamental purposes, due to improved knowledge on water chemistry
and bacteria, the water may be recirculated and used over again and nutrients utilised effectively
(Subasinghe and Currie, 2005a).
According to the elements stated above, it may become more challenging to use
traditional net pen system to farm food fish in Nordic countries. In this light, alternative
technologies may have advantages conforming to both changing law and environment. In terms
of increasing demand for fish products and lack of available sites to raise production level, landbased recirculating aquaculture system (RAS) with closed environment could be a feasible
substitution to existing farms. This complex system allows to rear fish in isolated from the
surrounding environment water tanks, installation of modern technological equipment and
sensors makes it possible to keep water condition in RAS suitable for any kind of species the
whole year round. In addition, according to designers of the system, RAS shortens a grow-out
period and excludes the necessity for farmers to wait for a proper season for fish release after
harvesting the previous batch. Nevertheless, equipment, construction works and qualified
3
employees are capital-intensive what makes it questionable that the system may compete to the
developed conventional net pen system.
1.2. Objectives
This study is aiming to analyse profitability of existing Norwegian aquaculture
companies and compare this with corresponding on-land facility in form of RAS in Nordic
countries, e.g. Norway. Investigate which alternative is more preferable to an investor, net pen or
land-based facility, taking into account only grow-out phase and not processing, and therefore to
estimate how existing economic conditions may influence the development of the new
technology.
The research questions could be expressed in this way:
1. What is the additional investment and operational costs of RAS compared with today`s
aquaculture?
2. Can expected advantages of RAS, e.g. shorter fish growth period, and disadvantages, e.g. high
start investment level, make it competitive to the existing net pen system?
For achieving the aim of the thesis, the following methods have been implemented:
Analysis of existing RAS technologies provided by private companies;
Production cycle modelling for net pen and RAS for production of Atlantic salmon;
Comparison of the key economic parameters of the systems, such as operational costs, net
present value (NPV), internal rate of return (IRR);
Assessment of environmental impact magnitude from RAS and net-pen technology;
1.3. Constraints
Due to a limited number of RAS in operation and their technological differences it is
problematic to make a universal economic analysis for such facilities. Therefore, it is considered
to estimate feasibility of a farming system suggested by Niri AS and presented in the report
“Profitability analysis of land-based salmon farming” (Roll et al., 2008), in terms of today`s fish
and materials prices.
1.4. Hypotheses
1. Recirculating aquaculture system has higher cost per production than the conventional net pen
system;
2. Recirculating aquaculture system is less profitable than the conventional net pen system.
4
2. Aquaculture systems
2.1. Issues related to net pen aquaculture technology
Considering the issues met by modern net pen aquaculture, spread of diseases and
parasites is heavily influencing the industry. While there is development of medical treatment in
form of vaccination and antibiotics use, this issue occurs worldwide and is difficult to forecast.
Despite active implementation of measures to control disease in 2003 and 2007, Chile
experienced an outbreak in 2007 caused by ISA virus which led to a substantial production
decrease (Asche et al., 2009). As the production cycle for Atlantic salmon takes from 1.5 to 2.5
years, the consequences of the event appeared later as a dramatic fall of production level from
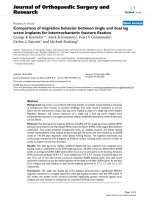
the peak volume of 388 048 tonnes in 2008 to 122 000 tonnes in 2010 (Figure 3) (Asche et al.
2009; FAO 2014).
400000
388048
385086
386607
375991
348665
Production, tonnes
350000
330391
300000
279906
265205
254570
253607
250000
230678
200000
166897
150000
120000
96675
100000
107066 103242
77327
54250
50000
9478
14957
23715
29180 34175
2012
2011
2010
2009
2008
2007
2006
2005
2004
2003
2002
2001
2000
1999
1998
1997
1996
1995
1994
1993
1992
1991
1990
0
Years
Figure 3. Atlantic salmon production in marine waters in Chile (FAO 2014).
Outbreaks were also registered during 2008, and government eventually introduced
measures to stop the spread of ISAV. But the industry revealed that the measures were not
effective to cope with the problem (Asche et al., 2009).
In Norway over the period from 1984 to 2005, 437 outbreaks have been registered.
Thanks to the regulations implemented by the Norwegian veterinary authority in the end of
1980s the last peak of 80 occurrences was registered in 1990 (Lyngstad et al., 2008). However,
investigation of 32 outbreaks registered between 2003 and 2005 showed that there is high risk of
ISAV transmittance with water currents between adjusted marine aquaculture sites. Besides, all
5
farms located along the coast of Norway use well-boats for various operations including
transportation of smolts from breeding facilities. Therefore, by passing farming areas the boats
are also considered as a significant factor for disease spread. While there are no reports
interrelated with the boats in Norway, outbreaks in Scotland are strongly correlated with number
of well-boats visits (Lyngstad et al., 2008).
Another occurrence of such kind happened in the Faroe Island in 2003 that caused a sharp
fall in production level almost four times from 47 000 tonnes in 2004 to 12 000 tonnes in 2006
(Asche et al., 2009).
From the beginning of 2000 pancreas disease (PD) has become a substantial threat to
aquaculture industry in Norway. PD is an atypical alphavirus, has been first reported in 1976 in
Scotland (Taksdal et al., 2007), while the first report on the disease in Norway is registered in
1989 (Aunsmo et al., 2010), the significant outbreak on Atlantic salmon and rainbow trout sea
farms took place in 1995 (Taksdal et al., 2007).
Relatively low number of outbreaks in period from 1998 to 2002 (Kristoffersen et al.,
2009) turned into a rapid increase starting from 2003. Most of the affected sites located in the
western part of Norway, but further, the disease has spread towards northern regions (Figure 4)
comprising total quantity of 98 outbreaks in 2007 (Aunsmo et al., 2010).
Figure 4. Pancreas disease spread in Norway from 2004 to 2007 (Kristoffersen et al., 2009)
The quantitative analysis of the disease development is presented in Figure 5.
6
Number of outbreaks
Figure 5. Quantitative growth of pancreas disease outbreaks (Hoel et al., 2007).
In the same year PD has been input in B list disease by the Norwegian Food Safety
Authority (NFSA), because of significant negative influence on the industry (Kristoffersen et al.,
2009).
The outbreaks may last in the range from 3 to 4 months (Taksdal et al., 2007), and the
mortality level varies significantly. In Ireland the rate has been shown in between 0.1-63%
(Kristoffersen et al., 2009), in the period from 1988 to 1992 on eleven seawater salmon farms
total mortality was 50%, from 1990 to 1994 annual level was approximately 12.1% and form
2003 to 2004 – 9-15% (Aunsmo et al., 2010). In Norway the level varies from 3% to 20%, in the
period from 1999 to 2002, 80% of infected sites experienced 5% and in 33% – 15% of PDrelated mortality, with the highest level at 80% during transferring of smolts (Aunsmo et al.,
2010; Taksdal et al., 2007). It is also suggested that smolts released in autumn are more exposed
to PD infection than any other, because of seasonal changes of the environmental condition
(Kristoffersen et al., 2009).
The virus is considered to spread passively in marine currents, with no necessity of an
agent as human or animal, and hence, the farms located close to each other are at high risk,
especially if neighbouring farms have experienced an outbreak. However, the farms that share a
concession may obtain the virus through common facilities and personnel (Kristoffersen et al.,
2009).
The fish that suffered from PD but survived, however loses its value as white muscle, the
most valuable part of fillet, degenerates and has poor pigmentation, what in result affects the
7
quality, particularly if the fillet is smoked (Taksdal et al., 2007). Moreover, production may be
affected in a way to necessary shift from premium to ordinary class salmon, what has been
estimated to reduce the price by about 2.2 NOK per kg (Aunsmo et al., 2010).
In terms of PD-related costs, decrease of production level does not lead to reduction of
labour involved in the process, in opposite there is a necessity for extra force. In case the farm
try to compensate the fish losses by prolongation of grow-out phase, this, however, causes
increase in labour costs as well. Besides, the remaining biomass will affect the total biomass
quota of the company and reduce potential production of other sites. Furthermore, this ability is
limited by environmental and physical constraints in addition to legal (Aunsmo et al., 2010).
Total amount of direct costs a company may suffer from pancreas disease outbreak, if
rear 500 000 smolts at one site, has been estimated at 15.6 mil NOK, in case of implementation
of compensatory measures this amount would decrease by 1.2 mil NOK. However, while the
disease may significantly influence market through fish quality and price and cause an economic
growth slowdown, until present time the effect on the country’s economy is limited. Besides, big
companies are flexible to move their stocks from infected sites. Consequently, local small
companies are mostly exposed to the losses from PD. Together with economic expenditures it
causes reduction in employment what is crucial for costal societies (Aunsmo et al., 2010)
Independently of companies’ flexibility, number of infected sites is increasing. For the
period from 2012 to 2014, total amount of confirmed outbreaks is 120.
Figure 6. PD infected sites from 2012 to 2014. Red triangles – confirmed incidents, yellow – not
confirmed (kart.fiskeridir.no).
8
Besides, the spread of PD has changed from year 2007 significantly (Figure 6), and now
it covers partly middle Norway as well.
Together with disease, salmon lice Lepeophtheirus salmonis is still a threat to the
industry. In Canada losses were estimated to 20 million CAD in 1995, in Norway – 500 million
NOK in 1997 and from 15 to 30 million pounds in Scotland in 1998 (Heuch et al., 2005).
Investigation on sea lice population and distribution showed that this parasite’s larvae are mostly
concentrated in the waters where salmon farming is actively performed. It has also been
estimated that infected farmed salmon carries much more lice eggs, about 15 billion, when the
wild one just 2.6 billion (Heuch et al., 2005). Thus, rearing of salmon in marine environment in
open net pens can cause negative effects not on the farmed fish and farmers prosperity solely, but
on wild nature as well. The parasite cannot survive on sea trout and Arctic charr when they
migrate from salted ocean water to rivers. However, sea lice larvae infect fish when one passing
areas with high farms concentration. In addition, escaped fish may transmit the parasite to longer
distances than currents. Despite rapid decrease of escapees level (Figure 7) there is a
presumption, based on previous estimations, that the real figures are much higher (Heuch et al.,
2005).
1 000
900
y = -27,868x + 573,73
R² = 0,239
Individuals, 1000
800
700
600
500
400
300
200
100
0
2001
2002
2003
2004
2005
2006
2007
2008
2009
2010
2011
2012
2013
2014
Years
Figure 7. Escapes of Atlantic salmon in Norway (information for 2014 is estimated on 30.09)
(Fiskeridirektoratet, 2014)
9
Heuch et al. (2005) suggested that in 2001 there were 3 times more escapees then it was
reported, considering continues catches of farmed salmon within period when there were no
reports on escapes.
Aquaculture of other species has suffered from disease and environmental disasters
around the world as well. Among them are oyster farming in Europe, shrimp farming in Asia,
South America and Africa (Mozambique in 2011). China met a dramatic loss of production of
1.7 million tonnes in 2010 because of natural and anthropogenic reasons (FAO, 2012).
Since the last decades of the XX century the World has met a new phenomenon that is
called Global climate change. Because it influences all spheres of human activity and life as a
whole, aquaculture industry must take the total uncertainty of this process into account. Climate
change implies changes in weather patterns that may lead to drought and floods lasting for longer
periods in different parts of the planet. Another effect is highly increased number of reported
disasters (Figure 8) (FAO, 2012).
Figure 8. Natural disasters reported worldwide (FAO, 2012).
The condition for rearing fish may become extreme in some coastal regions due to floods
and droughts, what, together with other climatic processes, may cause change of natural
conditions for farming, such as water temperature and salinity. This may make it impossible to
rear species in areas close to the shores (FAO, 2012).
Considering the interaction between environment and aquaculture industry, human health
and introduction of genetically modified organisms in fish-food industry, the new regulations
and measures appear in Nordic countries that have a strong influence on the industry within these
countries.
10
In Norway, 37 National Watercourses and 21 National Salmon Fjords are closed for
farming salmonids to protect wild stocks from disease and salmon lice spread. In addition, to
obtain a green label for own products, producers have to follow particular rules. In 2010, there
were two sites for salmon farming meeting this requirement (Paisley et al., 2010).
Since 2004, there is a new requirement to green labelling in Denmark, it is not allowed to
use genetically modified feed and fish, the latter cannot be biologically treated as well, it is also
forbidden to add colouring matters to feed. These and other environmental regulations together
with low number of available sites limit net-pen aquaculture development. However, this does
not have an influence on small amount of recirculating farms (Paisley et al., 2010).
In Finland, where fish farms produce about 12 500 tonnes of food fish annually,
according to the Law 157/2005 it is restricted to use wild fish caught from brackish or marine
waters for feed for farmed fish. The production is regulated in terms of use of fish feed per year,
and if a producer use more than 2 tonnes he has to apply for a permit. Besides, the farmers have
to fund programs evaluating influence of farming on local environment (Paisley et al., 2010).
Icelandic Environmental Impact Assessment Act requires an assessment of every
establishing fish farm if it’s production exceeds 200 tons annually and waste waters empties in
ocean, or if production exceeds 20 tons per year and waste waters empties in fresh water. While
not many farms are interested in eco-labelling of own fish, land-based farms that rear most of
smolts and slaughter fish use “pathogen free” ground waters and filtered seawater, together with
geothermal energy to warm-up the water (Paisley et al., 2010).
Fish farming in Sweden follows the national and EU regulations that are demanding in
terms of environmental affairs. Therefore, it is unlikely that number of farms will increase next
years. In 2001 KRAV scheme is established in Sweden to label fish produced in an
environmental friendly way. However, there is no high interest from the producers, so the total
number of companies and productions accredited KRAV were three and six respectively, but
now there are no companies approved in accordance with the scheme aquaculture sites (Paisley
et al., 2010).
2.2. Advantages of RAS
Recirculating Aquaculture Systems (RAS) is an aquaculture system with integrated water
treatment equipment, as a sequence of biological and mechanical filters, what allows to reuse 9999% of the incoming water, with only 1-3% water consumption (Roll et al., 2008). RAS have been
developed over the past three decades by Cornell university in New York and commercial
research groups (Timmons and Ebeling, 2010). Among the latter are the Fresh water institute of
11
The Conservation Fund in Canada, Niri AS in Norway and others located in the USA, Canada,
Denmark etc.
Due to water control, salmon reared in the indoor RAS are more protected from air and
water-borne disease and contaminants comparing to open-air sea cages and ponds, where
incoming water flow cannot be regulated at all, hence, as a direct contact with pathogens is
inevitable, fish may be lost. Opposite to this, high degree of waste streams control makes it
environmentally sustainable and excludes risks of spreading diseases or parasites in case of
occasional introduction in RAS, besides they may be easily managed and effectively eliminated
(Timmons and Ebeling, 2010).
The system considered in this thesis system has also a substantial advantage compared to
the conventional system because of growth control by water condition adjustment, that avoid
peaks and valleys of product supply to the market (Timmons and Ebeling, 2010).
One of the main factors influencing growth is temperature. Biological limit for Atlantic
salmon is between 0°C and 23°C. While these borders may vary in different wild stocks, the
optimal growth is achieved in the interval 12- l5°C. The reason is that oxygen saturation
decreases from 14 mg/l at 6°C to 9 mg/l at 16°C in fresh water, therefore, as the fish can
consume barely from one-third to half of saturated oxygen in the water, water supply at the upper
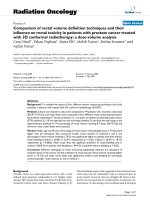
temperature level must be three times more intensive (Figure 9) (Stead and Laird, 2002).
Figure 9. Oxygen consumption of salmonid fish (per kg body weight) in relation to fish (body)
weight and water temperature (Stead and Laird, 2002)
12
Oxygen level is also significant for growth because of its impact on feed consumption. At
the higher temperatures with lower level of saturated oxygen, feed consumption increases as well
(Stead and Laird, 2002).
These two factors may be considered as a sufficient improvement of fish welfare that has
a positive effect on both fish itself and farmer’s competitiveness by reduction of the feed costs.
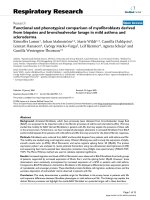
As one can see from Figure 10, an average seawater temperature in Norway is within the
suitable limit only for seven months a year, while the optimal level lasts for 3-4 months. In this
light, sufficient environmental condition for rearing Atlantic salmon is in Chile.
Figure 10. Average sea water temperature in the areas of active salmon production (Marine
Harvest, 2014).
Controllable environment allows the farmers to control fish growth and hence to predict
the harvest volume more certain. In addition, adjustable water condition by using of filters and
heaters gives an opportunity to increase production per m3 comparing to net pen systems
(Timmons and Ebeling, 2010).
Fish escapees are considered as a significant environment impact, which in the
conventional systems this may be caused by predator attacks, fails during net washing or
transportation. As RAS is located on the land and has no direct connections between tanks and
surrounding water bodies there is a remarkable advantage of elimination of fish escape.
Besides, due to the fish growth condition advantages in RAS, it has low environmental
impact in relation to net pen and pond systems, therefore it may be placed closer to the consumer
13
(Timmons and Ebeling, 2010) and make benefit from prompt delivery and preferences to local
and eco products, however for the Niri system a proper source of sea water is required. Also,
land-based systems are widely used for production of smolts for further release in sea cages
(Asche and Bjørndal, 2011).
2.3. Niri AS system design
The RAS considered in my work is designed by Niri AS. The company was founded in
2006 in Måløy, Norway, by engineers and marine biologists. The largest stakeholder of the
company is the founder and main developer Arve Gravdal. Niri AS is aiming to develop on-land
closed facilities for farming different types of fresh water and marine fish species, such as
Atlantic salmon (Salmo salar), tilapia (Oreochromis niloticus) and Atlantic cod (Gadus morhua),
allowing production at competitive price to conventional net pen systems used for fish farming at
sea. As an important benefits of the considered system is minimising a possibility of any disease
occurrence, and hence medication use, high water quality control and effective feed utilisation.
At present, the company owns experimental stations in Ireland and Poland.
The facilities are designed in various option for production levels from 3 000.00 to
10 000.00 tonnes of fish. Besides, it is possible to integrate processing and auxiliary productions
in the farm (Figure 11).
Figure 11. Niri AS land-based farm design (niri.com).
14
However, a conceptual facility considered in the thesis is described in “Profitability
analysis of land-based salmon farming”, 2008. This facility is established on-shore with
approximately production level 7,000 tonnes. According to the designers the system is specific
due to recirculating equipment is in the single tanks, and tanks are independent of each other,
what can allow blocking tanks in case of disease outbreak or easily expand the facility for
necessary production increase. Construction has total rearing volume of 20 210 m3, each tank is
20 m diameter, with total area at about 3 hectares (30 000 m2). Seawater is supplied from a well
at maximum 500 l/min tank flow rate. Average water temperature is to be kept at 14 °C all
Makeup water 1-3%
seasons. Schematically, the system is presented in Figure 12.
Waste water 1-3%
Figure 12. General RAS structure
The water is lifted to the system by a propeller pump for approximately 1 m height,
afterwards it moves through treatment equipment by the force of gravity (Roll et al., 2008).
Recirculating in the system starts with solid particles removal, the particles are mostly
uneaten or undigested feed. This procedure is crucial to efficient biofilter functioning, and
therefore influencing water quality in the whole system. Implementation of filters with mesh size
of 40-100 m allows to lower amount of solids in the flow by 40-80%. For removal of smaller
particles foam fractionation is used. In this process, air bubbles are produces in the bottom of
water column, particles are attached to the coming up bubbles and then at the top they form a
foam, that is channelled out afterwards (Roll et al., 2008).
15
CO2 is a waste product of bacteria and fish respiration, to control its amount in the water
is an important process to sustain high density of fish in the indoor RAS. Concentration of CO2
must not exceed 10-15 mg/l for the long-term, to maintain this level packed column aerators are
used. Carbon dioxide is removed by air gusted at the bottom of the column and shaking the water
that falls (Roll et al., 2008).
Another fish respiration product is ammonia gas that is excreted from gills and further,
forms ammonia nitrogen of two types: ionized NH4+ and highly toxic un-ionized NH3. Total
ammonia nitrogen (TAN) must be severely monitored and kept at the level below 10 g N/L. For
this purpose there was installed a biological filter, where bacteria Nitrosomonas and Nitrobacter
are grown on a specific surface substance. Further, the first transforms ammonia into nitrite
(NO2-) and then the Nitrobacter convert nitrite-nitrogen into nitrate , which is not harmful to
salmonids (Roll et al., 2008).
In the initial project, to estimate fish respiration products amount and therefore water
recycling rate the following models have been implemented in the design of the facility:
.
1.92
1) oxygen consumption –
.
.
10
where W – fish size, T – water temperature, C – current velocity;
3) ammonia excretion –
where
.
.
2.14
2) carbon dioxide excretion –
.
0.036
– daily ammonia excretion, and
.
10
.
;
0.26
is nitrogen intake by fish. However, the
water flow rate has not been re-estimated in the present work
Suitable pH level for salmonids is from 6 to 8, this parameter is crucial for metabolic
waste (CO2, NH3) treatment. Deviation from the stated borders makes the water toxic for the
specie (Roll et al., 2008).
To prevent pathogens occurrence in the system ultraviolet radiation (UV) has been used.
Correct dose of radiation inactivates microorganisms, however, the particles must be removed
from the water before the operation (Roll et al., 2008).
2.4. Sea farm design
As an example of conventional system is considered a farm located in the western part of
Norway in the climatic conditions similar to Bergen region, because about 70% of farms are
located in the waters with such environmental conditions (Asche and Bjørndal, 2011). The
company possesses three sites, free from pathogens, and available for operations. For fish rearing
two plants are used, for each of them it is required a barge and eight plastic sea cages, 120 m in
circumference and 40 m in depth.
16
3. Methods and parameters estimation
Net present value (NPV) has been used to evaluate the profitability of recirculating
aquaculture and net pen systems. NPV calculates the present value (PV) of net cash flow minus
initial investments of the project. To calculate net cash flow (CF) annual total costs incurred by
the production are subtracted from total revenue for selling fish, further, this value is discounted
by discount rate (r) to the initial date, what has PV as a result. Discount rate represents an
interest rate to evaluate value of the future CF, it shows an alternative value that could be earned
by investing money in other project.
Other parameter values that are resulted from authors’ observations or sophisticated
calculations and are intrinsic to a particular condition have not been recalculated (Asche and
Bjørndal, 2011; Roll et al., 2008).
3.1. Biological model
3.1.1. Growth
A yearclass of fish (recruits of the same age) are released into a grow-out facility and the
yearclass’ development is measured in terms of the three key features over time such as
number of fish,
biomass,
, average individual fish weight,
, measured in kilograms, and the total
. The latter is fish weight multiplied by the number of fish:
(1)
where is time, measured in years (Asche and Bjørndal, 2011).
The total biomass is an important parameter for aquaculture profitability analysis,
therefore, it is necessary to be able to predict and manage future harvest volumes.
Considering that weight development is mostly sigmoidal, and the growth rate of
individual fish changes with fish size, the estimation and description of fish weight changes with
time may be done using coefficients obtained from empirical data, instead of the exact biological
pattern (Jobling, 2002).
Taking into account the stated above, the individual fish growth development for the net
pen farm is based on the modelled data from Asche and Bjørndal (2011) presented in Table 1.
This weight development reflects seasonal changes in biology of salmon and therefore variation
in weight increment.
17