Evaluation on biofilter in recirculating integrated multi trophic aquaculture
Bạn đang xem bản rút gọn của tài liệu. Xem và tải ngay bản đầy đủ của tài liệu tại đây (751.36 KB, 5 trang )
Internat. J. of Sci. and Eng., Vol. 4(2)2013:80-85, April 2013, Sumoharjo and Asfie Maidie
International Journal of
Science and Engineering (IJSE)
Home page: />
Evaluation on Biofilter in Recirculating Integrated MultiTrophic Aquaculture
Sumoharjo# and Asfie Maidie#
Email:
#Aquaculture
Department of Fisheries and Marine Science Faculty, Mulawarman University
Kampus Gn. Kelua Jl.Kuaro Tlp.(0541)74111 Samarinda 75119 KALTIM
Abstract - Integrated multi-trophic aquaculture pays more attention as a bio-integrated food production system that serves as a model
of sustainable aquaculture, minimizes waste discharge, increases diversity and yields multiple products. The objectives of this research
were to analyze the efficiency of total ammonia nitrogen biofiltration and its effect on carrying capacity of fish rearing units. Pilot-scale
bioreactor was designed with eight run-raceways (two meters of each) that assembled in series. Race 1-3 were used to stock silky worm
(Tubifex sp) as detrivorous converter, then race 4-8 were used to plant three species of leaf-vegetable as photoautotrophic converters,
i.e; spinach (Ipomoea reptana), green mustard (Brassica juncea) and basil (Ocimum basilicum). The three plants were placed in
randomized block design based on water flow direction. Mass balance of nutrient analysis, was applied to figure out the efficiency of biofiltration and its effect on carrying capacity of rearing units. The result of the experiment showed that 86.5 % of total ammonia nitrogen
removal was achieved in 32 days of culturing period. This efficiency able to support the carrying capacity of the fish tank up to 25.95
kg/lpm with maximum density was 62.69 kg/m3 of fish biomass production.
Keywords — aquaculture; multi-tropihc; integrated; productio; sustainable
Submission: January 10, 2012
Corrected : March 13, 2013
Accepted: March 15, 2013
Doi: />[How to cite this article: Sumoharjo, S. and Maidie, A. (2013). Evaluation on Biofilter in Recirculating Integrated Multi-Trophic Aquaculture.
International Journal of Science and Engineering, 4(2),80-85. Doi: />
I. INTRODUCTION
FAO (2010) claims that aquaculture accounted for 46
percent of total food fish supply, a slightly lower
proportion than reported in The State of World Fisheries
and Aquaculture 2008. On the other hand, aquaculture is
required to grow in response to demand for increased
cheaper protein resources. However, in practices,
aquaculture faces major problems in feed nutrient
retention, where only 25-30% of feed nutrients converted
for energy and growth (Avnimelech, 1999; Rakocy, et al.,
2006; Losordo, et al,. 2007), the rest is excreted in water
column that would otherwise build up to toxic levels and
finally decreasing carrying capacity in the fish rearing
units. Actually, Fish can be grown at very high density in
aerated–mixed ponds. However, with the increased
biomass, water quality becomes the limiting factor, due to
the accumulation of toxic metabolites, the most notorious
of which are ammonia and nitrite (Avnimelech, 2006). It is
estimated that 85% of phosphorus, 80-88% of carbon, 5295 % of nitrogen (Wu, 1995) and 60% of mass feed input
in aquaculture will end up as particulate matter, dissolved
chemicals, or gases (Masser, et al., 1999). That why in
conventional aquaculture often replace 5-10 % of water
every day. Moreover, in recent years, environmental
regulation and land limitation become the most
consideration in aquaculture development.
Integrated multi-trophic aquaculture (IMTA) is a new
concept of aquaculture that different to polyculture
terminology. With the multi-trophic approach, aquaculture
of fed organisms (fin-fish or shrimp) is combined with the
culture of organisms that extract either dissolved
inorganic nutrients (seaweeds) or particulate organic
matter (shellfish) and, hence, the biological and chemical
processes at work are balancing each other (Chopin, 2006).
This concept seems to become a future of aquaculture
systems and operations. FAO (2012) states that one-third
of the world’s farmed food fish harvested in 2010 was
achieved without the use of feed, through the production
of bivalves and filter-feeding carps.
IMTA usually operated in open water-based
aquaculture, such as mariculture or cages in lakes or
reservoirs. While land-based aquaculture, water and land
use are rapidly becoming a strong factor driving the
80
© IJSE – ISSN: 2086-5023, 15th April, 2013, All rights reserved
Internat. J. of Sci. and Eng., Vol. 4(2)2013:80-85, April 2013, Sumoharjo and Asfie Maidie
adoption of recirculating technologies. A fish farm can take
full advantage of IMTA once the nutrient discharge by the
fed (fish) component is fully balanced by the harvest of the
xtractive components (seaweeds and suspension
suspension- and
deposit-feeders) (Troell et al.,, 2009). Therefore, the
biological
iological filter components play an important role in such
systems. Its efficiency in removing nutrient waste from
fish tanks is the main goal to design the biofilter systems.
Because of relatively high cost, built recirculating
aquaculture systems should be designed such that it is
efficient, cost-effective
effective and simple to operate. This
research was an effort to develop biofiltration
n subsystems
and to analyze its efficiency in removing nutrient waste
and increasing carrying capacity to a pilot scale of
integrated multi-trophic
trophic reciculating aquaculture system.
II. MATERIAL AND METHODS
2.1. IMTA System Description
A pilot scale of IMTA was set up for raising two species
of fish in different trophic level, i.e.; climbing perch
(Anabas testudineus Blk) and nile tilapia (Oreochromis
Oreochromis
niloticus).
). Fish tank construction made from wood coated
with fiberglass. The biofilter system was placed in series
with the fish tanks. The biofilter systems consisted of eight
run-raceways
raceways (2 meters in length and 13 cm in width of
each) with effective volume was 140 liters.
Figure 1. Sketch of pilot scale integrated multi
multi-trophic
aquaculture configuration.
Where; 1= climbing perch’s tank as carnivorous, 2 =
nile tilapia’s tank as herbivorous; 3. Silky worm’s
raceways; and 4 = plant’s raceways as photoautotrophic.
Table 1. Experimental biofilter characteristics
Unit
Description
Volume
140 liters
Height of water level
6,5 cm
Hydraulic retention time
28 minutes
Media type
PVC
Bio-net
net 1 mm diameter
Polystyrene sheet
7.95
16.46 hours
Filter coefficient
Turn over duration
2.2. Experimental conditions
The experiment was conducted
d for 5 weeks between
June and July 2012 at Laboratory of Fish Genetic and
Reproduction of Fisheries and Marine Science Faculty,
Mulawarman University Samarinda.
The rearing tanks consisted of a 1,09 m3 for growing a
8,0 kg/m3 of climbing perch (Anabas testudineus
studineus) weighing
40,2±3,36 grams, and a 0,98 m3 rearing tank was being
stocked 6,58 kg/m3 of nile tilapia (Oreochromis
Oreochromis niloticus)
niloticus
weighing 29,3±12,46 grams. Floating pellets containing
32 % protein were used to feed the fish at satiation rate.
Fish was weighed at the end of experiment (at 32 days)
The number and weight of fish taken out from each of the
culture tanks was recorded for calculating fish growth
parameter. Fish dead during experiment was replaced
with the same size to keep the constant number
num
of fish in
the tanks. Death time and fish size were recorded to figure
out the survival rate parameter.
Water flow maintained at 5 liters per minutes
throughout the experiment units including nutrient waste
(effluent) discharged from fish tank to bioreactor.
bior
Silky
worm (Tubifex sp) that stocked at the bioreactor spread
out 3 individual/cm2 in three raceways (raceway 1-4).
1
While spinach (Ipomoea reptana),
), green mustard (Brassica
(
juncea)
and
basil
(Ocimum
Ocimum basiliucum)
basiliucum
were
hydroponically planted 40 plants of each at raceway 4-8.
4
Planting lay out were conducted in completely randomized
block design regarding to flow direction and used rafting
technique where the plants floated by polystyrene sheets.
2.3. Water Quality
Water was sampled twice a week at five points
po
based
on organism areas, i.e.; (1) inlet of bioreactor or the 1st
raceway (outlet of nile tilapia’s tank), (2) inlet of
phototrophic or the 4th raceway, (3) outlet of bioreactor,
(4) outlet of climbing perch (A.
A. testudineus)
testudineus tank, and (5)
in the nile tilapia (O. niloticus)) tanks. Samples were
analyzed for TAN (total ammonia nitrogen), NO2-N
NO2
(nitrite-nitrogen), NO3-N (nitrate-nitrogen),
nitrogen), and PO4-P
PO4
(ortho-phosphate)
phosphate) by using Genesis Spectrophotometer ().
Water temperature, pH, DO (Dissolved oxygen), alkalinity
alk
and CO2 (carbon dioxide) were also measured, following
standard methods (APHA, 1992)
2.4. Calculations
Calculation steps to determine biofilter efficiency.
Total Ammonia Nitrogen (TAN) production calculated
based on nitrogen mass balances using value for
fo TAN
produced per kg of feed (Timmons, et al.,2002)
al.,
:
Where: PTAN = total ammonia production rate (kg/day);
F is feed rate (kg/day); PC is the protein content of feed
(decimal value). 0,09 constant in ammonia generation
equations assumes that protein iss 16% nitrogen, 80%
nitrogen is assimilated by the organism, 80% assimilated
nitrogen is excreted, and 90% of nitrogen excreted as
TAN+10% as urea.
Then, TAN loading rate calculation based on Wheaton
(1977), ammonia accumulation factor (C) due to
recirculation
ation determined by following equation.
Where: Climit.TAN is allowable ammonia concentration,
CTAN is single pass ammonia concentration that
determined with, CTAN = PTAN (gm/d)/water flow rate, Q
(m3/hari), and TAN loading rate determined with equation.
81
© IJSE – ISSN: 2086-5023, 15th April, 2013, All rights reserved
Internat. J. of Sci. and Eng., Vol. 4(2)2013:80-85, April 2013, Sumoharjo and Asfie Maidie
Total ammonia load into bioreactor, LTAN in (gram
TAN/day) = PTAN ´ C
The final ammonia concentration that measured at the
outlet of bioreactor. Thus, TAN loading out of bioreactor
(gm/day) is
LTAN out = CTAN.out (gm/m3) ´ Q (m3/day).
CTAN.out is total ammonia
mmonia nitrogen concentration out of
bioreactor, Q is water flow rate. Thus, Ammonia
biofiltration efficiency (%) can able determined by
following equation.
Carrying capacity (loading density) and fish biomass
density.
According to TAN biofiltration efficiency, hydraulic
recirculation rates (R),
), feeding rates, and tanks volume.
The maximum carrying capacity of the fish tanks without
water exchanges determined by Westers (1997) equation.
TAN tends to decrease during experiment, nitrite started
rising at day-16 while nitrate
te also increased during
experiment. In 32 days experiment, nitrification process
seemed to follow the first order reaction, when at
sufficiently low substrate concentration, the relationship
become linear (Chen et al., 2006). However, at the
experiment showed
owed that nitrite oxidation rate to nitrate
appears did not have linear correlation, nitrite
accumulation occurred in day-20
20 and made nitrate
production become slower. The accumulation of nitrite
suggested that ammonium and nitrite oxidations did not
proceed
ed at the same rates in the batch experiments (Sesuk
et al., 2009).
Oxidation of ammonia is usually the rate limiting step
in the conversion of ammonia to nitrate (Chen et al., 2006).
Thus value of ammonia oxidation are the rate limiting
parameters in describing
cribing nitrification (Wheaton et al.,
1994).
Where LD is fish loading density (kg/lpm), EffTAN is
TAN biofiltration efficiency, Vtank is fish tanks volume
(liter), ANO3 is allowable nitrate nitrogen, FR is feeding
rate (%/BW/d), PTAN is TAN production (g/d); 4,2 constant
is come from 1 molecule of TAN generate 4,2 molecules of
NO3; R is recirculation rates (-hour)
Therefore, maximum fish density can be expressed
with this equation.
Figure 2. Nitrogen dynamic of TAN, NO2-N,
- NO3-N and PO4-P
Where D is fish density (kg/m3); LD is loading density
(kg/lpm), R is recirculation rates, and 0,06 represents m3
from 1,0 lpm ´ 60 minutes = 0,06 m3.
III. RESULTS AND DISCUSSION
3.1. Fish performance and TAN Production
During the 32 days of grow out period, climbing
perch feed consumption is very small compared to tilapia,
which 0,5 kg of feed while tilapia can spend 1.96 kg of
feed.
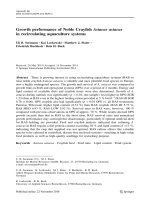
For the total growth during the 32 days of grow out
period,
eriod, the average climbing perch and tilapia has reached
the size of 46.0±8,47 gm and 42,4±27,73 gm, respectively.
Based on unpaired t test assuming not the same variance,
the growth of these two species were significantly
different (P <0.05). According to
o total feeding rate, TAN
production rate was 72,5 gm TAN/kg feed. It means that
2,94 % of TAN produced per kg feed, this value was not
significant different with the standard of the estimation
TAN production that published by Malone, et al (1990),
which iss in the same feeding rate could generate 2,74 % of
TAN/kg feed.
Nitrogen dynamics represented by TAN, nitrite and
nitrate concentration fluctuated during the experiment.
A. Effects of Biofiltration efficiency to carrying capacity
The production capacity of fish that can be produced by
the IMTA system is analyzed through
gh a combination of two
major limiting factors i.e., dissolved oxygen and total
ammonia nitrogen. Model calculations then consider other
controlling factors such as feeding rate of water flow, the
amount of water circulation, and the efficiency of the
biofilters.
ilters. Based on the concentration of dissolved oxygen,
systems can accommodate a maximum density of 25.8
kg/m3 of climbing perch, while the tilapia is still capable of
supporting up to a maximum density of 47.7 kg/m3. The
results of these calculations based
ed on the value of the
oxygen fish need oxygen concentration available and the
remaining oxygen is not used for respiration. The more
fish the greater oxygen needed to supply the needs of fish
(Colt, 1991; Wester, 1997).
The difference in capacity between trophic I (climbing
perch) and trophic II (nile tilapia) is strongly influenced by
the IMTA system configuration, in which the layout like
tilapia are in a position after filtration and before tilapia
tank, it makes the climbing perch get a supply of water
containing higher oxygen, whereas theirs oxygen demand
themselves lower. The types of labyrinth fish (with
additional respiratory system) such as climbing perch are
© IJSE – ISSN: 2086-5023, 15th April, 2013, All rights reserved
82
Internat. J. of Sci. and Eng., Vol. 4(2)2013:80-85, April 2013, Sumoharjo and Asfie Maidie
not sensitive to the concentration of oxygen in water
(Zonnenfeld, 1991).
In IMTA system, water was recirculated continuously,
where water with higher oxygen concentration from
climbing perch’s tank flows into the tilapia’s tank thus
providing a greater influence on the capacity of tilapia
production. However, in the three-week maintenance
period, the fish still need oxygen to be supplied from the
flow of water out of the tank with flow rates 5 liters /min,
but then the concentration of oxygen is already close to
zero, and tilapia loss of appetite. To overcome this added
bubble jet aeration system, but it also only lasted for two
weeks. Thus, changes made to the aeration system keeps
the water fountain with a height of 1 meter, the system is
able to maintain the DO concentration in the tank of tilapia
with an average of 1.3 mg/l.
Modeling fish densities can be done if the oxygen
demand is not a problem in the system. Brune, et al.
(2003) states that if the concentration of oxygen is
sufficient for the needs of the fish and the stripping of CO2
through aeration, the NH3 will be a limiting factor within
24 hours. Therefore, the density of the fish will be strongly
influenced by the nitrogen removal efficiency in the
system. Based on the average values of temperature and
pH, the fraction of unionized ammonia (NH3) is only 1.91%
on average in the tank of climbing perch and 1.76% at the
tilapia tank. Biofiltration efficiency of TAN was 86.5%
overall. Model density of fish made on the basis of the
efficiency of biofiltration of ammonia and dissolved
oxygen demand estimated of 62.69 kg/m3 fish biomass.
However, the water quality parameters will begin to limit
the carrying capacity allowed for waste degradation,
accumulation of ammonia, carbon dioxide, and suspended
solids (Timmons and Ebeling, 2007).
Carrying capacity calculation procedure was based on
the calculations made by Losordo and Hobbs (2007) as
shown in the following worksheet.
Flow calculations represent the factor analysis
procedure with ammonia production as a limiting factor to
the efficiency of biofilters as independent variables
(Wheaton, 1977; Wester, 1997; Drenan II, 2006; Ebeling,
2006; Timmons and Ebeling, 2007). Production of
ammonia was generated by the calculation of Drenan II
(2006) at 3.06 g/day was not much different when using
the equation of Ebeling (2006), which was equal to 3.28
g/day.
Through the process of biofiltration with trophic level
detrivorous (Tubifex sp) and phototrophic (spinach,
mustard greens, and basil) on a scale integrated
aquaculture systems multi-trophic pilot was able to
absorb the ammonia waste by 86.5% of TAN. This value is
higher than ever published by Graber and Junge (2009)
that 69 % of nitrogen removal by the overall system could
thus be converted into edible fruit in hydroponic system
design only. Therefore, based on the calculation of
production capacity due to TAN removal efficiency, a
culture system like this can result in fish biomass of 62.69
kg/m3. However, according to Timmons and Ebeling
(2007) stated that do not get stuck on the calculation of
the mathematical models because you can kill fish, so to be
safe, it is recommend stocking half of the results of these
calculations (only 31.34 kg/m3 of fish biomass is
recommended).
IV. CONCLUSIONS
A pilot-scale of integrated multi-trophic aquaculture
production systems set up in this study generally works
well for a single production cycle (32 days). Although
there is no water exchanges, but the subsystem designed
biofilter still able to maintain optimum water conditions
for the survival and growth of fish. Maximum production
capacity of fish that can be produced from an integrated
multiple trophic with a total volume of 2.2 m3 of water was
25.30 kg of climbing perch and 39.58 kg of tilapia; 772.1
grams of spinach, 333.6 grams of basil, and 217, 6 grams of
mustard for 28 days, and 789,533 individual of silky worm
(Tubifex sp) for 32 days.
Table 2. Worksheet calculation of system’s carrying capacity
No.
1.
2.
3.
Description
Fish tanks volume (Vt)
Filter volume (Vf)
Total volume system (Vs)
Value
2.07
0.14
2.21
m3
m3
m3
Units
PxLxT
PxLxT
Vt + Vf
Formula
4.
5.
6.
Flow rate (Q)
Recirculation rates (R)
Tanks retention time (RTt)
7.20
0.14
3.57
m3/day
Hour-1
Hour
(5 lpm*1440)/1000
0.06*Q (Lpm)/Vs(m3)
1/R
7.
Filter retention time (RT)
28
Minute
Vf (L)/Q (Lpm)
8.
9.
Total feed (TF)
Feeding rate/day (F)
2.46
0.08
kg
kg
Experimental result
Experimental result
10.
Protein content (PC)
32
%
Experimental result
11.
12.
0.54
0.47
g/m3
g/m3
Experimental result
Experimental result
13.
TAN inlet concentration (Cin)
TAN outlet concentration
(Cout)
Allowable TAN (TANlimit)
2.0
g/m3
Experimental result
14.
Feeding Rate (FR)
3.40
%/bw/day
Experimental result
15.
Allowable NO3 (ANO3)
200
g/m3
Wester (1997)
16.
Circulation Percentage (R)
0.96
%
Wheaton (1977)
PROSES
17.
TAN Production (PTAN)
2.27
g/d
F*PC*0,095*1000
18.
TAN single pass
concentration (Ci)
TAN accumulation factor (C)
TAN loading rate (LTANin)
0.31
g/m3/d
PTAN/Q
6.35
14.40
g/d
TANlimit/Ci
PTAN*C
Hydraulic Retention Time
(HRT)
Exchange Rate (R)
0,47
hour
Vf (m3)/Q (m3/day)*24 hour
0.14
kali/hr
0.06* Q (lpm)/Vtank (liter)
TAN concentration in the
filter outlet (Cout)
TAN loading out (LTANout)
0.27
g/ m3
Experimental result
1.94
g/day
Cout (g/m3/day)*Q (m3)
25.
TAN Removal Rate
(%TANrem)
86.5
%
(LTANin-LTANout)/LTANin)*100
26.
Carrying capacity (LD)
25.95
kg/lpm
19.
20.
21.
22.
OUTPUT
23.
24.
27.
Fish density (D)
62.69
kg/ m
(%TANrem*100*Vs*1000*ANO3)/
(%FR*TANF*4.2*R*1000)
(LD*R)/0.06
28.
Total biomass (TB)
kg
D (kg/m3)*Vtank (m3)
29.
% biomass of perch (%BIB)
129.77
0.39
30.
% biomass of tilapia (%BIN)
Max. biomass production of
perch (PM)
Max. biomass production of
tilapia (PM)
Max. biomass production of
perch (PM)
Max. biomass production of
tilapia (PM)
31.
32.
33.
34.
3
Experimental result
0.61
Experimental result
50.61
kg
TB*%BIB
79.16
kg
TB*%BIN
25.30
kg
39.58
kg
1/2*PM (Timmons & Losordo,
2007)
1/2*PM (Timmons & Losordo,
2007)
Given that the investment cost for the installation of
recirculation system is considerably high, the cultured
species has to be selected for those who are fast growth
© IJSE – ISSN: 2086-5023, 15th April, 2013, All rights reserved
83
Internat. J. of Sci. and Eng., Vol. 4(2)2013:80-85, April 2013, Sumoharjo and Asfie Maidie
and high economic value, as well as a uniform seed size.
Although aiming for sustainability of local fish, but given
the low growth rate, then the selection of climbing perch
(Anabas testudineus) in aquaculture systems may be less
favorable. For the types of plants that are used to absorb
nitrogen waste, spinach (Ipomoea reptana) and basil are
recommended to be used, although the price is relatively
low, but the rate of growth (harvest every 14 days) and
the high absorption rate of nutrients added value in terms
of economic benefits and health.
Acknowledgments
This paper includes results obtained from national
strategic research project funded by Directorate General of
Higher Education, National Education Ministry of
Indonesia, and authors wish to thank to the students
involved for their valuable supports.
References
[1]. American Public Health Association [APHA]. 1992. Standard Methods
for Examination of Water and Wastewater,18th ed. American Public
Health Association, American Water Works Association, Water
Pollution Control Federation,Washington, DC.
[2]. Avnimelech Y. 1999. Carbon/nitrogen ratio as a control element in
aquaculture system. J. Aquacultural Engineering 176 : 227-235.
doi: />[3]. Avnimelech Y. 2006. Bio-filters : the need for an new comprehensive
approach. J. Aquacultural Engineering 34:172-178.
doi: />[4]. Brune DE., Schwartz G., Eversole AG., Collier JA., Schwedler TEl.
2003. Intensification of pond aquaculture and high rate
photosynthetic system. J. Aquacultural Engineering 28 : 65-86. Doi:
/>[5]. Chen S, Ling J, Blancheton JP. 2006. Nitrification kinetics of biofilm as
affected by water quality factors. J. Aquacultural Engineering 34 :
179-197. doi: />[6]. Chop in, T. 2006. Integrated multi-trophic aquaculture. Peter
Chettleburg. Northen Aquaculture.
[7]. Colt, J.1991. Aquaculture production system. J. of Animal Science.
69:4183-4192.
[8]. Drenan II., DG., Hosler, KC., Francis, M., Weaver, D., Aneshansley, E.,
Beckman, G., Johnson, CH., Cristina, CM. 2006. Standardized
evaluation and rating of biofilters II. Manufacturer’s and user’s
perspective. J. Aquacultural Engineering 34 : 403-416.
Doi: />[9]. Food and Agricultural Organization 2010. The statement of world
fisheries and aquaculture. Fisheries and Aquaculture Department.
Rome, Italy.
[10]. Food and Agricultural Organization. 2012. The statement of world
fisheries and aquaculture. Fisheries and Aquaculture Department.
Rome, Italy.
[11]. Graber A dan Junge R. 2009. Aquaponic system : Nutrient recycling
from fish wastewater by vegetable production. Desalination 246 :
157-156.
[12]. Losordo TM dan Hobbs AO. 2007. Using computer spreadsheets for
water flow and biofilter sizing in recirculating aquaculture
production systems. J. Aquacultural Engineering 23: 95-102.
[13]. Malone,R.F., Rusch,K.A., Burden,D.G. 1990. Kemp’s Ridley Sea
Turtle Waste Characterization Study : precursor to a recirculating
holding system design. J. World Aquacul. 21(2):137–144.
Doi: />[14]. Masser,M.P., Rakocy, J., Losordo,T.M., 1999. Recirculating
Aquaculture Tank Production Systems. Management of
Recirculating Systems. SRAC Publication No.452USDA,12pp.
[15]. Rakocy JE,. Masser MP., Losordo TM. 2006. Recirculating
Aquaculture Tank Production Systems: Aquaponics-Integrating
Fish and Plant Culture. Revision. SRAC Publication No. 454. Virginia.
US.
[16]. Sesuk T., Powtongsook S., Nootong K. 2009. Inorganic nitrogen
control in a novel zero-water exchanged aquaculture system
integrated with airlift-submerged fibrous nitrifying biofilters.
Bioresource Technology 100:2088-2094.
Doi: />[17]. Timmons, MB. dan Ebeling, JM.. 2007. Recirculating Aquaculture.
Cayuga Aqua Ventures. Northeastern Aquaculture Centre. US. 976
p
[18]. Troell, M., Joyce, A., Chopin, T., Neori, A., Buschmann, AH., Fang, JG.
2009. Ecological engineering in aquaculture-potential for
integrated multi-trophic aquaculture (IMTA) in marine offshore
systems. Journal of Aquaculture 297 : 1-9
Doi: />[19]. Westers. H. 1997. Production Capacity of Aquaculture Systems.
Aquaculture Bioengineering Corp. River Junction MI. 49277
[20]. Wheaton FW. 1977. Aquacultural Engineering. Maryland. US : A
Wiley-Interscience Publication.
[21]. Wimberly, D.M. 1990. Development and evaluation of alow-density
media biofiltration unit for use in recirculating fish culture systems.
Master’s Thesis. Louisiana State University, Baton Rouge,LA, 162
pp.
[22]. Wu,R.S.S.,1995.The environmental impact of marine fish culture:
towards a sustainable future. Mar. Pollut. Bull. 31(4-12),159-166.
[23]. Zonnenveld A, Huisman, EA, Boon, JH. 1991. Principles of
Aquaculture. Jakarta: PT. Gramedia Pustaka Utama. Jakarta.
© IJSE – ISSN: 2086-5023, 15th April, 2013, All rights reserved
84