Feed efficiency of rainbow trout (onchorynchus mykiss) kept at high and low stocking density
Bạn đang xem bản rút gọn của tài liệu. Xem và tải ngay bản đầy đủ của tài liệu tại đây (327.81 KB, 8 trang )
International Journal of Recirculating Aquaculture
Volume 13: 11-18
2016
Feed efficiency of rainbow trout (Onchorynchus mykiss)
kept at high and low stocking density
Wendy M. Rauw 1 , Ana M. Larr´an2 , Luis-Alberto Garcia-Cort´es1 , M. Lujan Rodriguez2 , Jes´us Fern´andez1 , Julia
Pinedo2 , Morris Villarroel3 , Miguel-Angel Toro3 , Cristina Tom´as-Almenar2 , and Luis Gomez-Raya2
1
Departamento de Mejora Gen´etica Animal, Instituto Nacional de Investigaci´on y Tecnolog´ıa Agraria y Alimentaria
(INIA), Ctra. de La Coru˜na km 7, 28040 Madrid, Spain
2
Centro de Investigaci´on en Acuicultura de ITACYL, 40196 Zamarramala, Segovia, Spain
3
Departamento de Producci´on Animal, ETS Ingenieros Agr´onomos, Universidad Polit´ectica de Madrid, Ciudad
Universitaria, Madrid, Spain
ABSTRACT
Feed efficiency is a trait of high economic importance in fish production, and is highly related to feeding
regimes employed and stocking density. However, feed efficiency is difficult to estimate because measurements of individual feed intake are generally not available in fish that are usually reared in groups in
tanks. An alternative is to estimate feed efficiency using tank as the unit of measurement. The objective
of this study was to investigate tank residual feed intake in rainbow trout kept at high (HD) and low (LD)
stocking density during 42 days (Day 0-14 and Day 14-42) and the consequences of subsequently reducing density in the HD treatment between 42 and 78 days (Day 42-61 and Day 61-78). HD fish weighed
less at all times than LD fish (P < 0.05). LD fish grew faster than HD fish (P < 0.05) but not between
Day 42-61. The coefficient of variation of body weight was larger in HD fish than in LD fish (P < 0.05)
at Day 14 and Day 42. LD fish ate more than HD fish between Day 14-78 (P < 0.01). HD fish were less
food efficient than LD fish between Day 0-14 but more food efficient between Day 42-61. A higher coefficient of variation of body weight in the HD tanks suggests that growth and feed intake were inhibited
because of dominance relationships at a high stocking density and possibly competition for food. After
relocating HD fish to a low density treatment, HD fish showed compensatory growth and compensatory
feed efficiency. Although it is not practical to estimate residual feed intake individually in fish, this research shows that calculation of tank residual feed intake can be used as an alternative, especially when
used to compare families for family trait selection.
Keywords: growth, feed efficiency, fish, residual feed intake, stocking density, trout
1. Introduction
feed efficiency, resistance to disease, meat quality, and age at
maturation (Gjedrem, 1983). In farmed fish species, as in terrestrial animals, feed represents at least 50% of production costs;
in addition, it is responsible for a substantial part of environmental loading (Grima, et al, 2008). However, despite its importance, measurement of feed efficiency requires advanced methods. Therefore, in contrast with terrestrial livestock species,
knowledge on feed efficiency in fish is limited.
Residual Feed Intake (RFI) is widely used as a selection criterion in genetic selection programs of terrestrial livestock animals, where low values indicate high feed efficiency (e.g. Rauw,
2012). In aquaculture species, individual feed efficiency is difficult to estimate, because measurements of individual feed intake
are generally not available in fish that are reared in groups in
tanks. Alternatively, individual feed efficiency can be recorded
using one fish reared per tank (Silverstein et al, 2005) or feed
According to the World Fish Centre, global per capita fish consumption has doubled over the past 50 years, and production
would need to double again to meet the projected demand over
the next 25 years. Since supply from capture fisheries is static,
with most stocks already heavily depleted, overfished or fully
exploited, the increased demand has to be met by an increase in
aquaculture production (Muir, 2005). Only about 10% of todays
global aquaculture production is based on genetically improved
stocks; some of the breeding programs consist only of the most
basic components of a breeding scheme, while others are more
advanced, including multi-trait breeding value estimation and
molecular marker information (Gjedrem et al, 2012). Traits of
high economic importance in fish production are growth rate,
Corresponding author email:
© 2016 International Journal of Recirculating Aquaculture
11
12
efficiency can be estimated using the X-ray technique (Grima,
et al, 2008). Whereas those methods are valuable in an experimental setting, they are difficult and costly to carry out routinely in fish production systems. A third alternative is to estimate feed efficiency using tank as the unit of measurement
(Mambrini et al., 2004).
Feed intake and efficiency are highly related to feeding
regimes employed and stocking density which directly influence
social interactions and competition for food (Thorpe and Cho,
1995; Cutts et al, 1998). Increasing stocking density can negatively influence feed efficiency in fish through increased levels
of stress and activity. For example, Larsen et al. (2012) observed
similar feed intakes but higher resting metabolic rates and therefore reduced feed efficiencies in rainbow trout in high density
groups compared with low density groups. In addition, Laursen
et al. (2013) observed that farmed rainbow trout in a high stocking density group had elevated stress levels and higher oxygen
consumption than those in a low stocking density group.
The objective of this study is to evaluate a method that involves measurement of residual feed intake by tank in Rainbow
trout (Onchorynchus mykiss). In addition we investigate tank
residual feed intake in fish kept at high and low stocking density and the consequences of reducing stocking density after a
period of high stocking density.
2. Materials and Methods
2.1. Animals and their management
A total of 2,000 rainbow trout (Onchorynchus mykiss), with an
average weight of 48 g, originating from a commercial trout
farm, were transported to the facilities of the Zamarramala
Aquaculture Centre (Segovia, Spain). The fish were randomly
placed into one of two independent recirculation units in two
separate adjacent rooms; each room consisted of 10 identical
tanks of 500 l each. After 15 days, in each room, 495 fish
were allocated to one high density tank (HD treatment) and five
groups of 99 fish each were allocated to five low density tanks
(LD treatment); the four remaining tanks in each room were left
empty for later use. The initial densities were 37 kg/m3 for the
high-density tanks and 6 kg/m3 for the low-density tanks. Fish
had four weeks to acclimatize before the start of the experiment
at Day 0.
Water came from a well with a constant temperature of 14.6
◦
C in a recirculation system, therefore, fish in tanks kept within
the same room share the same water. Fish were kept at a photoperiod of 12 hr. light - 12 hr. dark. During the experiment,
the average dissolved oxygen was greater than 7.4 ppm. The
pH hovered between 7.5 and 8.5, and levels of NH4+ between
0.1 and 0.2 ppm at all times. Fish were fed with a commercial diet using feeding tables recommended by the manufacturer
(DIBAQ DIPROTEG). Fish were provided with a starter diet
until reaching 100 g weight (43.7% protein, 16.0% fat) and with
a finisher diet (43.3% protein, 19.7% fat). Feeding was carried
out twice daily by hand and was ad libitum until fish stopped
eating.
At the beginning of the acclimatization period, a white spot
infection (Ichthyophthirius multifiliis) was observed that affected all tanks in both rooms. Dead fish were removed from
each tank daily and diagnosis was confirmed by microscopic
examination of small superficial scrapes of skin. Tanks were
instantly treated with formalin at a dose of 250 ppm and contaminated water replaced every two days. Skin analysis showed
that the infection was eliminated within 12 days of the acclimatization period. To assure that the infection did not return, small
scrapes of skin were collected on a sample of 8 fish per tank
during all the weight measurements.
2.2. Feeding experiment
At Day 0, the experiment started with 56 to 65 animals per tank
in the ten tanks assigned to the LD treatment, and 401 and 416
animals per tank in each of two tanks assigned to the HD treatment. At Day 42, the average density in the tanks was 55 and
11 kg/m3 for the HD and LD treatments, respectively. At that
point, the fish in each room belonging to the high-density tank
were divided into five equal groups and redistributed over five
tanks, with an average density of 11 kg/m3 . The trial ended on
Day 78, at which the average density in the tanks was 17 and 16
kg/m3 for the HD and LD treatments, respectively.
Body weight (BW) and fork length (FL) were individually recorded five times at Day 0, 14, 42, 61, and 78 after
anaesthetization with tricaine methanesulfonate (MS222®).
Cumulative feed intake and biomass gain was calculated
for each tank for Period 1 (Day 0-14), Period 2 (Day 1442), Period 3 (Day 42-61) and Period 4 (Day 61-78). Feed
intake (FI), body weight and body weight gain (BWG) of
an average fish were calculated for each tank by dividing total feed intake, biomass and biomass gain for each
tank by the number of fish. Specific rate of increase in
weight (SGR) and length (SLR) were calculated as SGR =
(Ln(weightend ) − Ln(weightstart ))/(time)(100%), and
SLR = (Ln(lengthend ) − Ln(lengthstart ))/(time)(100%),
where the weight and length at the end and start correspond
to those of Period 1, 2, 3 and 4 (Hopkins, 1992). The coefficient of variation of body weight (CVBW) was calculated as
CV BW = ([sd/mean]100) of body weight.
An overview of the experimental procedures is given in Table 1. The experiment had approved animal care protocols from
the Instituto Tecnol´ogico Agrario of Junta de Castilla y Le´on
(Spain).
2.3. Feed efficiency: residual feed intake
The equation used to estimate residual feed intake (RFI) for
each tank was based on the following multiple linear regression of food intake on metabolic weight and body weight gain
of an average fish in each tank:
FEED EFFICIENCY OF RAINBOW TROUT
13
Table 1. Overview of experimental procedures.
Table 1. Overview of experimental procedures.
Day of Experiment
Procedure
-45
Rainbow trout arrive at Zamarramala Aquaculture Centre
-30
Fish are allocated to high and low density experimental tanks
0
First weight and length measurement
14
Second weight and length measurement
42
Third weight and length measurement.
Fish of the high density treatment are reallocated to low density tanks.
61
Fourth weight and length measurement
78
Fifth weight and length measurement
F Ii = b0 +
(b1 BWi0.80 )
+ (b2 BW Gi ) + ei
(1)
Where F Ii = feed intake of an average individual in tank i (kg);
BW i0.80 = metabolic body weight of an average individual in
tank i (kg 0.80 ); BW Gi = body weight gain of an average individual in tank i (kg); b0 = the population (tank) intercept; b1 , b2
= partial regression coefficients representing maintenance requirements per metabolic body weight and feed requirements
for growth, respectively; and ei = the error term, which represents the RFI of an average individual in tank i. Metabolic body
weight was estimated as the average value of body weight of an
average individual at the beginning and at the end of each period
to the power 0.80 (Grima, et al, 2010). Animals with a negative
RFI are more feed efficient than the average of the population
on which the model is formed, whereas animals with a positive
RFI are less feed efficient.
2.4. Statistical analysis
The SAS program (SAS Inst. Inc., Cary, NC) was used for the
statistical analysis of all traits. The analysis of variance model
used to describe individual body weight and fork length was:
Yijk = µ + Roomi + T reatmentj
+(Room)(T reatment)ij + eijk
(2)
where Roomi = the effect of the room i (2 rooms; fixed effect), T reatmentj = the effect of the stocking density j (HD,
LD; fixed effect), (Room)(T reatment)ij = the interaction effect of Room i with Treatment j, and eijk = the error term of
animal k, eijk < N ID(0, σe2 ). Body weight and fork length
tested under this model were denoted by Yijk , as measured on
animal k situated in room i, allocated to treatment j. Initially,
the effect of tank was also included, but because this effect was
not significant, it was excluded from further analysis. The same
model, but excluding the non-significant interaction effect of
(Room)(T reatment)ij , was used to analyze CVBW.
Feed intake, RFI, BWG, SGR, and SLR are not estimated
individually but for each tank, expressed as the values of an
average fish in each tank. The analysis of variance model used
to describe these traits in each period was:
Yijkl = µ + Roomi + T reatmentj + P eriodk
+(T reatment)(P eriod)jk + eijkl
(3)
where Roomi = the effect of the room i (2 rooms; fixed effect),
T reatmentj = the effect of the stocking density j (HD, LD;
fixed effect), P eriodk = the effect of the period k (Period 1 to
4; fixed effect), (T reatment)(P eriod)jk = the interaction effect of Treatment j with period k, and eijk = the error term of an
average animal l, eijk < N ID(0, σe2 ). Average daily FI, RFI,
BWG, SGR, and SLR tested under this model were denoted by
Yijk , as measured on an average animal l situated in room i,
allocated to treatment j in period k. Initially, the interaction effects of room with treatment and period were also included, but
because these effects were not significant, they were excluded
from further analysis.
Values are presented as least squares means and phenotypic
correlations are estimated after adjusting for the effects included
in models (2) or (3). Post hoc statistical power was computed using the means and standard deviations within treatment (low or
high density) observed in this experiment and together with the
software Gpower (Faul et al., 2007). The power for significance
levels of 0.05 and 0.01 was 0.75 and 0.49, respectively.
14
3. Results
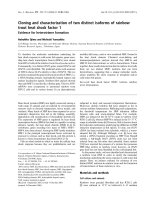
3.1. BW, FL, BWG, SGR, SLR, CVBW and FI
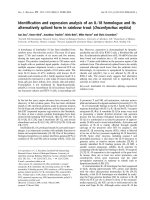
Figure 1 presents least squares means of body weight (a), fork
length (b) and the coefficient of variation of body weight (c) at
Day 0, 14, 42, 61, and 78 for each treatment. Fish in the high
density stocking treatment weighed less at all times than fish in
the low stocking treatment (P < 0.05 at Day 0, P < 0.01 at
Day 14, and P < 0.0001 at Day 42 to 78; Figure 1a), and
shorter between Day 14 and 78 (P < 0.01 at Day 14, and
P < 0.0001 at Day 42 to 78; Figure 1b). LD fish grew faster
than HD fish in Period 1 (0.90 ± 0.03 vs 0.71 ± 0.06 g/d, respectively; P < 0.05), Period 2 (10.4 ± 0.03 vs 0.73 ± 0.06
g/d, respectively; P < 0.0001) and Period 4 (12.0 ± 0.03 vs
10.4±0.03 g/d, respectively; P < 0.0001), but growth rate was
not significantly different between LD and HD fish in Period 3
(12.2 ± 0.03 vs 12.0 ± 0.03 g/d, respectively). The specific
rate of increase in weight was higher in LD fish than in HD
fish in Period 1 (1.68 ± 0.03 vs 1.42 ± 0.07%, respectively;
P < 0.01) and Period 2 (1.40 ± 0.03 vs 1.13 ± 0.07%, respectively; P < 0.01), but was lower in Period 3 (1.21 ± 0.03
vs 1.39 ± 0.03%, respectively; P < 0.001) and similar in Period 4 (0.98 ± 0.03 vs 0.97 ± 0.03%, respectively). The specific rate of increase in length was higher in LD fish than in HD
fish in Period 1 (0.34 ± 0.009 vs 0.25 ± 0.02%, respectively;
P < 0.0001) and Period 2 (0.43 ± 0.009 vs 0.39 ± 0.02%, respectively; P < 0.05), but was similar in Period 3 (0.49±0.009
vs 0.48 ± 0.009%, respectively) and in Period 4 (0.35 ± 0.009
vs 0.35 ± 0.009%, respectively). The coefficient of variation of
body weight was significantly higher in HD fish than in LD fish
at Day 14 (P < 0.05) and at Day 42 (P < 0.01).
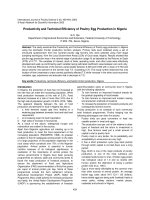
The relationship between cumulative feed intake and body
weight of an average fish is given in Figure 2, for each tank
in each of the four periods. Animals that ate more, grew faster
(R = 0.90, P < 0.0001). LD fish ate more than HD fish in
Period 2 (1.05 ± 0.02 vs. 0.84 ± 0.05g/d; P < 0.01), Period 3 (1.05 ± 0.02 vs 1.17 ± 0.02g/d; P < 0.0001) and Period 4 (1.41 ± 0.02 vs. 1.21 ± 0.02g/d; P < 0.0001), but
the difference was not significant in Period 1 (0.79 ± 0.02 vs.
0.73 ± 0.05g/d).
3.2. Feed efficiency
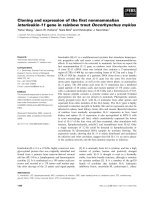
The relationship between feed intake, and metabolic body
weight and body weight gain of an average fish in each tank is
given in Figure 3a and 3b, respectively. The R2 of equation (1)
indicated that 65% of the variation observed in FI could be attributed to variation in metabolic body weight and body weight
gain.
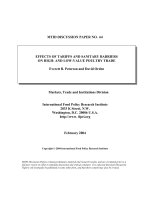
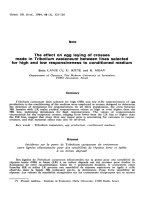
Average residual feed intake for each tank in each period is
given in Figure 4. HD fish had a higher RFI (were less feed efficient) than LD fish in Period 1 (P < 0.0001). The difference
had decreased and was no longer significant in Period 2. After
relocation, HD fish had a lower RFI (were more feed efficient)
than LD fish (P < 0.01). In Period 4, the differences had disappeared and RFI was no longer significantly different from zero
(P = 0.9985).
4. Discussion
Aquatic production systems are unique in that the animals utilize a three-dimensional medium, where density is defined as
the number of animals confined in a given three-dimensional
space as influenced by the number of fish or weight of fish per
volume (Conte, 2004). At high densities, inter-individual competition increases possibly as the result of the formation of dominance hierarchies (Adams et al., 1998; North et al, 2006). However, as densities further increase, the formation and maintenance of hierarchies may actually become more difficult (North
et al, 2006). When resources are limited within the group, the
most competitive individuals will gain a disproportionate share
of these resources, thus lowering the average success of group
members; the more restricted and defensible a food supply, the
greater the competition (Canario et al, 1998; Gilmour et al,
2005; North et al, 2006).
Competition between individuals in particular and fish to fish
interactions in general may result in concomitant levels of activity and stress (Conte, 2004). Metcalf et al. (1995) and Sloman
et al (2000) demonstrated that social status is strongly related
with standard metabolic rate in juvenile Atlantic salmon and
brown trout, respectively. Factors such as physical disturbance
and social domination of one fish by another can act as powerful stresses with an obvious and major influence on growth
rate and food conversion efficiency, partly as a result of the
catabolic or gluconeogenic effects of corticosteroids (e.g. Barton and Iwama, 1991; McCormick et al., 1998). As a consequence, high stocking density may lead to a decrease in overall
weight, length, growth rate and feed efficiency (Fagerlund et al,
1981). The feeding regimes employed in commercial fish farming thus influence the level of competition for feed resources
amongst fish and subsequently the productive output (Thorpe
and Cho, 1995; Cutts et al, 1998).
Li and Brocksen (1977) indicated that dominant trout in a
group grew faster and more efficiently than the rest of the population. As a result, it was observed that the variance of growth
rate, consumption rate and growth efficiency tended to increase
with density; this was suggested to be a good indication of intraspecific competition. Also, Jobling (1995) suggests that rapid
and homogeneous growth rates, and uniform body weights at
harvest, must result from a social environment that is favorable,
whereas the opposite holds when interindividual competition increases. Rapid and homogeneous growth is expected to be accompanied by a more favorable feed efficiency (Jobling, 1995).
In the present study, between Day 0 and Day 42, when fish
were kept at distinct stocking densities, animals in the high
stocking density treatment weighed significantly less and were
significantly shorter, had slower growth rates and lower specific
rates of increase both in weight and in length. In addition, fish
FEED EFFICIENCY OF RAINBOW TROUT
15
Figure 1. Least squares means of body weight (a), fork length (b) and the coefficient of variation of body weight (c) at Day 0, 14,
42, 61, and 78 for each treatment. LD = Low density treatment; HD = High density treatment.
were less feed efficient (had higher residual feed intake) than
LD fish, which was significant in the first period. The coefficient of variation of body weight (and of fork length; data not
presented) was larger in HD individuals than in LD fish at Day
14 and at Day 42. These results suggest that in the present experiment, growth was negatively influenced by the occurrence
of dominance relationships and stress at a high stocking density. Although feed was given to satiety, since feed was provided only two times a day, competition for food may still have
occurred when the group was thought to be nutritionally satisfied (and feeding was stopped), whereas submissive fish may
still not have eaten satisfactorily. Therefore, it is possible that
the reduction in efficiency and growth during this period may
have become counteracted by increasing the feeding rate. Indeed, whereas the stocking density in the HD group reached an
average of 55 kg/m3 , stocking density practices on commercial trout farms can be successful varying from < 20 to > 80
kg/m3 (North et al, 2003).
When an unfavorable resource situation is corrected, compensatory growth has been described in terrestrial farm animals
such as cattle and sheep (Ryan, 1990), and chickens (Zubair
and Leeson, 1996), but also in fish (Ali et al, 2003). Compensatory growth is described as accelerated growth after a period
of growth depression resulting from a limited resource avail-
140
130
120
110
100
90
80
70
60
50
40
0.40
Residual Feed Intake (g/d)
Body Weight (g)
16
0.20
0.10
0.00
-0.10
-0.20
P1
5
25
45
65
Cumulative Feed Intake (g)
P1
P2
P3
85
105
P4
Figure 2. Relationship between cumulative feed intake and
body weight of an average fish in each of the tanks for each of
the four periods. P1 = Period 1 (Day 0-14); P2 = Period 2 (Day
14-42); P3 = Period 3 (Day 42-61); P4 = Period 4 (Day 61-78).
Metabolic Body weight (kg0.80)
a 0.21
0.19
b
35
0.17
0.15
0.13
0.11
0.09
0.07
0.05
Body Weight Gain (g/d)
0.30
5
10
30
15
P1
20
25
Feed Intake (g/d)
P2
P3
30
35
30
35
P4
25
20
15
10
5
5
10
15
P1
20
25
Feed Intake (g/d)
P2
P3
P4
Figure 3. Relationship between feed intake, and metabolic
body weight (3a) and body weight gain (3b) of an average fish
in each of the tanks for each of the four periods. P1 = Period
1 (Day 0-14); P2 = Period 2 (Day 14-42); P3 = Period 3 (Day
42-61); P4 = Period 4 (Day 61-78).
ability due to undernutrition, stress or disease. Refstie and Kittelsen (1976) showed in brown trout that a high stocking density
can depress growth and that subsequently reducing the density
induces compensatory growth. In the present study, the difference in growth rate between LD and HD disappeared in Period
3 when fish in the high density group were relocated to a low
density treatment. The specific rate of increase in weight now
became larger in HD than in LD fish. In the last period, in
Period 4, LD fish again grew significantly faster than HD fish
while the specific rate of increase both in weight and in length
was similar between the treatments. It should be noted that the
P2
LD
P3
P4
HD
Figure 4. Residual feed intake of an average fish in each tank
for each period and each treatment. P1 = Period 1 (Day 0-14);
P2 = Period 2 (Day 14-42); P3 = Period 3 (Day 42-61); P4 =
Period 4 (Day 61-78); LD = Low density treatment; HD = High
density treatment.
results could not be tested against a control group maintained at
high density.
Weight gain during compensatory growth can be attributed
to the accumulation of protein and fat as well as water. Dobson and Holmes (1984), in rainbow trout, conclude that weight
gains are due to growth rather than to an increase in gut fat deposits or water uptake. It is unclear whether fish are eating more
feed during compensatory growth or whether they are processing it more efficiently, or a combination of both. In the present
study, HD fish ate less food per individual per day in each period than LD fish. The higher coefficient of variation of body
weight in the HD group suggests that the coefficient of variation
of food intake may also have been higher (but this could not be
estimated) resulting in some animals that were able to eat (considerably) more than other tank mates. To our knowledge there
are no reports in the literature regarding compensatory feed efficiency in response to a reduction in stocking density, after a
period of stocking at high density. Results of the present study
show that fish in the HD treatment became significantly more
feed efficient than LD fish, in the first period (Period 3) after relocation. This suggests that the compensatory growth observed
in Period 3 corresponds to a compensatory feed efficiency. Interestingly, the coefficient of variation in BW was no longer significantly different between HD and LD fish after Day 42 (relocation) and the difference reduced up to Day 78, indicating that
body weights became more homogeneous after relocation.
Two methods are used to evaluate feed efficiency in animal
production: feed conversion ratio (FCR) and residual feed intake (RFI). Feed conversion, the traditional measure of feed efficiency, is defined as the inputs (food) per unit of outputs (weight
gain). However, it shows significant phenotypic and genetic correlations with feed intake, growth rate, and mature size, moreover, the outcome of selecting for a ratio, when efficiency is
included in the selection index, cannot be predicted. In contrast,
RFI is defined as the difference between the actual feed intake
and that predicted from a linear regression of feed intake on
maintenance (metabolic body weight) and growth, and is there-
FEED EFFICIENCY OF RAINBOW TROUT
17
fore phenotypically independent of growth rate and body weight
(size) (Rauw, 2012). Variation in RFI can be caused by variation
in partial efficiencies for maintenance and growth and by variation in metabolic food demanding processes not included in
the model, such as behavioral activities, responses to pathogens
and responses to stress. Indeed, animals that are more active are
found to be less food efficient (Rauw, 2012). Herd and Arthur
(2009) indicate that, in beef cattle divergently selected for RFI,
9% of the proportions of variation in RFI could be explained by
physical activity, and 37% by tissue metabolism and stress. Also
in fish, activity rates can be a large and variable component of an
individuals energy budget (Boisclair and Sirois, 1993). According to Petrell and Jones (2000), energy expenditure in salmon
due to power requirements for swimming explained over 20%
of the observed difference in feed conversion ratio. Martins et al.
(2001) reported that high glucose responding African catfish,
i.e., animals that show a higher stress response, seem to be the
less efficient fish in terms of resource utilization for production.
In a later study in juvenile Nile tilapia they showed that individual differences in feeding activity and stress response explained
part of the differences in feed efficiency by explaining variance
in maintenance energy expenditure (Martins et al., 2011). Trenzado et al (2006) showed that selection for a high stress response
in rainbow trout affected feed efficiency negatively. These results were confirmed by Øverli et al (2006).
Heritabilities of RFI are estimated to be moderate (Crews,
2005) which has resulted in RFI to be included in the breeding
goal of several livestock species (Herd, 2009). Feed efficiency
is of high economic importance in livestock and aquaculture
species alike, however, measurement of feed efficiency in fish
is complicated since individual intake is very difficult to measure. As Grima, et al (2010) indicate, improving feed utilization
efficiency in aquaculture production systems is crucial. This requires both fundamental research into the phenotypic and genetic background of feed efficiency in different fish species and
how this correlates with other production and welfare traits, and
research into the practical application of techniques to measure
feed efficiency in commercial situations and implement these in
the breeding objective. Although individual feed recording by
evaluating fish independently or by using methods such as the
X-ray technique deliver useful fundamental information, these
methods are not practical in commercial situations. Therefore,
in the present experiment, we evaluated RFI by tank. Using tank
residual feed intake as a measure of feed efficiency allows for
the estimation of feed efficiency of a group of fish without registering individual feed intake. The draw-back is that there is one
recording per tank (feed intake and body weight) so a great deal
of information is lost when compared to individual recording.
Also, if applied in selection programmes, then all selection must
be based on group statistics, and consequently includes losing
within-group information (Kolstad et al, 2004). However, this
method may be particularly useful for selection within families.
Family selection is more efficient compared with individual selection for traits with low heritability, while it is less efficient for
traits with high heritability (Gjedrem, 2000). Family selection is
particularly useful for traits that are not practical to measure individually but that are possible to record in groups.
5. Conclusion
In the present study, fish in a high density treatment had reduced average body weights, growth, feed intakes and were less
food efficient. A higher coefficient of variation of body weight
in the HD tanks suggests that growth and feed intake was inhibited because of dominance relationships at a high stocking density and competition for food. After relocating HD fish to a low
density treatment, HD fish showed compensatory growth and
compensatory feed efficiency and the difference in coefficient
of variation of body weight between HD and LD fish decreased.
The commonly reported effects of group competition on reductions in food efficiency, nutritional condition and growth and
increase in fin erosion may be indicative of reduced welfare status. Increasing stocking density may be successful with additional measures, such as increased oxygen administration and
continuous feeding. Research is needed for prescribing acceptable levels of health, nutritional condition and behavioral indicators of intensively farmed fish (Ellis et al, 2005; 2008). With
heritabilities that are moderate, residual feed intake is included
in the breeding goal of several livestock species. Although it is
not practical to estimate residual feed intake individually in fish,
this research shows that calculation of tank residual feed intake
can be used as an alternative, especially when used to compare
families for family trait selection.
6. Acknowledgements
This work was financed by a grant from the Ministerio
de Econom´ıa y Competitividad of the Spanish Government
(grant AGL2012-39137) and a grant from the European Union
(KBBE-KBBE-7-613611). The authors greatly acknowledge
the technical support provided by Federico Santiago at ITACYL. Independent reviewers are gratefully acknowledged for
their comments to a previous version of the manuscript.
References
Adams, C.E., Huntingford, F.A., Turnbull, J.F., Beatie, C. 1998. Alternative competitive strategies and the cost of food acquisition in juvenile Atlantic salmon (Salmo salar)). Aquaculture 167, 17-26.
Ali, M., Ncieza A., Wootton, R.J. 2003. Compensatory growth in fishes:
a response to growth depression. Fish and Fisheries 4, 147-190.
Barton, B.A., and Iwama, G.K. 1991. Physiological changes in fish from
stress in aquaculture with emphasis on the response and effects of
corticosteroids. Annu. Rev. Fish Dis. 1, 3-26.
Boisclair, D., and Sirois, P. 1993. Testing assumptions of fish bioenergetics models by direct estimation of growth, consumption, and activity rates. Trans. Amer. Fish Soc. 122, 784-796.
Canario, A.V.M., Condeca, J., and Power, D.M. 1998. The effect of
stocking density on growth in the Gilthead sea bream, Sparus aurata.
Aquac. Res. 29, 177-181.
18
Conte, F.S. 2004. Stress and the welfare of cultured fish. Appl. Anim.
Behav. Sci. 86, 205-223.
Crews, D.H. 2005. Genetics of efficient feed utilization and national
cattle evaluation: a review. Genet. Mol. Res. 4, 152-165.
Cutts, C.J., Metcalfe, N.B., Taylor, A.C. 1998. Aggression and growth
depression in juvenile Atlantic salmon: the consequences of individual variation in standard metabolic rate. J. Fish Biol. 52, 1026-1037.
Dobson, S.H., and Holmes, R.M. Compensatory growth in the rainbow
trout, Salmo gairdneri. Fish Biol. 25, 649-656.
Ellis, T., North, B., Scott, A.P., Bromage, N.R., Porter, M., and Gadd,
D. 2005. The relationships between stocking density and welfare in
farmed rainbow trout. J. Fish Biol. 61, 493-531.
Ellis, T., Oidtmann, B., St. Hilaire, S., Turnbull, J.F., North, B.P., MacIntyre, C.M., et al. 2008. Fin Erosion in Farmed Fish, in Branson,
E.J., ed., Fish Welfare, Blackwell Publishing Ltd, Oxford, 121-149.
Fagerlund, U.H.M., McBride, J.R., and Stone, E.T. 1981. Stress-related
effects of hatchery rearing density on coho salmon. T. Am. Fish Soc.
110 644-649.
Faul, F., Erdfelder, E., Lang, A.G., Buchner, A.G. 2007. Power 3: A
flexible statistical power analysis program for the social, behavioral,
and biomedical sciences.. Behav. Res. Meth. 39, 175-191.
Gilmour, K.M., DiBattista, J.D., Thomas, J.B. 2005. Physiological
causes and consequences of social status in salmonid fish. Integr.
Comp. Biol. 45, 263-273.
Gjedrem, T. Genetic variation in quantitative traits and selective breeding in fish and shellfish. Aquaculture 33, 51-72.
Gjedrem, T. 2000 Genetic improvement of cold-water fish species.
Aquaculture Res., 31 25-33.
Gjedrem, T., Robinson, N., Rye, M. 2012. The importance of selective
breeding in aquaculture to meet future demands for animal protein:
A review. Aquaculture 350-353, 117-129.
Grima, L., Quillet, E., Boujard, T., Robert-Grani´e, C., Chatain, B.,
Mambrini, M. 2008. Genetic variability in residual feed intake in
rainbow trout clones and testing of indirect selection criteria. Genet.
Sel. Evol. 40, 607-624.
Grima, L., Vandeputte, M., Ruelle, F., Vergnet, A., Mambrini, M., and
Chatain, B. 2010. In search for indirect criteria to improve residual
feed intake in sea bass (Dicentrarchus labrax). Part I: Phenotypic relationship between residual feed intake and body weight variations
during feed deprivation and re-feeding periods. Aquaculture 300, 5058.
Herd, R.M. 2009. Residual feed intake, in Rauw, W.M., ed., Resource
allocation theory applied to farm animal production, CABI Publishing, Wallingford, 89-109.
Herd, R.M., and Arthur, P.F. 2009. Physiological basis for residual feed
intake. J. Anim. Sci. 87 E64-71.
Hopkins, K.D. 1992. Reporting fish growth: a review of the basics. J.
World Aquacult. Soc. 23, 173-179.
Jobling, M. 1995. Simple indices for the assessment of the influences of
social environment on growth performance, exemplified by studies
on Arctic charr. Aquacult. Intl. 3, 60-65.
Kolstad, K., Grisdale-Helland, B., Gjerde, B. 2004. Family differences
in feed efficiency in Atlantic salmon (Salmo salar). Aquaculture
241, 169-177.
Li, H.W., and Brocksen, R.W. 1977. Approaches to the analysis of energetic costs of intraspecific competition for space by rainbow trout
(Salmo gairdneri). J. Fish Biol. 11, 329-341.
Mambrini, M., Sanchez, M.P., Chevassus, B., Labbe, L., Quillet, E.,
and Boujard, T. 2004. Selection for growth increases feed intake and
affects feeding behavior of brown trout. Livest. Prod. Sci. 88, 85-98.
Martins, C.I.M., Schrama, J.W., and Verreth, J.A.J. 2006. The relationship between individual differences in feed efficiency and stress response in African catfish Clarias gariepinus. Aquaculture 256, 588595.
Martins, C.I.M., Schrama, J.W., and Verreth, J.A.J. 2011. Feeding behavior and stress response explain individual differences in feed efficiency in juveniles of Nile tilapia Oreochromis niloticus. Aquaculture
312, 192-197.
McCormick, S.D., Shrimpton, J.M., Carey, J.B., O’Dea, M.F., Sloan,
K.E., Moriyama, S., et al. 1998. Repeated acute stress reduces growth
rate of Atlantic salmon parr and alters levels of growth hormone,
insulin-like growth factor I and cortisol. Aquaculture 168, 221-235.
Metcalfe, N.B., Taylor, A.C., and Thorpe, J.E. 1995. Metabolic rate, social status and life-history strategies in Atlantic Salmon. Anim. Behav.
49, 431-436.
Muir, J. 2005. Managing to harvest? Perspectives on the potential of
aquaculture. Phil. Trans. R. Soc. B. 360, 191-218.
North, B.P., Ellis, T., Turnbull, J.F., Davis, J., and Bromage, N.R. 2003.
Stocking density practices of commercial UK rainbow trout farms.
Aquaculture 259, 260-267.
North, B.P., Turnbull, J.F., Ellis, T., Porter, M.J., Migaud, H., Bron, J.,
et al. 2006. The impact of stocking density on the welfare of rainbow
trout (Oncorhynchus mykiss). Aquaculture 255, 466-479.
Øverli, Ø., Sørensen, C., Kiessling, A., Pottinger, T.G., and Gjøen,
H.M. 2006. Selection for improved stress tolerance in rainbow trout
(Oncorhynchus mykiss) leads to reduced feed waste. Aquaculture
267, 776-781.
Petrell, R.J., and Jones, R.E. 2000. Power requirements of swimming in
chinook salmon and Atlantic salmon and implications for food conversion and growth performance. Aquacult. Eng. 22, 225-239.
Rauw, W.M. 2012. Feed efficiency and animal robustness, in Hill, R.A.,
ed., Feed Efficiency in the Beef Industry, Wiley Blackwell, Oxford,
105-122.
Refstie, T., and Kittelsen, A. 1976. Effect of density on growth and survival of artificially reared Atlantic salmon. Aquaculture 8, 319-326.
Ryan, W.J. 1990. Compensatory growth in cattle and sheep. Nutr. Abst.
Rev. B. Livest. Feeds Feed 60, 650-664.
Silverstein, J.T., Hostuttler, M., and Blemings, K.P. 2005. Strain differences in feed efficiency measured as residual feed intake in individually reared rainbow trout, Oncorhynchus mykiss (Walbaum). Aquac.
Res. 36, 704-711.
Sloman, K.A., Motherwell, G., O’Connor, K.K., and Taylor, A.C. 2000.
The effect of social stress on the Standard Metabolic Rate (SMR) of
brown trout, Salmo trutta. Fish Phys. Biochem. 23, 49-53.
Thorpe, J.E., and Cho, C.Y. 1995. Minimising waste through bioenergetically and behaviourally based feeding strategies. Water Sci. Technol. 31, 29-40.
Trenzado, C.E., Morales, A.E., and de la Higuera, M. 2006. Physiological effects of crowding in rainbow trout, Oncorhynchus mykiss, selected for low and high stress responsiveness. Aquaculture 258, 583593.
Zubair, A.K., and Leeson, S. 1996. Compensatory growth in the broiler
chicken: a review. World Poultry Sci. J. 52, 189-201.