Kinetics of nitrogen compounds
Bạn đang xem bản rút gọn của tài liệu. Xem và tải ngay bản đầy đủ của tài liệu tại đây (763.85 KB, 8 trang )
Aquacultural Engineering 50 (2012) 20–27
Contents lists available at SciVerse ScienceDirect
Aquacultural Engineering
journal homepage: www.elsevier.com/locate/aqua-online
Kinetics of nitrogen compounds in a commercial marine Recirculating
Aquaculture System
˜ a , P. Gómez b , A.M. Urtiaga a , I. Ortiz a,∗
V. Díaz a , R. Ibánez
a
b
Dpto. Ingeniería Química y QI. ETSIIyT, Universidad de Cantabria, Av. de los Castros s/n, 39005 Santander, Spain
APRIA Systems S.L., Polígono trascueto S/N, 39600 Camargo, Spain
a r t i c l e
i n f o
Article history:
Received 4 March 2011
Accepted 7 March 2012
Keywords:
Marine Recirculating Aquaculture System
Biological treatment
Trickling filter
Nitrification kinetics
Water quality
a b s t r a c t
This work reports the degradation of nitrogen compounds in a commercial marine Recirculating Aquaculture System (RAS) aimed at the culture of sea bream (Sparus aurata) and sea bass (Dicentrarchus labrax).
The annual production of fingerlings is around 18 million and the process includes a drum filter and a
biological treatment in order to enhance the water quality.
Ammonia measurements at the inlet of the biological system showed that the concentration of this
compound followed a diurnal pattern closely related to the feeding of the fingerlings; thus every day after
feeding around 8 am, the concentration of ammonia started increasing, it reached a maximum about 8 h
after feeding and then continued decreasing until the following morning.
With regard to nitrite concentration, no significant differences were observed between the values
measured at the inlet and the outlet of the biological system during the day, with an average concentration
of this compound ranging between 0.08 and 3.66 mg NO2 − N l−1 .
A drawback of ammonia removal by means of nitrification is the subsequent increase of nitrate as the
final product of ammonia oxidation in the culture system. The nitrate concentration in the biofilters inlet
was found to fluctuate between 22.33 and 55.44 mg NO3 − N l−1 during the characterization period. Partial
water exchange was needed during the day in order to minimize the water losses during fish handling
and to keep the concentration of nitrate below the maximum allowable level of 46 mg NO3 − N l−1 due to
production requirements in the hatchery under study.
The ammonia degradation within the biological system, obtained by the ammonia measurements and
comparison of the values at the inlet and outlet of the trickling filters has been fitted satisfactorily to ½order/0-order kinetic expressions in good agreement with the results found in literature for laboratory
and pilot plant studies. Rate constants k(1/2-order) = 0.49 g1/2 m−1/2 day−1 and k(0-order) = 0.64 g m−2 day−1 ,
have been obtained in this study for commercial trickling biofilters.
Thus, this work reports for the first time the kinetics of ammonia oxidation in trickling biofilters
installed in a commercial recirculating aquaculture marine water system. These results will provide
useful information for the design of an appropriately sized biofilter in order to optimize the water quality
and reduce the need to exchange water in this activity.
© 2012 Elsevier B.V. All rights reserved.
1. Introduction
Aquaculture is the fastest growing animal food-producing sector
of the world, with an annual growth rate of almost 10% since 1970.
This is coupled with the fact that there has been a sharp decline
in the world’s ocean captures and an increasing human population
increasing the demand for seafood. In this sense, the most common
fish species raised in fish farms are salmon, sea bass, sea bream and
rainbow trout (Crab et al., 2007; FAO, 2009).
∗ Corresponding author. Tel.: +34 942 20 15 85; fax: +34 942 20 15 91.
E-mail address: (I. Ortiz).
0144-8609/$ – see front matter © 2012 Elsevier B.V. All rights reserved.
doi:10.1016/j.aquaeng.2012.03.004
The intensive aquaculture allows a very high fish production per
unit of surface but implies two important limitations. On the one
hand, as result of fish excretion and decomposition of uneaten feed,
nitrogenous compounds (ammonia, nitrite and nitrate), organic
matter and pathogens are generated. Ammonia nitrogen is the most
critical water quality parameter in fish culture. It is mainly excreted
as the unionized form NH3 , although NH3 and NH4 + are in equilibrium in water. The relative proportion of the two forms depends
upon pH, temperature, and to a lesser extent, salinity. The sum of
the two forms, NH3 -N and NH4 + -N, called Total Ammonia Nitrogen (TAN) is often used as a key limiting water quality parameter
in intensive aquaculture systems design and operation (Lemarié
et al., 2004; Colt, 2006; Eshchar et al., 2006). Nitrite is also found as
an intermediate product in the process of nitrification of ammonia
V. Díaz et al. / Aquacultural Engineering 50 (2012) 20–27
to nitrate. Nitrate is the end product of nitrification process and it is
considered the least toxic to fish of the different inorganic nitrogen
forms; nevertheless nitrate levels usually need to be controlled by
daily water exchange (Singer et al., 2008; van Rijn et al., 2006; van
Kessel et al., 2010). Additionally, high culture intensities require
high flow rates of both recirculated and exchanged water to attain
sufficiently low waste levels in the fish tanks (Sandu et al., 2008).
Interest in recirculating aquaculture technology is growing worldwide for high value fish species due to limitations of existing water
supplies and land availability constraints, the desire for increased
systems carrying capacity, the control over the fish rearing, reduction of heat loss and reduction of waste effluent stream volumes
(Losordo and Hobbs, 2000; Martins et al., 2010).
Recirculating Aquaculture Systems (RAS) are emerging as the
preferred technology to provide adequate culture water quality in
hatchery activities. RAS are typically assembled by several rearing
tanks and treatment operations such as solids removal, ammonia
removal/conversion and aeration/oxygenation/CO2 degassing and
water exchange in order to maintain the water quality for fish rearing. In such systems ammonia is mostly oxidized into nitrite and
nitrate through nitrification in biological filters by means of the bacteria, Nitrosomonas and Nitrobacter (Chen et al., 2006; Itoi et al.,
2007). Different types of biofilters are described in literature (Crab
et al., 2007). Trickling filters, in which water flows down through a
stationary filter media by gravity, are attractive biofilters for application in fish culture. They present TAN removal rates ranging from
0.1 to 0.9 g m−2 day−1 (Eding et al., 2006) and several advantages
like low costs of construction, operation and maintenance, robust
operating meaning a greater tolerance of differences in hydraulic
and organic loads, the ability to maintain high and constant oxygen levels and the removal of carbon dioxide produced by the fish.
Additionally, the biofilm is stripped easily from the falling water if
hydraulic loading rates are adequate (Lekang and Kleppe, 2000).
Nevertheless there is limited information on the impact of
salinity on nitrification. Several authors have pointed that average removal rate is reduced in salt water compared to freshwater.
Chen et al. (2006) reported that many engineering companies and
pilot scale long term experiments with fresh and marine water
recirculation systems suggest that the average removal rate is
reduced by approximately 37% in salt water compared to freshwater. Rusten et al. (2006) reported that data from commercial
fish farms operating at a salinity of 21,000–24,000 mg l−1 , indicated
that the nitrification rate was approximately 60% of what would
be expected in a freshwater system for moving bed bioreactors.
These authors have observed that it takes significantly longer to
fully acclimatize a biofilter in salt water than in freshwater. Abrupt
changes in salinity of greater than 5 g l−1 , will shock nitrifying bacteria and decrease the reaction rate for both ammonia-nitrogen
and nitrite-nitrogen removal. Moreover, this assumption was reinforced since the amount of un-ionized ammonia increases with pH
and water temperature. As a result, higher levels of toxic un-ionized
ammonia are found in salt water systems where the standard pH
is 8.0. This means that greater attention to biological filter design
and efficiency is required for saltwater systems than for freshwater
systems that typically operate at pH near 7.0.
Due to the limited and uncertain information in literature about
the potential of nitrification in marine systems, this work is aimed
at the contribution to a better understanding of commercial saline
trickling filters, installed in a marine hatchery located in the north
of Spain, devoted to sea bream and sea bass culture, in order to
improve the water quality of the fish farm. A characterization of
the trickling filters system installed in the fish farm was assessed by
comparing physical, chemical and microbiological properties of the
seawater collected at the inlet and outlet of the biological system.
The nitrification kinetics and the values of the rate constants of
ammonia oxidation have been obtained by means of the analysis
21
Table 1
Technical characteristics of the biological system.
Technical characteristic
Value
Volume (m3 )
Flow rate (m3 h−1 )
Specific surface area (m2 m−3 )
200
416–600
>160
of the conversion of ammonia nitrogen to nitrate nitrogen within
the biofilters. The results obtained will help to a better design and
performance of the commercial trickling filters under study.
2. Materials and methods
2.1. Description of the commercial Recirculating Aquaculture
System under study
The Recirculating Aquaculture System under study is located in
Cantabria (Northern coast of Spain). Sea bream (Sparus aurata) and
sea bass (Dicentrarchus labrax) are cultured in this hatchery. The
annual production of fingerlings is approximately 18 million. The
RAS is comprised of 40 rearing tanks of 5 m3 each and 8 raceways of
20 m3 each and a centralized water treatment system. Each rearing
unit includes an airlift pump system for water circulation in order
to provide adequate rearing conditions.
Seawater coming from the fish tanks is filtered through a
rotating drum screen filter with 40 m screen mesh size (model
HDF1604-1H from Hydrotech) which removes suspended solids.
The water flows to a pumping sump. The automatic backwash of
the drum filter is activated over the day every few minutes and
an additional cleaning with high pressure water jets is carried out
weekly to improve the system performance. The process water is
pumped to biological treatment, collected and then pumped again
back to the tanks with a second pump. Oxygen contactors add pure
oxygen to the fish tanks.
The biological treatment consists of 3 circular nitrifying trickling filters (NTF), with a total volume of 200 m3 (two of them with
a volume of 50 m3 and the third, of 100 m3 ), filled with a crossflow plastic media of propylene, with a specific surface area of
160 m2 m−3 , spherical shape and rough surface (ADJ Serveis Tècnics, S.L.). Technical characteristics of the biological treatment are
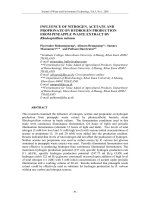
presented in Table 1 and a basic layout of the Recirculating Aquaculture System under study is shown in Fig. 1.
The total rearing tanks volume used during this study varied from 260 to 375 m3 . The recirculating system provided up to
2 complete turnovers of the water per hour, depending on the
waste load. Therefore, the water flow rate varied between 520 and
750 m3 h−1 and the flow rate to the biological system was 80% of
the total, so the flow rate to the biofilters was between 416 and
600 m3 h−1 . The water exchange rate, calculated by the differences
in the meter readings during the sampling periods, ranged from 39
to 189 m3 day−1 .
A biomass of 5000–10,640 kg of sea bream fingerlings was
grown in the fish tanks and the feed load covered a range from
140 to 505 kg per day. The daily feed ratio varied from 2.1 to 3.4% at
the beginning of the sampling period and from 5.5 to 5.7% during
the last two months.
Fish were fed by means of automatic feeders, which were
filled with the corresponding amount of feed between 7 and 8 am.
These devices distributed uniformly the feed into the tank every
10–15 min during approximately 8 h.
2.2. Analytical procedure
Water quality in the Recirculating Aquaculture System was
studied during the period December 2008 to April 2009. The
22
V. Díaz et al. / Aquacultural Engineering 50 (2012) 20–27
Table 2
Water parameters at the inlet and outlet of the biological system.
Parameter
pH
Temperature
Conductivity
Turbidity
Salinity
TAN
Nitrite
Nitrate
Phosphate
Chloride
COD
TOC
BOD5
O2
CO2
Vibrio sp.
Total bacteria plate count
Units
(◦ C)
(mS cm−1 )
(NTU)
(mg l−1 )
(mg N l−1 )
(mg N l−1 )
(mg N l−1 )
(mg P l−1 )
(mg l−1 )
(mg O2 l−1 )
(mg l−1 )
(mg l−1 )
(mg l−1 )
(mg l−1 )
(CFUs ml−1 )
(CFUs ml−1 )
Inlet biofilter
Outlet biofilter
Min.
Max.
Min.
Max.
6.51
16.3
33.30
0.81
29,800
0.06
0.10
22.33
2.40
16,493.07
6.00
7.32
12.00
5.07
1.00
1,800
111,000
7.31
28.0
51.10
2.40
32,200
6.56
3.37
55.44
4.99
17,822.71
43.00
10.00
16.00
6.94
9.00
32,000
590,000
6.94
17.0
47.50
0.84
29,800
0.13
0.08
25.10
2.70
16,493.07
6.00
8.16
8.00
3.77
1.00
1,000
56,000
7.57
28.0
51.30
1.16
32,200
4.64
3.66
62.77
4.80
17,822.71
35.00
9.26
12.00
5.91
4.00
6,000
106,000
alkalinity, pH, salinity and the concentrations of nitrate, nitrite,
Total Ammonia Nitrogen, chloride, phosphate, organic matter and
dissolved oxygen were measured in samples collected at regular
time intervals of 60 min, from the inlet and outlet of the biological
system as indicated in Fig. 1. Table 2 lists the physicochemical and
microbiological parameters registered in the seawater samples collected every hour at the inlet and outlet of the biological treatment
in a sampling protocol carried out over 8 h periods and extended
over 25 days. Additionally, TAN and nitrite were measured at the
inlet and outlet of the trickling filters every 2 h over time periods
of 24 h.
The pH was measured with a Crison pH 25 pH meter and the
conductivity and the salinity were measured with a Crison CM 35
conductivity meter. The turbidity was determined in a Turbiquant
3000 IR (Merck).
TCOD was determined by heat of dilution COD procedure
(Ruttanagosrigit and Boyd, 1989) employing mercuric sulfate to
remove chloride interference. Analysis of the TOC was performed
using a TOC-V CHP Shimadzu analyzer. For the evaluation of BOD5
the WTW OxiTop® measuring system (Weilheim, Germany) thermostated at 20 ◦ C was used. The measure was done following the
Standard Methods 5210D procedures (APHA, 1998).
The concentration of TAN, nitrite, nitrate, chloride and phosphate in solution was measured spectrophotometrically by using a
Spectroquant® Pharo 100, (Merck Company) according to Standard
Methods (APHA, 1998): 4500-NH3 -D, 4500-NO2 -B, 4500-NO3 -B,
4500-Cl-E and 4500-PE, respectively.
Oxygen and carbon dioxide concentration was measured using
a HACH Sension 6 probe and an Oxyguard probe GO2P CO2 , respectively. Sulfate was measured using ion chromatography (Dionex
120 IC, with an IonPac AS9-HC Column).
Analysis of bacterial levels (Vibrio ssp. and total bacteria) was
also performed. Counts of colony forming units (CFU) were done
by the total plate count method and the number of Vibrio spp. was
counted using thiosulfate–citrate–bile salts–sucrose (TCBS) agar.
All analytical determinations were performed immediately after
sampling and were done by replicate.
3. Results
According to Colt et al. (2006), the performance of a biofilter
is difficult to analyze due to the large number of parameters that
must be controlled and the number of measurements that must
be carried out. The most important water quality parameters in
Fig. 1. Scheme of the Recirculating Aquaculture System under study (X represents the sampling points).
15
2.00
1.50
Feed
Time
1.00
10
5
0.50
0
0.00
(mg NH4+-N l -1)
2.50
Ammonia concentration
20
3.00
Water intake volume (m3)
25
3.50
(mg NH4+-N l-1)
Ammonia concentration
4.00
23
1.40
12000
1.20
10000
1.00
8000
0.80
6000
0.60
4000
0.40
0.20
2000
0.00
0
Biomass (kg of fish)
V. Díaz et al. / Aquacultural Engineering 50 (2012) 20–27
Sampling hour
4.00
1.20
3.50
3.00
1.00
2.50
0.80
2.00
0.60
1.50
0.40
1.00
0.20
0.50
0.00
0.00
-1
1.40
TAN concentration at the inlet (mg l )
(g NH 4+-N m-2 d-1)
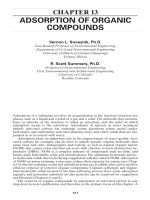
Fig. 3. The daily fish biomass ( ) and the ammonia concentration at the inlet of the
trickling filters (᭹) over a 10-days period. Samples were taken at 4 pm everyday.
Ammonia removal rate
Sampling hour
Fig. 4. Variation of TAN removal rate ( ) through the trickling filters and the TAN
concentration at the inlet (᭹) of the biofilters over a 24-h period starting at 2 pm.
Organic matter in the RAS systems has been evaluated by means
of BOD5 , relatively low BOD5 concentrations (8.00–16.00 mg l−1 )
were measured during the sampling periods in the RAS under study
due to the relatively high new water exchange rate as will be
discussed in the next section. Similar values of BOD5 have been
reported in the works of Krüner and Rosenthal (1983). Chemical
Oxygen Demand (COD) was also measured, being the average COD
concentration at the inflow and outflow of the biofilters 30.50 and
25.86 mg l−1 , respectively. No statistically significant COD differences were observed between both streams. Concentration of total
25
3.00
2.50
20
2.00
15
1.50
10
1.00
Feed
Time
5
0.50
0.00
Water intake volume (m 3)
aquaculture activities are temperature, salinity, pH, dissolved oxygen, ammonia (NH3 ), nitrite (NO2 − ) and nitrate (NO3 − ). In open
systems, only temperature and salinity are likely to fluctuate
rapidly, whereas in closed systems, the rest of parameters are more
likely to vary. The maintenance of water quality parameters is
essential to avoid adverse conditions which could affect the growth
and survival of the fish.
The performance of the commercial saline RAS under study has
been deeply evaluated by means of the main quality parameters
according to the procedures and analytical methods previously
described. The results of the physico-chemical characteristics of
the water under study for the whole characterization period are
summarized in Table 2 where the maximum and minimum values
reached both at the inlet and outlet of the biological system for each
measured parameter are indicated.
Values of TAN concentration at the inlet and outlet of the biological treatment shown in Table 2 indicate a concentration range
from 0.06 to 6.56 mg N l−1 . The TAN concentration at the inlet and
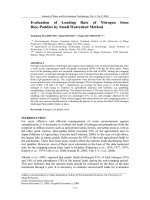
outlet of the biological system over 24 h is depicted in Fig. 2. The
pattern shown in this figure can be better understood taking into
account that fish were fed by means of automatic feeders, which
were filled with the corresponding amount of feed between 7:00
and 8:00 am. These devices distributed uniformly the feed into
the tanks every 10–15 min during approximately 8 h. The water
renewal requirement within the Recirculating Aquaculture System
over a 24 h period is also depicted in Fig. 2, the close relationship between TAN concentration and water renewal can be easily
observed.
The relationship between fish biomass and the ammonia concentration measured at the inlet to the biofilters is shown in Fig. 3;
the concentration of TAN measured along a period of 10 days, sampling at a fixed time (4:00 pm) is represented together with the
corresponding fish biomass level. The values of TAN removal rate
through the biological system over a period of 24 h are shown in
Fig. 4.
Regarding nitrite, influent concentrations in the range 0.10–3.37
were found during the sampling period. Fig. 5 shows the nitrite concentration measured in the water samples collected at the inlet and
outlet of the trickling filters system over 24 h. The apparent conversion efficiency of NO2 -N to nitrate nitrogen, NO3 -N, in the biological
system was calculated obtaining an average value of 19.5% on a single pass through the filters during the night. Nitrate concentrations
in the biofilters effluent varied in the range 25.10–62.77 mg l−1 .
The RAS under study required important water exchange in order
to control the nitrate concentration, consequently, the operational
costs increased. Figs. 2 and 5 show the volume of water exchange
that was needed in the RAS under study in order to enhance the
water quality.
Date
Nitrite concentration
(mg NO2--N l -1)
Fig. 2. Ammonia concentration at the inlet (᭹) and the outlet ( ) of the trickling
filters system over a 24-h period starting at 2 pm. The water renewal volume in the
system is represented in bars form.
0
Sampling hour
Fig. 5. Nitrite concentration at the inlet ( ) and the outlet ( ) of the trickling filters
system over a 24-h period starting at 2 pm. The water renewal volume in the system
is represented in bars form.
24
V. Díaz et al. / Aquacultural Engineering 50 (2012) 20–27
0.90
Ammonia removal rate
(g NH4+-N m-2 d-1)
0.80
0.70
0.60
0.50
0.40
0.30
0.20
0.10
0.00
0.00
1.00
2.00
3.00
4.00
NH4-N concentration (g
5.00
6.00
7.00
m -3)
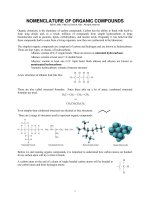
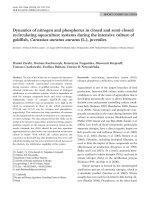
Fig. 6. Predicted and observed ammonia removal rates as a function of the ammonia influent concentration (solid circles are observed data and solid line represents
predicted data) using the ½-order/0-order model described by equations: rTAN =
−1
−1
0.5
− 0.24 [g NH4 + -N m−2 d ] and rTAN = 0.64 [g NH4 + -N m−2 d ].
0.49 · CTAN
bacteria and Vibrio sp. reported in Table 2 guarantee the culture
water quality.
The nitrification performance of a biofilter is usually reported
in literature as surface specific TAN removal or volumetric TAN
removal rate. Nitrification rates in granular media are much more
closely related to volume of media than surface area provided by
the media. In the present work, the nitrification rate has been
calculated in terms of Volumetric TAN Removal (VTR), using the
equation 1:
VTR =
([NH4 + -N]in − [NH4 + -N]out ) · Q
Vmedia
(1)
where VTR is the amount of TAN removed per m3 of filter media
per day; [NH4 -N]in and [NH4 -N]out are the ammonia concentration
measured at the inlet and the outlet of the trickling filters system
(g m−3 ), respectively; Q is the flow rate through the filters (m3 d−1 )
and Vmedia is the volume of the filter media (m3 ).
Fig. 6 shows the ammonia removal rate values related to the
inlet ammonia concentrations to the biological system. The values
of Volumetric TAN Removal calculated by means of equation 1 have
been converted into surface TAN removal rate values, using the
specific surface area of the media (160 m2 m−3 ) in order to compare
the kinetics of the present work with values found in literature.
As shown in Fig. 6 the ammonia removal rate increases with inlet
ammonia concentration up to a maximum inlet concentration of
3.50 g m−3 . For higher inlet concentrations the ammonia removal
rate is constant and independent of the inlet concentration.
4. Discussion
The data reported in previous sections contain relevant information for the complete description of the behavior of a commercial
saline water treatment by means of trickling biofilters. In this
section this information will be discussed and the most relevant
conclusions aimed to the better design and performance of the
biofilters will be remarked.
The pattern of ammonia concentration in the biofilters influent can be concluded from Figs. 2 and 3. As shown in Fig. 2,
the ammonia levels in the system under study fluctuate with a
factor of 4–5 over 24 h. The concentration of ammonia in the
system increased rapidly after the feeding began reaching a maximum value approximately 8 h after feeding, then it decreased,
defining a cyclic pattern until the following feeding. Each diurnal
cycle showed a unique maximum concentration as fish were fed
only once a day. Similar postprandial ammonia excretion patterns
have been reported in literature (Dosdat et al., 1996; Robaina et al.,
1999; Gómez-Requeni et al., 2003). As shown in Fig. 2, changes
in the ammonia concentration in the influent are closely reflected
in the effluent concentration of the biofilters. Additionally according to Fig. 3, TAN concentration fluctuates slightly in the range
0.86–1.28 mg l−1 over the experimental period, according to the
increase of fish biomass (5480–9290 kg of sea bream fingerlings),
thus indicating that the higher the fish biomass cultured in the system is, the higher is the ammonia concentration. Fluctuations in
the assimilation of ingested feed and therefore of waste production
over time could alter this relationship. Fig. 4 shows that the TAN
removal rate through the biological treatment increased with the
TAN inlet concentration to the biofilters. The calculated TAN mean
removal efficiency in one pass through the biofilters was 58.3% with
respect to the influent concentration.
The pattern of nitrite concentration in the effluent is closely
related to the Ammonia presence. As shown in Fig. 5, the nitrite
concentration in the system increased rapidly just after feeding at
8:00 am, it reached a maximum and then started decreased until the
following morning. This profile is identical to the ammonia pattern
shown in Fig. 2, as nitrite is constantly formed as an intermediate
compound during the biological oxidation of ammonia to nitrate.
Although nitrite is usually converted to nitrate as quickly as it is
produced, lack of biological oxidation of the nitrite will result in
elevated nitrite levels that can be toxic to the fish. However, in seawater, the toxicity due to NO2 -N is greatly reduced by the presence
of the chlorine ion.
As shown in Fig. 5, no significant differences in nitrite concentration were observed between the inlet and outlet of the biological
system, although the concentration at the outlet of the biofilters
was slightly higher than its concentration at the inlet in the data
measured from 8:00 am to 10:00 pm due to the oxidation of ammonia within the biofilters. However during the night, as the ammonia
concentration decreases the nitrite produced is lower, and the nitrifying bacteria are able to oxidize the existing nitrite to nitrate.
Consequently, the outlet of the biofilters has a lower level of nitrite
concentration than the inlet. van Rijn and Rivera (1990) found that
nitrite removal by a trickling filter took place when ambient ammonia concentrations were lower than 1.0 mg NH4 -N l−1 , while at
higher ambient ammonia concentrations, nitrite was accumulated.
According to Figs. 2 and 5, the nitrate concentration was found
to fluctuate during the day between 22.33 and 62.77 mg NO3 -N l−1 ,
being a concentration of 50 mg NO3 -N l−1 generally accepted as a
safe limit for nitrate nitrogen in fish culture, but this concentration varies widely for different species and development stages
(Gutierrez-Wing and Malone, 2006). Furthermore, water exchange
also allowed the proper dilution of TAN and NO2 –N concentrations.
As shown in Figs. 2 and 5 the water renewal was not constant over
the day. It varied according to the fluctuations of the concentration
of nitrogen compounds over the day: at night the volume of water
exchange was very low or even zero as the level of pollutants was
low but higher renewal rate was required during daylight hours.
The trickling filters system is not able to maintain TAN and
Nitrate below the required quality levels during the whole day.
Water renewal is required to accomplish these requirements.
The water exchange rate during the sampling periods ranged
from 39 to 189 m3 day−1 , corresponding to a daily water renewal
volume from 0.55 to 1.06 m3 kg−1 feed. These values are very
similar to those found in the work of Blancheton et al. (2007) for
commercial recirculating systems with sea bass production. As
shown in Figs. 2 and 5 the water renewal was not constant over
the day. It varied according to the fluctuations of the concentration
of nitrogen compounds over the day: at night the volume of water
V. Díaz et al. / Aquacultural Engineering 50 (2012) 20–27
25
Table 3
Comparative of ½-order/0-order ammonia removal kinetics in trickling filters.
½-order ammonia
removal rate
(g NH4 -N m−2 d−1 )
0-order ammonia
removal rate
(g NH4 -N m−2 d−1 )
Transition
∗
concentration, CTAN
(g NH4 -N m−3 )
Water treated
Trickling filter scale
Reference
0.5
0.49 · CTAN
− 0.24
0.64
3.2
Seawater
Commercial
Present work
0.5
0.23 · CTAN
− 0.11
0.28
3.0
Seawater
Laboratory
Nijhof and Bovendeur (1990)
0.5
0.55 · CTAN
− 0.11
0.69
2.2
Freshwater
Pilot-scale
Nijhof (1995)
0.5
0.76 · CTAN
− 0.10
0.98
2.0
Freshwater
Commercial
Kamstra et al. (1998)
0.5
0.47 · CTAN
− 0.10
0.57
2.0
Freshwater
Commercial
Kamstra et al. (1998)
0.5
0.32 · CTAN
− 0.10
0.35
2.0
Freshwater
Commercial
Kamstra et al. (1998)
exchange was very low or even zero as the level of pollutants was
low but higher renewal rate was required at daylight hours. This
value corresponded to a daily water renewal volume of 40% in
relation to the total volume of the rearing tanks. This percentage
indicates that the amount of water exchange needed in this system
is too high and therefore the treatment system was not correctly
sized for the feed rate used in this RAS.
Organic matter is an essential parameter to be controlled in a
RAS. The organics are the result of the fecal material excreted by fish
and uneaten feed. Several authors (Zhu and Chen, 2001; Leonard
et al., 2002; Ling and Chen, 2005; Chen et al., 2006; Michaud et al.,
2006) have reported the importance of organics removal from RAS
as quick as possible to avoid the inhibition of the nitrification process due to the competition between autotrophic nitrifying bacteria
and heterotrophic bacteria. As heterotrophic bacteria have a maximum growth rate of five times and cell yields of two to three times
that of autotrophic nitrifying bacteria (Ling and Chen, 2005), the
ammonia removal rate will decrease as organic loading increases.
Values of DBO5 and COD have been reported in Section 3. The low
DBO5 values registered guarantee that the nitrification process is
not inhibited in the system, as DBO5 values higher than 30 mg l−1
are needed according to Chen et al. (2006). The biodegradability
index, calculated as the BOD5 /COD ratio, ranged between 0.23 and
0.38 in the influent of the biological treatment. Similar biodegradability indexes (BOD5 /COD = 0.24–0.29) were found in the work of
Sandu et al. (2008) in the inlet of the biological filter of a commercial aquaculture system. Low biodegradability appears to be
common in Recirculating Aquaculture System water, probably due
to the fact that the bacteria in the system usually have long time
to degrade the organic material and thus a relatively big amount of
non-biologically degradable material remains in the system.
Although significant research efforts on bio-filtration in Recirculating Aquaculture Systems have been made, useful information
relative to nitrification kinetics is still lacking. Comparative studies
(Crab et al., 2007; Guerdat et al., 2010) have shown that rotating
biological contactors (RBCs), submerged, trickling, or fluidized bed
filters all have different performance in terms of TAN removal. Nitrification kinetics vary among filter types due to differences in design
and management strategies of the biofilters (Ling and Chen, 2005).
According to literature (Eding et al., 2006), the substrates
removal rate in a trickling filter is determined by their diffusional
rates into the biofilm. Substrates first diffuse from the bulk liquid
into the biofilm through a stagnant water layer and then into the
biofilm. Once in the biofilm, the substrate is consumed by bacteria. The nitrification rate in the biofilm depends on external factors
(e.g., temperature, salinity, pH or bulk phase concentrations of TAN,
O2 , COD and nitrite) or internal properties (e.g., biofilm thickness,
abundance of nitrifying bacteria, or hydraulic surface loading rate).
In the context of commercial aquaculture saline water systems, the nitrification kinetics of seawater in trickling filters
has not yet received much attention. In this work experimental data from the commercial aquaculture saline tickling filters
plotted in Fig. 6 have been successfully fitted to a ½-order/0order model, plotted in Fig. 6 by a solid line. Consequently, the
nitrification kinetics of the trickling filters system under study
can be described by Eqs. (2) and (3) obtaining the following values of the kinetic constants: k(1/2-order) = 0.49 g1/2 m−1/2 day−1 and
k(0-order) = 0.64 g m−2 day−1 . The nitrification capacity of the biological treatment will not increase for ammonia levels higher than
3.2 g m−3 , since at that level the whole filter column is operat∗ , for this
ing under 0-order conditions. Therefore, the value of CTAN
−3
commercial system is 3.2 g m .
0.5
rTAN = 0.49 · CTAN
− 0.24 [g NH4 + -N m−2 d−1 ]
rTAN = 0.64 [g NH4 + -N m−2 d
−1
(2)
]
(3)
∗
CTAN
= 3.2 g NH4 + -N m−3
(4)
+ -N m2
day−1 ); CTAN
where rTAN is the ammonia removal rate (g NH4
∗
is the nitrogen ammonia concentration (g m−3 ) and CTAN
is the transition concentration from ½-order to 0-order. This value depends
on the oxygen concentration and the metabolic constraints of the
nitrifying bacteria and it is an important parameter in the biofil∗
ter performance, since a low CTAN
value can be an indication of low
oxygen levels in the biofilter or high COD loads reducing the 0-order
TAN removal rate value (Eding et al., 2006).
The weighted standard deviation, defined by Eq. (5) was
calculated as w = 0.077, thus certifying that the proposed ½order/0-order model describes satisfactorily well the kinetic data
of TAN removal.
w
=
n
((Cexp
i=1
− Csim )/Cexp )
N−1
2
(5)
It should be emphasized that the ammonia removal rates shown
in Fig. 6 do not represent the complete nitrification rate to nitrate
but only ammonia oxidation rates under the environmental conditions given in the hatchery during the sampling period: The water
temperature during the study ranged from 16.3 to 28.0 ◦ C, with an
average value of 21.5 ◦ C, which was within the acceptable range for
sea bass and sea bream culture.
The nitrification kinetic model developed in the present work
constitutes a useful tool in the design of biofilters for marine RAS
applications. Previous works reported in literature used similar ½order/0-order models for the description of laboratory or pilot plant
saline biofilters (Bovendeur et al., 1987; Nijhof, 1995). Kamstra
et al. (1998) validated the ½-order/0-order kinetic model for a wide
range of freshwater commercial biofilters. The results described in
this work validate this nitrification kinetic model in a saline commercial biological system.
Table 3 summarizes the values of ammonia removal rates calculated with the ½-order/0-order kinetic equations in the trickling
filters operating at different conditions. As shown in Table 3, the
maximum nitrification capacity is lower in seawater systems than
in freshwater systems, this has been attributed either to the fact
26
V. Díaz et al. / Aquacultural Engineering 50 (2012) 20–27
that saltwater biofilters need a much longer start-up period than
freshwater systems and also to the inhibiting effect of chloride on
nitrification kinetics (Nijhof and Bovendeur, 1990; Campos et al.,
∗ , is
2002; Rusten et al., 2006). The transition concentration, CTAN
somewhat higher in seawater biofilters than in freshwater trickling
filters. The maximum value of the ammonia removal rate found in
the biological system under study was 0.64 g NH4 -N m−2 d−1 . This
value is higher than the value of 0.28 g NH4 -N m−2 d−1 reported by
Nijhof and Bovendeur (1990), working both biofilters with seawa∗
ter from RAS systems. The value of CTAN
obtained in our study is
−3
3.2 g m and it is very close to the corresponding value already
reported by Nijhof and Bovendeur (1990).
5. Conclusions
This work evaluates the performance of a commercial Recirculating Aquaculture System provided with a biological treatment
based on the determination and comparison of physical, chemical
and microbiological properties of the seawater samples withdrawn
from the inlet and outlet streams to the biofilters. Additionally
the kinetics of ammonia nitrification in the biological treatment
have been determined. The main conclusions of this work can be
summarized as:
• Ammonia concentration increased rapidly after feeding reaching
concentration above the quality requirements in the hatchery,
but decreased over the night as there was not feed in the rearing
tanks.
• No significant differences were observed between the nitrite concentration measured at the inlet and outlet of the biofilters during
the day, ranging its concentration between 0.08 and 3.66 mg NO2 N l−1 . Nitrate concentration was directly controlled by daily water
exchange and the water renewal volume ranged between 10.7
and 59% of the rearing tanks volume. Low values of the biodegradability index, ranging from 0.23 to 0.38 were calculated in the
influent of the biofilters.
• The kinetics of ammonia nitrification within the biological system were fitted to ½-order/0-order expressions. The values of
the kinetic constants were: k(1/2-order) = 0.49 g1/2 m−1/2 day−1 and
k(0-order) = 0.64 g m−2 day−1 . A transition concentration from ½∗
of 3.2 g NH4 + -N m−3 has been obtained for
order to 0-order, CTAN
the commercial trickling filters system under study.
• An appropriate design of the biological treatment is essential in
order to maximize the TAN removal rate, maximize the water
reuse, minimize the impact of TAN on the fish cultured and minimize the need to exchange water. The nitrifying capacity of a
biofilter is largely determined by the used biofilter media, the volume of the filter, the ammonia loading and the hydraulic loading.
Acknowledgements
Financial support of projects CTQ2008-03225/PPQ, CTQ200800690/PPQ, Consolider CSD 2006-44 (Spanish Ministry of Science
and Innovation (MICINN)), 080/RN08/03.2 (Spanish MARM) and
18-04-2007 (SODERCAN, Cantabria Government) are gratefully
acknowledged. The collaboration of Tinamenor S.L. is also acknowledged. V. Díaz also thanks the MICINN for a FPI research grant.
References
APHA, 1998. Standard Methods for Examination of Water and Wastewater, twentieth ed. American Public Health Association, Washington, DC.
Blancheton, J.P., Piedrahita, R., Eding, E.H., Roque d’Orbcastel, E., Lemarié, G.,
Bergheim, A., Fivelstad, S., 2007. Intensification of landbased aquaculture production in single pass and reuse systems. In: Aquaculture Engineering and
Environment (Chapter 2).
Bovendeur, J., Eding, E.H., Henken, A.M., 1987. Design and performance of a water
recirculation system for high-density culture of the african catfish, clarias
gariepinus (burchell 1822). Aquaculture 63, 329–353.
Campos, J.L., Mosquera-Corral, A., Sánchez, M., Méndez, R., Lema, J.M., 2002. Nitrification in saline wastewater with high ammonia concentration in an activated
sludge unit. Water Res. 36, 2555–2560.
Chen, S., Ling, J., Blancheton, J.-., 2006. Nitrification kinetics of biofilm as affected by
water quality factors. Aquacult. Eng. 34, 179–197.
Colt, J., 2006. Water quality requirements for reuse systems. Aquacult. Eng. 34,
143–156.
Colt, J., Lamoureux, J., Patterson, R., Rogers, G., 2006. Reporting standards for biofilter
performance studies. Aquacult. Eng. 34, 377–388.
Crab, R., Avnimelech, Y., Defoirdt, T., Bossier, P., Verstraete, W., 2007. Nitrogen
removal techniques in aquaculture for a sustainable production. Aquaculture
270, 1–14.
Dosdat, A., Servais, F., Métailler, R., Huelvan, C., Desbruyères, E., 1996. Comparison
of nitrogenous losses in five teleost fish species. Aquaculture 141, 107–127.
Eding, E.H., Kamstra, A., Verreth, J.A.J., Huisman, E.A., Klapwijk, A., 2006. Design and
operation of nitrifying trickling filters in recirculating aquaculture: a review.
Aquacult. Eng. 34, 234–260.
Eshchar, M., Lahav, O., Mozes, N., Peduel, A., Ron, B., 2006. Intensive fish culture at
high ammonium and low pH. Aquaculture 255, 301–313.
FAO, 2009. The State of World Fisheries and Aquaculture 2008. Food and Agriculture
Organization of the United Nations, Rome, Italy.
Gómez-Requeni, P., Mingarro, M., Kirchner, S., Calduch-Giner, J.A., Médale, F., Corraze, G., Panserat, S., Martin, S.A.M., Houlihan, D.F., Kaushik, S.J., Pérez-Sánchez,
J., 2003. Effects of dietary amino acid profile on growth performance, key
metabolic enzymes and somatotropic axis responsiveness of gilthead sea bream
(Sparus aurata). Aquaculture 220, 749–767.
Guerdat, T.C., Losordo, T.M., Classen, J.J., Osborne, J.A., DeLong, D.P., 2010. An evaluation of commercially available biological filters for recirculating aquaculture
systems. Aquacult. Eng. 42, 38–49.
Gutierrez-Wing, M.T., Malone, R.F., 2006. Biological filters in aquaculture. Trends
and research directions for freshwater and marine applications. Aquacult. Eng.
34, 163–171.
Itoi, S., Ebihara, N., Washio, S., Sugita, H., 2007. Nitrite-oxidizing bacteria, nitrospira, distribution in the outer layer of the biofilm from filter materials of a
recirculating water system for the goldfish Carassius auratus. Aquaculture 264,
297–308.
Kamstra, A., van der Heul, J.W., Nijhof, M., 1998. Performance and optimisation of
trickling filters on eel farms. Aquacult. Eng. 17, 175–192.
Krüner, G., Rosenthal, H., 1983. Efficiency of nitrification in trickling filters using
different substrates. Aquacult. Eng. 2, 49–67.
Lekang, O.-., Kleppe, H., 2000. Efficiency of nitrification in trickling filters using
different filter media. Aquacult. Eng. 21, 181–199.
Lemarié, G., Dosdat, A., Covès, D., Dutto, G., Gasset, E., Person-Le Ruyet, J., 2004. Effect
of chronic ammonia exposure on growth of European seabass (Dicentrarchus
labrax) juveniles. Aquaculture 229, 479–491.
Leonard, N., Guiraud, J.P., Gasset, E., Cailleres, J.P., Blancheton, J.P., 2002. Bacteria
and nutrients – nitrogen and carbon – in a recirculating system for sea bass
production. Aquacult. Eng. 26, 111–127.
Ling, J., Chen, S., 2005. Impact of organic carbon on nitrification performance of
different biofilters. Aquacult. Eng. 33, 150–162.
Losordo, T.M., Hobbs, A.O., 2000. Using computer spreadsheets for water flow and
biofilter sizing in recirculating aquaculture production systems. Aquacult. Eng.
23, 95–102.
Martins, C.I.M., Eding, E.H., Verdegem, M.C.J., Heinsbroek, L.T.N., Schneider, O.,
Blancheton, J.P., d’Orbcastel, E.R., Verreth, J.A.J., 2010. New developments in
recirculating aquaculture systems in Europe: a perspective on environmental
sustainability. Aquacult. Eng. 43, 83–93.
Michaud, L., Blancheton, J.P., Bruni, V., Piedrahita, R., 2006. Effect of particulate
organic carbon on heterotrophic bacterial populations and nitrification efficiency in biological filters. Aquacult. Eng. 34, 224–233.
Nijhof, M., 1995. Bacterial stratification and hydraulic loading effects in a plug-flow
model for nitrifying trickling filters applied in recirculating fish culture systems.
Aquaculture 134, 49–64.
Nijhof, M., Bovendeur, J., 1990. Fixed film nitrification characteristics in sea-water
recirculation fish culture systems. Aquaculture 87, 133–143.
Robaina, L., Corraze, G., Aguirre, P., Blanc, D., Melcion, J.P., Kaushik, S., 1999.
Digestibility, postprandial ammonia excretion and selected plasma metabolites
in European sea bass (Dicentrarchus labrax) fed pelleted or extruded diets with
or without wheat gluten. Aquaculture 179, 45–56.
Rusten, B., Eikebrokk, B., Ulgenes, Y., Lygren, E., 2006. Design and operations of the
Kaldnes moving bed biofilm reactors. Aquacult. Eng. 34, 322–331.
Ruttanagosrigit, W., Boyd, C.E., 1989. Measurement of chemical oxygen demand in
waters of high chloride concentration. J. Aquacult. Soc. 20, 170–172.
Sandu, S., Brazil, B., Hallerman, E., 2008. Efficacy of a pilot-scale wastewater treatment plant upon a commercial aquaculture effluent. I. Solids and carbonaceous
compounds. Aquacult. Eng. 39, 78–90.
Singer, A., Parnes, S., Gross, A., Sagi, A., Brenner, A., 2008. A novel approach to denitrification processes in a zero-discharge recirculating system for small-scale urban
aquaculture. Aquacult. Eng. 39, 72–77.
van Kessel, M.A.H.J., Harhangi, H.R., van de Pas-Schoonen, K., van de Vossenberg, J.,
Flik, G., Jetten, M.S.M., Klaren, P.H.M., Op den Camp, H.J.M., 2010. Biodiversity
of N-cycle bacteria in nitrogen removing moving bed biofilters for freshwater
recirculating aquaculture systems. Aquaculture 306, 177–184.
van Rijn, J., Rivera, G., 1990. Aerobic and anaerobic biofiltration in an aquaculture
unit-nitrite accumulation as a result of nitrification and denitrification. Aquacult.
Eng. 9, 217–234.
V. Díaz et al. / Aquacultural Engineering 50 (2012) 20–27
van Rijn, J., Tal, Y., Schreier, H.J., 2006. Denitrification in recirculating systems: theory
and applications. Aquacult. Eng. 34, 364–376.
Zhu, S., Chen, S., 2001. Effects of organic carbon on nitrification rate in fixed film
biofilters. Aquacult. Eng. 25, 1–11.
Vanesa Díaz is Ph.D. student in Chemical Engineering at
Universidad de Cantabria (Spain). She currently holds a
research FPI grant sponsored by the Spanish Ministry of
Science and Innovation. She obtained her B.Sc Degree in
Chemical Engineering and the Master on Sustainable Production and Consumption at the Universidad de Cantabria
(Spain) in 2008 and 2009, respectively. She is researcher
at the Department of Chemical Engineering and Inorganic
Chemistry of the Universidad de Cantabria in new technologies for water reuse, treating and recovering products
of food industry. Nowadays, her work is focused on water
treatment within aquaculture sector.
˜
Raquel Ibánez
is associate professor in the Universidad
de Cantabria (Spain) and she develops her R&D activity in
the group “Advanced Separation Processes”. Her research
activity is focused on the following topics: – Electrodialysis with bipolar membranes (EDBM) in the separation
and purification of milk protein; – EDBM applied to the
treatment of high concentrated waters from desalination
process; – Development and application of membrane
bioreactors (MBR). She has authored more than 20 scientific papers and has supervised 3 Ph.D. students. She
has participated in the main international Congress of
Membrane Technologies (Euromembrane, International
Congress on Membrane and Membrane Processes, European Congress on Chemical Engineering). She was in the Membrane Technology
Group of the University of Twente for six months (2002).
Pedro Gómez obtained his B.Sc. Degree and Ph.D. in
Chemical Engineering at the Universidad de Cantabria
(Spain). Nowadays, he is technical manager of Apria
Systems S.L., enterprise (Spain). Apria Systems provides
innovative solutions in the regeneration and reuse of
wastewaters and in the study of contaminated soils (specially related to hydrocarbon storage activities). His work
is focused on minimization of wastes and energy consumption reduction through the development, design and
optimization of advanced processes.
27
Ana María Urtiaga is Professor of Chemical Engineering at Universidad de Cantabria (Spain). She is Head of
the Department of Chemical Engineering and Inorganic
Chemistry of that university, since 2008. The research is
aimed to the development and integration of new separation technologies based on selective liquid membranes,
pervaporation, ultrafiltration, reverse osmosis, gas separation membranes, and advanced oxidation process, such
as electrooxidation or Fenton. Applications in the fields of
metals recovery, separation of organic compounds, treatment and purification of industrial effluents and landfill
leachates, solvents dehydration, water reuse and hydrogen recovery from gas mixtures have been developed.
Mathematical models processes have also been developed. She has supervised 10
Ph.D. Thesis
Inmaculada Ortiz is Professor of Chemical Engineering
and former Department Head at Universidad de Cantabria
(Spain). She obtained her B.S. degree and Ph.D. in Sciences
(Chemistry) at the University del País Vasco (Spain) in
1980 and 1985, respectively. She was Scientific Officer of
the National R&D programmes on Environment, Chemical Processes and Products and Natural Resources. She
was proposed as coordinator of the Chemical Technology
area of the Spanish ANEP. She has authored more than
2000 scientific papers and has supervised 25 Ph.D. students. She is the leader of the research group “Advanced
Separation Processes” focused on: – Membrane processes;
– Advanced Oxidation Technologies; – Process intensification. Applications to waste water treatment & reclamation, food processing,
chemical pharmaceutical industry and environmental applications.