Management ability and the economics of recirculating aquaculture production systems
Bạn đang xem bản rút gọn của tài liệu. Xem và tải ngay bản đầy đủ của tài liệu tại đây (6.11 MB, 24 trang )
Marine Resaurcf Economics. Votume tO, pp, 187-209
Prinied in ibe USA. All rishti reierved.
073S-1MO^S S3.00 + .00
Copyriihl C 1995 Marine RcMurces Foundation
Management Ability and the Economics of
Recirculating Aquaculture Production Systems
RICHARD F. KAZMIERCZAK, JR. AND
REX H. CAFFEY
Department of Agricultural Economics and Agribusiness
Louisiana State University Agricultural Center
Baton Rouge, LA 70803-5604 U.S.A.
Abstract A bioeconomic model offish growth in recirculating aquaculture
systems was constructed by developing a bioenergetic model comprised of
metabolic sub-models for growth, ammonia production, and oxygen consumption. Metabolite accumulations are determined by exogenous control variables
for filtration and aeration and used to indirectly represent management ability.
Numerical solutions to model parameters were obtained using a two point
boundary shooting algorithm within a dynamic profit maximization framework. Optimal trajectory, isoquant, and bioeconomic optimization analyses
describe specific tradeoff relationships existing between nutrition, density, and
technology. Results demonstrate the economic importance of these relationships changes over time in response to fish weight, and not always in ways
suggested by the physical importance of individual factors. Specifically, economically viable tradeoffs between dietary protein and stocking density occur
over relatively narrow regions of management ability. Without highly experienced and capable management, the biological realities of recirculating systems may preclude profitable system operation.
Keywords aquaculture, recirculating. bioenergetic, bioeconomic, optimization, dynamic, model
Introduction
The U.S. aquaculture industry has benefited from over three decades of research
aimed at developing technically viable production systems (Trosclair 1994). Improved nutrition, species selection, disease prevention, and water quality management have allowed not only widespread establishment of pond facilities, but
also the emergence of recirculating production systems (Brune and Tomasso
1991). Recirculating systems are defined as production units that recycle water by
passing it through filters that remove metabolic waste products. Recirculating
systems have many potential advantages over pond systems, including better
control of the production environment and the ability to locate production facil-
The authors would like to thank Drs. Gregory Luiz and Ronald F. Malone for helpful
comments during development of the biological model. The United States Department of
Agriculture funded this research through an Aquaculture Special Grant. Approved for
publication by the Director of the Louisiana Agricultural Experiment Station as manuscript
number 94-86-8411.
187
188
R. F. Kazmierczak and R. H. Cajfey
ities near major markets (Spotte 1979; Lawson 1991). In addition, the relatively
small land and water requirements of recirculating systems make them attractive
in an era of increasing environmental regulation of aquaculture (Rosenthal 1994).
But, in order to operate successfully, recirculating systems and their critical filtration components must be effectively managed.
While the potential advantages of recirculating systems led to research in filter
design, the existence of technically advanced filters has not generated widespread
economic success for commercial producers (Losordo, Easley, and Westerman
1989). The aquaculture industry has come to realize only too well that the economic viability of recirculating systems is not guaranteed by technical feasibility
(Weaver 1992). Profitable operation of a recirculating system requires not only the
ability to manage complex biophysical interactions over long periods of time, but
to do so in an economically efficient manner. Despite an abundance of biological
and engineering studies, there is a shortage of useful information on the interactions among management, technology and the economics of recirculating systems.
Of course, it can be difficult and expensive to conduct economic experiments on
commercial-size recirculating systems. One way to avoid this problem and still
generate the needed information is through the use of bioeconomic models that
accurately describe the underlying bioenergetic operation of the system (Allen et
al. 1984).
Bioenergetic models have been widely used to examine the time dynamics of
species growth in pond aquaculture systems (Paloheimo and Dickie 1%5, 1966a,
1966b; Machiels and Henken 1986; Cacho 1990). Some investigations have even
included the impact of metabolic feedbacks on growth (Cuenco, Stickney. and
Grant 1985). Less common are bioeconomic models that combine bioenergetics
and the economics of producer decision making. Cacho, Kinnucan, and Hatch
(1991) developed a bioeconomic model of pond catfish production and used it to
determine cost-effective feeding regimes. Researchers have also used bioeconomic models of varying degrees of sophistication to examine open system rearing
of shrimp (Karp, Sadeh, and GrifTm 1986). carp (Talpaz and Tsur 1982), lobster
(Botsford, Rauch, and Shieser 1974), and tilapia (Liu and Chang 1992). To our
knowledge, however, no study has examined a recirculating production system
from a complete bioeconomic framework, incorporating not only realistic metabolite-constrained growth over time, but also the economic constraints faced by
profit-seeking producers.
This study investigates the importance of management ability and filter technology on the economic viability of a recirculating system. To this end. three main
objectives are pursued; development of a theoretical bioeconomic model of recirculating systems, parameterization of the economic and biophysical components of the theoretical model, and optimization of the empirical model. This
paper begins by presenting a conceptual model that identifies the important relationships in a generic recirculating system. Next, the economic framework, bioenergetic growth, and metabolic feedback components of an empirical bioeconomic
model are discussed. Specifically, a differential equation model of recirculating
tilapia production is developed and validated from published information and
expert opinion. After a brief explanation ofthe optimization strategy, simulation
results are analyzed to identify the levels of management ability necessary to
profitably operate a recirculating system. The paper concludes with implications
ofthe results for actual recirculating system management.
Economics of Recirculating Aquaculture Systems
189
Conceptual Model
A conceptual recirculating system mode! can be developed using bioenergetic
relationships, the principles of ecosystem dynamics, and the energy circuit language advocated by Odium (1989). Considering only the bioenergetic portion of
the model (lower half of Figure 1), flows in the system are primarily driven by fish
weight as mediated through metabolism and appetite. Variables potentially under
producer control, such as water temperature and feed quantity and quality, can be
used to adjust the various flows and thus the time path offish growth. Feeding and
growth lead to the generation of waste products and the consumption of oxygen,
but most bioenergetic models assume that these components are assimilated or
supplied by the open environment. Recirculating system models, however, need
to fully account for these feedbacks because of their potential impact on individual
fish growth, mortality, and the overall expansion of total biomass in the production system.
Metabolic waste products take two forms in the conceptual model; solids and
dissolved total ammonia nitrogen (TAN) (Figure I). The toxic portion of TAN,
unionized ammonia nitrogen (UAN), serves as one component of a feedback
mechanism that can inhibit fish growth through changes in appetite or. if large
enough, cause fish mortality. Biological filtration controls the buildup of UAN in
y-
X
Figure i. Conceptual Model of the Interactions Among Control Variables (Circles), Process Variables (Arrow Polygons), and Storage Variables (Peaked Half Circles) in a Recirculating Production System
R. F. Kazmierczak and R. H. Caffey
the conceptual model, but this activity adds to the biological oxygen demand
(BOD) generated by fish respiration and solids decomposition. Open flow-through
systems mitigate both UAN and BOD buildup by water dilution, but recirculating
and some pond systems must supply oxygen to meet BOD through mechanical or
liquid oxygen aeration. Suspended solids are removed from the system with mechanical filters. Failing adequate filtration, it may be possible to control the effects
of UAN and BOD by emergency water dilution, depending on the laws and
regulations governing a specific species culture.
The operation of biological and mechanical filters are critical to the growth of
fish and the stability of a recirculating system over the growout cycle. Only when
both filters are 100 percent efficient will there be no growth or mortality feedbacks. Because perfect filter management is unlikely under commercial conditions, questions arise as to how filter inefficiency affects the potential for profitable system operation. Given the objectives ofthe study and the generic structure
ofthe conceptual model, the causes of less than perfect filter efficiency are most
easily interpreted as management difficulties and not different technology packages. This approach allows us to compare varying management abilities and their
effects on the profitable operation of recirculating systems.
Bioeconomic Model
The empirical economic application of the conceptual model to a recirculating
tilapia production system required specific bioenergetic and metabolic feedback
sub-models, as well as the integration of these submodels within an overall economic framework. This section describes these model components, their parameterization and validation,' and the way in which they interact during numerical
optimization.^
Economic Framework
Over a growout cycle, management ability primarily affects the variable costs
associated with short-run decision making. In addition to the direct monetary
costs associated with stocking, feeding, and electrical power use, indirect costs
can arise when a producer does not adequately manage a recirculating system's
filtration technology. These indirect costs show up in the form of reduced fish
growth and increased mortality. Considering the short-run nature ofthe problem
and the assumption that producers seek to maximize returns above variable costs,
the decision making problem can be expressed as
maximize "" = PQ ' Q ~ Cf - C^ - C^
(1)
' The empirical equations used in this study were generally not statistically estimated due
to the lack of adequate data sets on many critical biophysical relationships. Instead, numerical calibration was employed using the limited available data and expert opinion concerning functional relationships, ranges, and domains. Within this context, validation focuses on qualitative model performance relative to existing knowledge, especially when
insufficient data exist for statistical validation (Law and Kelton 1982).
^ The following discussion focuses on important model comjwnents and highlights critical
relationships. A complete description of the model's derivation can be found in Caffev
(1994).
'
Economics of Recirculating Aquaculture Systems
191
where PQ is the price of tilapia ($/gram), Q is the quantity of fish harvested
(grams/liter), Cf is feed cost ($/Iiter), Q is electricity cost ($Aiter), and C, is total
fingerling cost ($/liter). The model was constructed on a per liter basis to avoid the
need for explicit description of the types, sizes, and configuration of various
physical system components. While this approach allows the study to proceed
within a generic framework, it does assume an input divisibility and constant
proportional returns that may not exist across the spectrum of real system designs. How lumpy inputs and variable proportional returns might affect the analysis of management ability are left to future research.
The growth function required for equation (1) can be expressed as
(2)
where Wfj is the terminal fish weight at harvest (grams), /)„ is the numerical
density offish in the system at harvest (numbers/liter), WQ is the initial fish weight
at stocking (grams), /Q is the stocking day, /„ is the harvest day, and W, is the
growth rate on day t (grams/day). The variable production costs can be defined as
Cf=Pf
{'" RU) • F, • D{t) dt
(3)
Ce = Pe- ('" E, dt
(4)
C, = Ps- Do,
(5)
where Pfis feed price ($/gram), R{t) is ration size relative to appetite on day t (0
=s R(0 =e 1.0), F, is fish appetite on day t (grams/day), D{t) is fish density on day
t (numbers/liter), P^ is electricity price ($/kilowatt hour), E, is rate of electricity
use for aeration and pumping on day t (kilowatt hours/liter day), Ps is fingeriing
price ($/gram), and D^ is the initial stocking density (numbers/liter). Prices were
obtained from surveys of major suppliers, budget-based analyses of recirculating
systems, trade journals, and industry reports (Table I).
Given the desire to include UAN and dissolved oxygen feedbacks in the
model, the technical relationships can be expressed as
W, = g{VAN{t),DO{t),W{t)Mt),DC\
(6)
E, = j\W{t), Dit), R{t). DC]
(7)
F, = h[W{t)]
(8)
UAN, = k[Wit), Rit), Dit). DC. BE]
(9)
192
R. F. Kazmierczak and R. H. Caffey
Table 1
Description of Constant, State, Fixed, and Free Control Variables for any
Individual Simulation Scenario
Variables
Variable Description (value where appropriate)
Constants
Ps
States
W(t)
UAN(t)
DO(t)
BOD(t)
OC(t)
F(t)
D(t)
DH
Fixed Controls
Wo
Do
DC
BE
SAE
Free Controls
R(t)
E(t)
Price of harvestable lilapia ($0.00287/gram for a 700 gram
fish, live weight)
Feed price ($0.00026/gram. $0.00030/gram, and
$0.00034/gram for low, medium, and high protein feeds,
respectively)
Electricity price ($0.07/kilowatt hour)
Fingerling price {S0.05/one gram fish)
Individual fish weight on day t (grams)
Concentration of unionized ammonia nitrogen on day t
(mg/liter)
Concentration of dissolved oxygen on day t (mg/liter)
Biological oxygen demand on day t (mg/liter)
Oxygenation capacity of the water on day t
Individual fish appetite on day t (grams)
Numerical fish density on day t (numbers/liter)
Numerical fish density at harvest (numbers/liter)
Individual fish stocking weight (I gram)
Terminal fish weight at harvest (700 gram market size,
live weight)
Initial numerical stocking density (0.07, 0.09, 0.11, or 0.13
fish per liter, depending on the simulation)
Feed quality (20%, 30%, or 40% crude protein feed,
depending on the simulation)
Biological filter efficiency (0.7 to 1.0, depending on the
simulation)
Standard aeration efficiency (2.0)
Ration size relative to appetite on day t (0 ^ R(t) « 1.0)
Electricity used for aeration and pumping on day t
(kilowatt hours/liter day)
DO, = l[BOD{t),
. SAE\
(10)
where VAN, is the rate change in UAN concentration on day / fmg/liter/day), DO,
is the rate change in DO concentration on day / (mg/liter/day), and other variables
are defined in Table 1. The relationships that determine these equations of motion
jointly compose the bioenergetic and metabolic feedback sub models. Given that
most recirculating systems are housed in climate controlled buildings, tempera-
Economics of Recirculating Aquaculture Systems
193
ture is not included as a growth-related variable.^ In addition, water dilution is
excluded as a possible control variable because many state regulations governing
tilapia culture ban water exchanges in order to prevent the escape of tilapia into
natural fisheries.
Given the description of the bioeconomic model in equations (lHlO), it is
obvious that the biological relationships in a recirculating system significantly
influence the ultimate economic operation ofthe system. Thus, before examining
the impact of management ability, the biophysical relationships embedded in the
model need to be more fully described and empiricized.
Bioenergetic Sub-Model
The bioenergetic model used in this study was an adaptation of Ursin's (1967) and
Liu and Chang's (1992) generalized metabolic growth model. Physical growth is
defined by the difference between energy intake and energy expenditure;
dw/dt = p • dr/dt - a • p • dr/dt - k • w'^
(11)
where dw/dt is the daily weight gain, p is the efficiency of food assimilation, dr/dt
is the daily feed ration, a is the fraction of assimilated food lost to active metabolism, k is the coefficient of resting metabolism, and T) is an exponent relating
body weight (w) to resting metabolism. Within this framework, daily ration can be
described by
dr/dl
= a-f-w^
(12)
where
term on the right hand side of equation (11) represents the amount of consumed
food that is digested and initially incorporated into body weight. The second and
third terms of equation (11) measure the amount of digested food energy that is
lost to active and resting metabolism, respectively. The growth model is quite
flexible and capable of depicting concave, convex, or sigmoidal growth patterns
over time depending on the specific parameter values. However, it is generally
believed that unconstrained fish growth should follow a sigmoidal pattern (Hopkins 1992).
Although equation (11) is capable of tracking the growth effects of different
ration quantities, it does not explicitly incorporate feed quality. This can be accomplished by defining the tilapia-specific assimilation efficiency as
^ While temperature can have important impacts on growth and other biophysical processes in both extensive and intensive aquaculture production, the mode! assumes a growout period over warm spring, summer, and autumn months when heating costs are not a
factor. In addition, simulations with a fixed temperature assume that extremely high temperatures, and the resulting impairment of metabolic activity, are not encountered. In
general, these conditions are met in recirculating aquaculture systems in the lower Southeast United States. Extensions ofthe current model can easily include explicit incorporation offluctuatingtemperature in the bioeconomic model.
R. F. Kazmierczak and R. H. Caffey
P = (0.70 • P:E + 0.51)/(/>.£ + I)
(13)
where P.E is the protein-energy to total-energy ratio contained in the food, with
average tilapia assimilation efficiencies being approximately 70% for protein and
51% for total energy contained in a ration (Bowen 1982). Given this formulation,
assimilation efficiency is primarily a function of feed protein levels.
Assuming a constant water temperature of 3 0 ^ , equations (II) and (12) were
calibrated using a wide range of data from published and unpublished experiments
(Caffey 1994). Final parameter values are presented in Table 2. Verification and
validation ofthe bioenergetic model, a critical step in any simulation study, was
accomplished with data used in model calibration and data independent of the
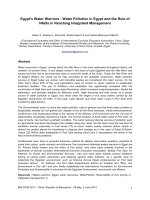
model structure. Resulting simulations demonstrate that the bioenergetic model
accurately depicts experimentally observed tilapia growth over a wide range of
feeding conditions (Figure 2). The upper bound on modeled growth was approximately 1.4 kilograms over a 600 day period, a weight that was considered feasible
under ideal conditions (Lutz 1994). Additional simulations suggest that the time
path of individual tilapia growth was relatively insensitive to the range of feed
protein levels commercially available (Figure 3a). This result might be expected
for a fish like tilapia that feeds low in the food chain. However, changes in the
allowed percent of satiation feeding had considerable effects on simulated growth
(Figure 3b). In order to avoid protracted juvenile development, the high metabolic
rates of fish under 50 grams needed to be satisfied by maximum, or satiation,
feeding. Thus, the daily feeding rate was one ofthe free control variables numerically optimized in this study.
UAN Feedback Sub-Model
The buildup of ammonia compounds in recirculating systems results from the
accumulation of excreted metabolic byproducts, fecal waste, and uneaten feed.
Table 2
Final Parameter Values Used in the Bioenergetic Model
Parameter
Definition
Value in Model
Source
Exponent of
0.67
Calibration; Liu and
synthesis
Chang 1992
i\
Exponent of resting
1.00
Calibration; Liu and
metabolism
Chang 1992
6
Coefficient of food
0.98
Liu and Chang 1992
consumption
K
Coefficient of
0.018 + 0.034
Calibration (see
resting
sech[0.01 W(t)] +
Caffey 1994)
metabolism
0.018
tanhtlOO-O.OI
W(t)]
a
Fraction of
0.269 + 0.513
Calibration (see
assimilated food
sech[0.141 W(t)]
Caffey 1994)
lost to active
+ 0.017
metabolism
tanh[0.141 W(t)]
**•
Economics of Recirculating Aquaculture Systems
195
140
Suresh and Lin
(1988)
100
50
100
150
Time (days)
Figure 2. Comparison of Experimental Tilapia Growth Data With Simulated Growth (Solid
Line) Generated by Ihe Bioenergetic Model
Speece (1973) demonstrated that TAN production can be directly calculated from
the feed ration by using an ammonia conversion constant. Fivelstad et al. (1990)
pointed out that this conversion constant will depend on the ration quality, specifically the amount of protein in the diet. A convenient way to calculate the
conversion constant for warm-water systems assumes that each kilogram of fish
will daily excrete the same number of grams of TAN as the percent dietary protein
in the ration (Meade 1973; Liao and Mayo 1974; Drennan and Malone 1990). But,
TAN is only of interest because of its relationship to UAN. the most toxic form
of aqueous ammonia. UAN levels are generally dependent on system pH and
temperature, and are usually calculated as a fraction of the TAN in the system
(Drennan and Malone 1990). Given a fixed pH of 8.0 and a temperature of 30°C,
approximately 7.5 percent of TAN will be in unionized form (Emerson et al. 1975).
Using this information and converting to an average daily concentration, a UAN
production relationship was defined as
UAN, = 0.075 • CP • D(t) • dridt
(14)
where UAN, is in mg/liter/day, CP is the percent crude protein of the ration, and
D is the fish biomass load in g/liter.
Of course, recirculating systems employ biological filters to restrain the
R. F. Kazmierczak and R. H. Cajfey
196
300
200
400
500
600
Time (days)
1600
8. Cti«ngin( %S«UMonF Mding
1 )0%SMMIon
1400
,
^
11200
s
(
/
E1000
)% SutiMoo
/
i 800
ii 600
/
/
/
I 400
/
/
200
0
100
200
300
400
500
600
Time (days)
Figure 3. Effects of Dietary Protein Level (Panel A) and Level of Percent Satiation Feeding (Panel B) on Simulated Growth Generated by the Bioenergetic Model
buildup of UAN. To represent the operation of the biological filter, a set percentage of UAN was removed from the system each simulated time period. This
percentage was defined as the biological filter efficiency (BE). If management of
the biological filter was less than perfect (0 =e BE < 1.0), UAN would carry over
to the following day's simulation and provide a mechanism by which metabolites
could buildup in the system. Thus, the final relationship for UAN concentrations
was defined as
UAN{1) = (I - BE)(UAN, + UAN(t - 1))
(15)
where UAN(t) is the concentration at time / and UAN(t - 1) is the residual UAN
carried over from the previous time period. BE is used in the model to represent
the varying ability of producers to effectively manage the available biological filter
technology.
If the possibility of UAN buildup exists, then the resulting feedback effects
need to be defined. Mortality from UAN toxicity varies significantly among
warm-water fishes. Tilapia have survived at UAN levels as high as 3.4 mg/liter in
studies involving long acclimation periods (Redner and Stickney 1979). While no
complete information exists on tilapia mortality for various levels of UAN exposure over time, the acute toxic UAN levels for channel catfish {Ictaluras punc-
Economics of Recirculating Aquaculture Systems
197
tatus) closely resemble those reported for tilapia." Using catfish data from Colt
and Tchobanglous (1976), an expression for daily percent UAN-induced mortality
( M )
derived:
= -100
(16)
Given equation (16), mean daily mortality increases gradually as UAN concentrations rise to 3.0 mg/liter and then increases rapidly for UAN concentrations
between 3.0 and 5.0 mg/liter (Figure 4a).
In another article, Colt and Tchobanglous (1978) provide data on catfish that
can be used to estimate the impact of UAN concentrations on growth. Converting
the author's information into a relationship for the mean daily UAN-induced
growth reduction (GRu^^) yielded
= 100(1.035 • UANU)).
(17)
With this relationship, growth reductions increase linearly for UAN concentrations between zero and 1.0 mg/liter (Figure 4b). While UAN concentrations leading to negative growth (individual fish weight loss) are possible, the suppression
of UAN levels caused by falling growth rates and small levels of mortality prevents growth reduction from exceeding 100 percent as long as acute UAN shocks
do not occur.
BOD Feedback Sub-Model
The consumption of oxygen in a recirculating system, or BOD, arises from three
sources; fish respiration, oxidation of ammonia compounds by autotrophic bacteria, and the decomposition of organic solids by heterotrophic bacteria
(Wheaton. Hochheimer. and Kaiser 1991). The BOD generated by fish respiration
is usually determined by the sum of the oxygen required for active and standard
metabolism. Using data in Watten, Colt, and Boyd (1992), total respiratory BOD
for tilapia can be expressed as
BODf, = 0.0043 - Dit) • W{tr^^
(I8)
where BODf, is grams of oxygen consumed/liter/day.
Additional oxygen demand can be linked to the nitrifying autotrophic bacteria
that colonize available substrate within a recirculating system. Due to its high
specific surface area, most nitrification occurs within the biological filter. Nitrifying bacteria require approximately 4.65 grams of oxygen for every gram of TAN
oxidized (Wheaton 1977), or in terms of unionized ammonia, approximately 0.062
** Tilapia are generally considered more tolerant than channel catfish of poor water conditions, both in terms of potential mortality and growth effects. Thus, use of catfish data for
unavailable tilapia information yields impacts of varying management ability that are biased
towards the theoretical upper bounds.
R. F. Kazmierczak and R. H. Cajfey
198
grams of oxygen for every milligram of UAN. Combining this information with
equation (14) yields the relationship
BODn, = 0.00465 • CP • D{t) • drtdt
(19)
where BODn, is in grams of oxygen consumed/liter/day.
The residual portion of BOD is associated with the oxygen demanded by
heterotrophic bacteria that break down organic solids. Malone and Drennan
(1994) developed expressions for oxygen consumed during filtration in experimental systems. Their studies suggest that BODr can range from one to four times the
level of BODn depending on the solids removal efficiency (SRE) of a mechanical
filter. Using this relationship and equation (19) yields
BODr, = (0.00465 • CP • D{t) • drldt)ISRE
(20)
where BODr, is in grams of oxygen consumed/liter/day and 0.25 ^ SRE ^ 1.0.
SRE is used in the model to represent the varying ability of producers to effectively manage the available mechanical filter technology.
The sum of equations (18)-(20) represent the daily per liter oxygen demand in
the modeled system. In terms of validation, Colt and Orwicz (1991) developed a
•too
A. UANII dixadMorti My
/
BO
/
60
/
40
/
20
r
2
3
4
5
6
UAN Concenlration (mgfl)
100
B. UANIndui •dGrMrthRadiK Uon
ao
60
40
20
02
0.4
0.6
0.8
UAN ConcentfatKm (mg/1)
Figure 4. Unionized Ammonia Nitrogen (UAN) Induced Mortalily (Panel A) and Growth
Reduction (Panel B) Feedback Effects Used in the Bioenergetic Model
Economics of Recirculating Aquaculture Systems
199
relationship between system oxygen demand and the feed ration (OFR) from
experimental data. They observed that oxygen demand was relatively constant for
a given feeding regime, but negatively correlated to increases in the feeding rate.
Figure 5 suggests that equations (I8)-(20) correspond well with experimental data
for tilapia. Given that two thirds or more of recirculating system BOD originates
from the oxidation of organic compounds (Malone 1993), the efficiency of mechanical filtration greatly influences the OFR. Depending on the SRE. our model
produced design OFRs between 0.25 and 0.75, a range that appears in the experimental literature and encompasses the suggested conservative design OFR of
0.60 (Liao and Mayo 1974).
The extent to which BOD affects the growth and mortality of tilapia is ultimately determined by the interaction of BOD, aeration, and the resulting residual
dissolved oxygen (DO) in the system. Tilapia are among the most tolerant of warm
water fishes, with survival reported for DO levels as low as 0.1 mg per liter
(Caulton 1982). More conservative estimates suggest that tilapia growth reduction
begins to occur at DO concentrations below 5.0 mg/liter, with mortality commencing at DO levels of 1.5 mg/liter (Caulton 1982). Unfortunately, almost no information exists concerning the functional relationship between DO and growth rates
for tilapia or similar species. Thus, as a first approximation, our model incorporates a sigmoidal relationship that was calibrated to the extreme values, but maintained a near linear relationship through much of the DO range. This produced a
mean daily growth reduction relationship for DO (GRoo) of
- \.OJ
(20
where DOU) is the dissolved oxygen level in mg/liter at time t. Using this relationship, growth reductions expand rapidly as DO levels fall from 4.0 mg/liter to
the minimum sub-lethal concentrations of I.O mg/liter (Figure 6b).
Unlike the case for DO-induced growth reductions, a range of data exists for
DO-induced mortality in both tilapia and catfish (Caulton 1982; Tucker 1985).
With this information, mean daily mortality relative to DO level (My^,) was calibrated as
= \00\0.5
- \.O).
(22)
Equation (22) provides for subtle mortality effects just below the maximum lethal
DO concentration of 1.5 mg/liter. These mortality effects increase gradually down
to DO concentrations of 0.8 mg/liter and then increase rapidly as DO concentration falls below 0.7 mg/liter (Figure 6a).
As previously mentioned. DO concentrations are not just a function of BOD,
but also of aeration technology. While there are a large number of mechanical
aeration devices that could be used in recirculating systems, their operation is
governed by the difference between the actual concentration of oxygen In the
water and the theoretical saturation concentration. The relative rates at which
aeration and degassing of water will occur can be described by a relationship for
the oxygenation capacity (OC) of water that incorporates the standard oxygen
R. F. Kazmierczak and R. H. Cajfey
200
transfer rate and the standard aeration efficiency (SAE) of an aerator (Piedrahita
1991; Colt and Orwicz 1991; CafFey 1994):
OC{t) = 2884.62 • SAE • POWERU) • (C; - C/O)
(23)
where POWERU) is the amount of electricity used by the aerator at time / (kilowatt hours/day), C] is the saturation concentration for oxygen at a given temperature (mg/liter). and C^O is the actual DO concentration at time / (mg/liter).
Equation (23) describes the amount of oxygen that a given aerator can put into the
water given the difference between ambient and saturation DO levels. Thus. OC
can be used to meet BOD demand, with the remaining oxygen available to maintain a given DO concentration in the water. This relationship also points out the
potential importance of POWER as a control variable given a fixed SAE for a
chosen aerator. SAE in this study was fixed at 2.0. a common value for commercially available aerators. Additional power needs are generated by pumps that
circulate water through the system and filters, a demand that can be estimated
assuming the need to circulate 0.6 liter/gram offish/day (Caffey 1994).
Solution Algorithm
Having specified the bioenergetic relationships embedded in equations (6HI0),
the solution of equation (1) requires a strategy for dealing with the large number
of potential control variables. For the purposes of this study, truly dynamic decision variables were restricted to the ration size relative to appetite (R) and
electrical power use (POWER). Time to harvest (tH) was treated as a static decision variable that was repeated adjusted to find the profit maximizing solution.
A terminal individual fish weight of 700 grams was used as a boundary condition.
This terminal weight falls within the range of marketable tilapia and represents the
live weight required to produce the minimum 115 gram (approximately 4 ounce)
fillets desired by the retail market. BE and SRE, the variables that represent the
ability of management to operate the filter technology, were fixed for any given
set of simulation optimizations over tn, but allowed to vary between optimiza07
*
06
0.5
_0.4
\
\
'0 3
0.2
•
0.1
4
6
10
% Body Wetgril Fed (dry)
Figure 5. Comparison of Experimentally Derived Oxygen Feed Conversion Ratios (OFR)
With Simulated OFRs (Solid Lines) Generated by the Bioenergetic Model With Feedbacks
(Data From Colt and Orwicz, 1991)
Economics of Recirculating Aquaculture Systems
201
tions. The results of different sets of simulation optimizations could then be compared and analyzed for the impact of management ability on potential returns.
Feed quality (DC) and initial stocking density (D^) were similarly treated.
The complexity and non-linearity of the bioeconomic model suggests that
solutions need to be approximated using a numerical optimization algorithm. Similar to Cacho, Kinnucan, and Hatch (1991), we employed a two-point boundary
value shooting algorithm with a Brent maximization subroutine (Press et al. 1986).
The shooting algorithm involved a series of iterations that began by satisfying
initial conditions and then integrate toward the terminal conditions. Resulting
discrepancies from the desired terminal conditions were used to adjust the initial
conditions, via a globally convergent variant of the Newton-Raphson method,
until the boundary conditions were satisfied. The maximization subroutine was
used to assure that the appropriate optimal control conditions were met each day
in the time horizon. All simulation optimizations were conducted using the Mathematica computer package.
Results and Discussion
Table 3 displays the results of numerical optimization for seven levels of biological
filter efficiency, four levels of mechanical filter efficiency, and three levels of
dietary protein. Given the structure of the model, the optimum BE-SRE combination for all dietary protein levels occurs when no management constraints exist,
or where BE and SRE both equal one. Under these perfect management conditions, a 700 gram tilapia can be produced in 265 days using a 20 percent dietary
protein. Returns associated with this combination are 8.9 cents/liter, or 0.034
cents/liter/day. Movement away from this ideal management situation reduces
returns, although the rate of decrease is low for declines in SRE. For example, the
time required to obtain a 700 gram fish increases by two days when BE = 1.0 and
SRE = 0.5. resulting in a 3 percent decrease in daily returns to 0.033 cent/liter/
day. This decline can be directly linked to solids removal inefficiency and the need
for increased aeration. Further decreases in SRE cause additional increases in
production time and decreases in returns, with effects ranging up to a 15 percent
decrease in returns for an SRE of 0.25.
Although decreases in SRE produce lower returns for any specific level of BE,
these changes are relatively small. However, declines in BE for any given level of
SRE produce dramatic changes in returns and production times. When SRE = 1.0
and BE = 0.95 for 20 percent dietary protein, the time required for production
increases by 14 days over the optimal BE-SRE combination, with returns decreasing by 12 percent, from 0.034 cents/liter/day to 0.030 cents/liter/day (Table 3).
Additional declines in BE cause successively greater impacts, with returns falling
over 80 percent from optimal levels for BEs below 0.80. irrespective ofthe SRE
level. No positive returns were observed for 20 percent dietary protein when BE
was 0.70.
The model's apparent sensitivity to changes in BE can be linked to the nature
ofthe BE-SRE feedback relationships in actual recirculating systems. Biological
filter inefficiency leads to the gradual buildup of toxic UAN. UAN can cause
mortality, but there is a fairly wide UAN concentration range over which the most
immediate effect is to reduce growth to rates that allow the biological filter to
assimilate the waste products. In turn, the reduction in growth rates tends to slow
R. F. Kazmierczak and R. H. Caffey
202
100
B DOInduca
80
60
\
40
20
02
04
06
V
08
DO Concenlratlon (mg/l)
100
KtucUon
A DOInOi
80
60
40
\
20
1
2
3
4
5
6
DO Concentration (mg/l)
Figure 6. Dissolved Oxygen (DO) Induced Mortality (Panel A) and Growth Reduction
(Panel B) Feedback Effects Used in the Bioenergetic Model
down the increase in UAN levels. The result is that rising UAN levels can occur
without causing catastrophic system failure, but only at the ultimate loss of returns. When management ability is incapable of maintaining zero levels of UAN.
optimal production time paths require less than satiation feeding and thus correspondingly longer production times. Given the model structure, declines in SRE
levels do not have the same impact because they can be at least partially offset by
increasing the power used in aeration. This latter process essentially mimics the
way in which producers run additional aerators during periods of low DO. However, the observed small reductions in returns for higher values of SRE at any
given BE suggests that the optimum level of power input to the system is somewhat less than 100 percent of the amount required for the elimination of DO
growth effects.
As previously mentioned, negative returns were observed for every level of
SRE when BE = 0.70. This region of negative returns expanded to include higher
levels of BE efficiency as the percent dietary protein increased (Table 3). For
example, negative daily returns for 30 percent dietary protein developed at levels
of BE =e 0.80. Given the model relationships for metabolite production, the results
indicated that an increase in food quality from 20 to 30 percent protein causes an
approximate 33 percent increase in TAN production and the corresponding increased growth and mortality effects as mediated directly through UAN and indirectly through DO. Thus, at higher dietary protein levels, more UAN was
203
Economics of Recirculating Aquacuiture Systems
Ov "1 (S r - -" r J
n fs n — •— o
— V r- r-
o o o o o o
« o o o o o o o
I
B
O
olo,
'3. ' S I
u
^
« o o o © o © ©
I I I I
r^ r~- "^
' m vo ^
r-i
l§
u
* > © © © o o o o
^
1 1 1
ty o
00 B
c
Q
I I I
>
"5
o n
Day
able
— ^O ^ oo
P O O O O O
«oooo©©©
1 1 1
00 po f*% ^ ^ ^
— oo oo o—o —
o
«©©ooooo
"
a
1 1 1 3
o o o o o
til
H
•o
•o
3u
in
SS
00
Is
w
_B
00 o
— — ^^^ S o o t - m t M — in
I I
O
E i:
3
P
U £* 3
I T
Q
f^ oo in OS 1*^ i n f*^
r^ r J
^ T3. a a:
p o o o o o o
go
d d d d d d d u wo o o o d d
I I
E fez
•^ P
o o o o o o
wd
I I I
s
oS
i.f^in<--ooo"noo
S^f^inCTs'*op<y><>
Ji5 r^ ^
^3
^.1 pf^ w 1/^ 1 ^
1- I-- a>
a od r^
>5
Q B
(S —
S
I I
I I I
LT 'tJ
ffl0000O
-amr'ir-l — O —
u o o o o o © ©
a- r=
W
© © © © o ©
«
I I I
O r^ — in 00 in
'5
rt
x:
o
J3 1>
e
©o o o o o
' ' ' 1
E
3
a;
a
>O O ff>
d in r-^
I I I
u
e
pti
ffi
• 3 'o
a
O
a«
u
CQ
UJ
"o
tiu E
o ~
S »n
—d
•n
©
00
d 00
d o
— o o o o o
—© o o o o o
204
R. F. Kazmierczak and R. H. Caffey
present to ultimately reduce returns when management of filter technology was
not perfect. This phenomenon was even more pronounced in the simulations using
a dietary crude protein level of 40 percent (Table 3). While increasing dietary
protein may be a desirable production strategy in the absence of metabolic feedbacks, careful consideration must be given to the costs and benefits of doing so in
a recirculating system. This is especially important for tilapia culture given that
the fish has a relatively low protein requirement and may not exhibit large proteinrelated growth responses (Figure 3a). Simulation results further suggest that feeding high protein feeds to tilapia in closed systems is even less advantageous
because increased problems with metabolite feedbacks counteracts potential production benefits for all but the perfectly managed systems.
Another important component associated with optimal recirculating system
management concerns the initial stocking density. Stocking density can directly
affect all aspects of system operation, from the way in which UAN and BOD
concentrations develop to the ultimate number offish available for harvest. Table
4 presents optimal simulation results using the same parameters as the simulations
in Table 3, but now fixing dietary protein at 20 and 40 percent, SRE at 0.50, and
allowing a range of stocking densities and biofilter efficiency levels. Because SRE
is fixed, management ability is entirely focused on the choice of stocking level and
the biological filtration process.
As expected under perfect biological filter management, increases in stocking
density produce no additional increases in the optimal 267 days required to produce a 700 gram tilapia (Table 4). The relative absence of metabolic feedbacks
when BE = 1.0 (some BOD effects still exist given SRE = 0.50) allows returns
to increase as stocking density increases, up to a maximum of 0.061 cents/liter/day
for an initial density of 0.13 fish/liter. This density represents a recommended
upper bound on the stocking density in real systems in order to reach harvest
biomass concentrations of 0.25 to 0.50 lbs/gallon. But, as before, changes in BE
have dramatic effects on returns and time to harvest, with the impact of stocking
density becoming increasingly important as biological filter efficiency decreases.
For example, a decrease in BE from 1.0 to 0.95 leads to an approximate 20 day
increase in the time to harvest for all levels of stocking. However, decreasing BE
from 0.95 to 0.90 causes a 10 day harvest time increase for a density of 0.07
fish/liter, but an 18 day increase for an initial stocking density of 0.09 fish/Iiter.
Furthermore, the same BE reduction causes increases of 29 and 41 days for
densities of 0.11 and 0.13, respectively. The impacts of less than perfect biological
filter management are further magnified in the 40 percent dietary protein simulations (Table 4).
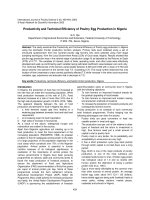
Figure 7 provides an illustration of the trade-off that exists between management ability and stocking density. Daily returns are presented for a range of
biological filter efficiencies over four initial stocking densities and two dietary
protein levels. At a BE = I.O, the economic returns for 20 percent protein feed
increase by nearly 100% per day as stocking densities increase from 0.07 to 0.13
fish/liter (Figure 7a). However, decreases in BE lead to metabolic feedbacks that
cause growth reduction and mortality, decreasing the range of returns. For example, at BE = 0.90 no economic advantage exists for a density of 0.13 over a
density of 0.11 fish/liter.In addition, only slightly higher returns exist for a density
of 0.09 over a density of 0.07 fish/liter. As biofilter efficiencies fall below 0.87, the
economic advantages of stocking rates higher than 0.07 fish/liter completely dis-
Economics of Recirculating Aquaculture Systems
205
appear. The interaction between dietary protein level and management ability is
even more obvious when comparing simulations for 20 and 40 percent protein
feeds. Not only do the advantages of higher stocking levels decrease for 40 percent dietary protein even under perfect management ability, but higher protein
feeds become a substantial negative influence on returns for even small decreases
in biological filter efficiency (Figure 7b).
Conclusions
Aquaculture producers face an array of decision making responsibilities that determine the ultimate success of their operation. As producers intensify resource
use, the role of management ability becomes critical. Recirculating systems may
be the most vulnerable to small management mistakes. The nature of recirculating
system operation dictates that producers stock their systems at high densities in
order to overcome the higher fixed and variable costs normally associated with
closed system operation. But, higher levels of biomass density imply narrower
margins for error in managing the biophysical environment. As a result, management ability becomes extremely important to the economic success of recirculating system operations.
Results generated by this study indicate that less than perfect management
ability can eliminate the normal advantages associated with using high protein
feed. While higher protein levels produce faster growth, and for this reason are
often used in the industry, the increased direct feed costs and indirect costs due
to metabolic feedbacks produce lower daily returns if high protein feeds use
continues through harvest. Inefficiency in solids removal negatively affected returns, but the majority of negative impacts were linked to declines in biological
filter efficiency. As biological filter efficiency fell, time to harvest increased at an
increasing rate and returns decreased at an increasing rate. Results also indicate
that as stocking density increased, direct increases in returns were assured only if
nonmetabolic feedbacks occurred. If the filter technology is operated inefficiently, higher stocking density may actually lead to economic failure. Thus, a
trade off exists between stocking density and management ability, with the tradeoff being substantially affected by levels of dietary protein, ln essence, economically viable tradeoffs between dietary protein and stocking density occur over
relatively narrow regions of management ability. Without highly experienced and
capable management, the biological realities of recirculating systems may preclude profitable system operation. These simulated observations may in part explain why recirculating systems have yet to demonstrate widespread success on a
commercial scale.
There are a number of ways that this study could be expanded to further
examine the role of management on the economics of recirculating system operation. A more complete characterization ofthe metabolic sub models awaits additional biological research, but modeling ofthe biological filtration process could
be improved by incorporating growth relationships for the resident bacterial colonies. This addition is suggested by the often stated industry observation that
recirculating system operators are actually producing at least two crops simultaneously; harvestable fish biomass and non-harvested, but critically important,
bacterial biomass. The modeling framework of this study could also be used to
examine the economic impact of biological production shocks (acute over-
R. F. Kazmierczak and R. H. Caffey
206
U O O O O O O O
g
V O O O O O O O
I I1
g
I III
I
OC
99
as
(
.
. — O o> r- rj r-M
oa
I!
I
I I I
>s
%m •rm
,o S
w^ —. f*^ — a — —
o o oo oo o
uooooooo
B.
II
(b a
QS
^V 1
t = 9
£0000000
i a
III 1
00 — — f^ ^ M
r-. —
r -o ao * -v r-
P
o
"C
UOOOO'T —
£ ii -
I I
I
I I I
a, I
-C Ov O
r^ fN r j
s
o o o
u o o o o o o o
W O O O
q qq
ddd
q
d
I I I I
— Ed
u
cu
O t3
S — o o o i d f - i — wS
777
-'2
^g
m r~ m 00 —
« o o o o o o o
^
3w
u o o o o o o o
I
-a
* • •
8S
r^ ^K ^f ^si 10 ^s ^ ^
,*5 00 1"^ r*^ *O ^ <*** ^
t
.§ g
"3
ir " ^ ^ f*^ ^d CH *O r'l
.t:! 00 V ^ **\ *rj 00 O
it
117
•'^
S
«rf
u-> o i n g >n o
^CTv00 00 r^ r^
— o d cJ d d d
<&
pa
1 1 1
y
>>
CO
-3
1^
-,3
u
8 o\U-1
O *n Q m O
S 00 00 r-^ t^
— dddddd
feeding, disease related mortality) and price risk (both input and output) under
varying amounts of management ability.
Economics of Recirculating Aquaculture Systems
A. 20% Dietary Protein
207
Initial
Stocklna
Oonalty
700 g Harvest Weight
I
0.13 g/)
Si
-•-O.Ofl g/l
— - 0.07 g/l
0.9
0.8
S.7
8lontl«f Operating Emciancy
0.04
5^«.
0.03
- - r^St
B. 40% Dietary Protein
"*" 8 "•"'••1 Weight
0.01 -
initial
StocMng
Denalty
- ^ 0 . 1 3 gfl
- — 0.11 g/l
—0.09gn
0.01
0
— 0.07 gn
-0.01
-0.03
-0.03 0.9
OJ
0.7
BloflltBr Operating Efficiency
Figure 7. Simulated Daily Returns for Various Initial Stocking Level and Biological Filter
Efficiency Given a 20 Percent (Panel A) and 40 Percent (Panel B) Dietary Protein Feed
References
Allen. P. G., L. W. Botsford. A. M. Schuur. and W. E. Johnston. 1984. Bioeconomics of
Aquaculture. Amsterdam. The Netherlands: Elsevier Science Publishing Company,
Inc.
Botsford. L. W.. H. E. Rauch. and R. Shieser. 1974. Application of optimization theory to
the economics of aquaculture. Proceedings ofthe World Mariculture Societv 5-387401.
Bowen. S. H. 1982. Feeding, digestion, and growth-qualitative considerations. In R. S. V.
Pullin and R. H. Lowe-McConnel (eds). The Biology and Culture of Tilapias. Makati
Phillipines: ICLARM.
Brune, D. E. and J. R. Tomasso. 1991. Aquaculture and water quality: The emergence of
an applied discipline. In Aquaculture and Water Quality: Advances in World Aquaculture. Volume 3. Baton Rouge. Louisiana: The World Aquaculture Society pp
11-20.
Cacho. O. J. 1990. Protein and fat dynamics in fish: a bioenergetic model applied to aquaculture. Ecological Modelling 5O(l):33-56.
Cacho. O. J., H. Kinnucan. and U. Hatch. 1991. Optimal control offish growth. American
Journal of Agricultural Economics 73:176-183.
Caffey, R. H. 1994. A Bioeconomic Model of Fish Production in Recirculating Aquaculture Systems. Masters Thesis, Department of Agricultural Economics and Agribusiness, Louisiana State University.
208
R. F. Kazmierczak and R. H. Caffey
Caulton, M. S. 1982. Feeding, digestion, and growth-qualitative considerations. In
R. S. V. Pullin and R. H. Lowe-McConnel (eds). The Biology and Culture ofTilapias.
Makati, Phillipines: ICLARM.
Clark, A. A., W. O. Watanabe, and B. L. 011a. 1990. Growth, feed conversion and protein
utilization of Florida red tilapia fed isocaloric diets with different protein levels in sea
water pools. Aquaculture 88:75-85.
Colt, J. and C. Orwicz. 1991. Aeration in intensive aquaculture. In D. E. Brune and J. R.
Tomasso (eds), Aquaculture and Water Quality: Advances in World Aquaculture, Volume 3. Baton Rouge, Louisiana: The World Aquaculture Society, pp. 198-272.
Colt, J. and G. Tchobanglous. 1976. Evaluation of shoti-term toxicity of nitrogenous compounds to channel catfish, Iclalurus punciatus. Aquaculture 8:209-224.
Colt, J. and G. Tchobanglous. 1978. Chronic exposure of channel catfish Ictalurus punctatus to ammonia: Effects on growth and survival. Aquaculture 15:353-372.
Cuenco, M. L., R. R. Stickney, and W. E. Grant. 1985. Fish bioenergetics and growth in
aquaculture ponds: I. Individual fish model development. Ecological Modelling 27:
169-190.
Drennen, D. G. and R. F. Malone. 1990. Design of recirculating systems for intensive
tilapia culture. Presented paper at the 1991 Louisiana Aquaculture Conference, Baton
Rouge, Louisiana.
Emerson, K., R. C. Russo, R. E. Lund, and R. V. Thurston. 1975. Aqueous ammonia
equilibrium calculations: Effect of pH and temperature. Journal of the Fisheries Research Board of Canada 32:2379-2383.
Fivelstad, S., J. M. Thomassan. M. J. Smith, H. Kjartansson, and A. B. Sando. 1990.
Metabolite production rates from Atlantic salmon (Salmo salar L.) reared in single pass
land-based brackish water and sea-water systems. Aquaculture Engineering 9:1-21.
Hopkins, K. D. 1992. Reporting fish growth: a review of the basics. Journal of the World
Aquaculture Society 23(3): 173-179.
Karp, L., A. Sadeh, and W. L. Griffin. 1986. Cycles in agricultural production: the case of
aquaculture. American Journal of Agricultural Economics 68(3):553-56l.
Law, A. M. and W. D. Kelton. 1982. Simulation Modeling and Analysis. New York:
McGraw-Hill Book Company.
Lawson, T. B. 1991. Understanding recirculating aquaculture systems. In Proceedings of
the Louisiana Aquaculture Conference. Baton Rouge, Louisiana: The World Aquaculture Society.
Liao, P. B. and R. D. Mayo. 1974. Intensified fish culture combining water reconditioning
with pollution abatement. Aquaculture 3:61-85.
Liu, K. M. and W. Y. B. Chang. 1992. Bioenergetic modelling of effects of fertilization,
stocking density, and spawning on the growth of Nile tilapia iOreochromis niloticus).
Aquaculture and Fisheries Management 23:291-301.
Losordo, T. M., J. E. Easley, and P. W. Westerman. 1989. Preliminary results of a survey
on the feasibility of recirculating aquaculture production systems. ASAE Paper no.
897557. American Society of Agricultural Engineers Winter Meeting. New Orleans.
Louisiana, December 12-15, 1989.
Lutz, G. 1994. Personal communication. Louisiana Cooperative Extension Service, Louisiana State University Agricultural Center, Baton Rouge.
Machiels, M. A. M. and A. M. Henken. 1986. A dynamic simulation model for growth of
the African catfish, Clarias gariepinus (Burchell 1822). \. Effect of feeding level on
growth and energy metabolism. Aquaculture 56:29^52.
Matone, R. F. 1993. Personal communication. Civil Engineering Aquatic Systems Laboratory, Department of Civil Engineering, Louisiana State University, Baton Rouge.
Malone, R. F. and D. G. Drennen. 1994. Personal communication. Civil Engineering
Aquatic Systems Laboratory, Department of Civil Engineering, Louisiana State University, Baton Rouge.
Economics of Recirculating Aquaculture Systems
209
Meade, T. L. 1973. Salmonid culture in closed systems. Proceedings of the World Mariculture Society 4:115-122.
Odum, H. T. 1989. Simulation models of ecological economics developed with energy
language methods. Simulation 53(2):69.
Paloheimo, J. E. and L. M. Dickie. I%5. Food and growth of fishes. I: A growth curve
derived from experimental data. Journal of the Fisheries Research Board of Canada
22:521-542.
Paloheimo, J. E. and L. M. Dickie. 1966a. Food and growth of fishes. II: Effects of food
and temperature on the relation between metabolism and body weight. Journal of the
Fisheries Research Board of Canada 23:869-908.
Paloheimo, J. E. and L. M. Dickie. 1966b. Food and growth of fishes. Ill: Relations among
food, body size, and growth efficiency. Journal of the Fisheries Research Board of
Canada 23:l209-\24i.
Piedrahita, R. H. 1991. Engineering aspects of warm-water hatchery design. In Proceedings of the World Aquacuiture Society and the American Society of Agricultural Engineers Jointly Sponsored Session. World Aquaculture Society 22nd Annual Meeting.
San Juan, Puerto Rico. American Society of Agricultural Engineers Publication 02-91.
Press, W. H., S. A. Teukolsky, W. T. Vetterling, and B. P. Flannery. 1992. Numerical
Methods in C. Second Edition. Cambridge, England: Cambridge University Press.
Redner, B. D. and R. R. Stickney. 1979. Acclimation to ammonia by Tiiapia aurea. Transactions of the American Fisheries Society 108:383-388.
Rosenthal, H. 1994. Aquaculture and the environment. World Aquaculture 25{2):4-ll.
Siddiqui, A. Q., M. S. Howlader, and A. A. Adam. 1988. Effects of dietary protein levels
on growth, feed conversion and protein utilization in fry and young Nile tilapia {Oreochromis niloticus). Aquaculture 70:63-73.
Speece, R. E. 1973. Fish and Invertebrate Culture: Water Management in Closed Systems.
New York, New York: Wiley Inter-Science.
Spotte, S. 1979. Fish and Invertebrate Culture: Water Management in Closed Systems.
New York, New York: Wiley Inter-Science.
Suresh, A. V. and C. K. Lin. 1992. Effect of stocking density on water quality and production of red tilapia in recirculating sea water systems. Aquacultural Engineering
11:1-22.
Taipaz, H. and J. Tsur. 1982. Optimising aquaculture management of a single-species fish
population. Agricultural Systems 9:127-142.
Trosclair, C. 1994. WAS: A solid industry contributor and resource. Water Farming Jour-
nal %\).
Tucker, C. S. 1985. Channel Catfish Culture. Amsterdam, The Netheriands: Elsevier Science Publishers.
Ursin, E. 1967. A mathematical model of some aspects of fish growth, respiration, and
mortality. Journal of the Fisheries Research Board of Canada 24:2355-2453.
Watten, G. J., J. Colt, and C. Boyd. 1992. Principles of Aeration in Aquaculture. Draft
manuscript.
Weaver, D. 1992. Water Farming JournanOy.9.
Wheaton. W. F. 1977. Aquacultural Engineering. New York, New York: WileyInterscience.
Wheaton, W. F., J. Hochheimer, and G. E. Kaiser. 1991. Fixed film nitrification filters for
aquaculture. In D. E. Brune and J. R. Tommaso (eds), Aquaculture and Water Quality: Advances in World Aquaculture, Volume 3. Baton Rouge. Louisiana: The World
Aquaculture Society, pp. 272-303.