Membrane biological reactor treatment of a saline backwash flow from a recirculating aquaculture system
Bạn đang xem bản rút gọn của tài liệu. Xem và tải ngay bản đầy đủ của tài liệu tại đây (1004.83 KB, 18 trang )
Aquacultural Engineering 36 (2007) 159–176
www.elsevier.com/locate/aqua-online
Membrane biological reactor treatment of a saline backwash flow
from a recirculating aquaculture system
Mark J. Sharrer a, Yossi Tal b, Drew Ferrier c, Joseph A. Hankins a,
Steven T. Summerfelt a,*
b
a
The Conservation Fund’s Freshwater Institute, 1098 Turner Road, Shepherdstown, WV 25443, United States
Center of Marine Biotechnology, University of Maryland Biotechnology Institute, 701 E. Pratt Street, Baltimore, MD 21202, United States
c
Hood College, Department of Environmental Biology, 401 Rosemont Avenue, Frederick, MD 21701-8575, United States
Received 30 May 2006; accepted 16 October 2006
Abstract
A recirculating aquaculture system (RAS) can minimize water use, allowing fish production in regions where water is scarce and
also placing the waterborne wastes into a concentrated and relatively small volume of effluent. The RAS effluent generated during
clarifier backwash is usually small in volume (possibly 0.2–0.5% of the total recirculating flow when microscreen filters are used)
but contains high levels of concentrated organic solids and nutrients. When a RAS is operated at high salinities for culture of marine
species, recovering the saltwater contained in the backwash effluent could allow for its reuse within the RAS and also reduce salt
discharge to the environment. Membrane biological reactors (MBRs) combine activated sludge type treatment with membrane
filtration. Therefore, in addition to removing biodegradable organics, suspended solids, and nutrients such as nitrogen and
phosphorus, MBRs retain high concentrations of microorganisms and, when operated with membrane pore sizes <1 mm, exclude
microorganisms from their discharge. In this research, an Enviroquip (Austin, TX) MBR pilot-plant was installed and evaluated
over a range of salinities to determine its effectiveness at removing bacteria, turbidity, suspended solids, nitrogen, phosphorus and
cBOD5 content from the approximately 22 m3/day concentrated biosolids backwash flow discharged from the RASs at The
Conservation Fund Freshwater Institute. The MBR system was managed at a hydraulic retention time of 40.8 h, a solids retention
time of 64 Æ 8 days, resulting in a Food: Microorganism ratio of 0.029 dayÀ1. Results indicated excellent removal efficiency (%) of
TSS (99.65 Æ 0.1 to 99.98 Æ 0.01) and TVS (99.96 Æ 0.01 to 99.99 Æ 0.0) at all salinity levels. Similarly, a 3–4 log10 removal of
total heterotrophic microbes and total coliform was seen at all treatment conditions. Total nitrogen removal efficiency (%) ranged
from 91.8 Æ 2.9 to 95.5 Æ 0.6 at the treatment levels and was consistent, provided a sufficient acclimation period to each new
condition was given. Conversely, total phosphorus removal efficiencies (%) at 0 ppt, 8 ppt, 16 ppt and 32 ppt salinity were
96.1 Æ 1.0, 72.7 Æ 3.5, 70.4 Æ 2.3, and 65.2 Æ 5.4, respectively, indicating reduced phosphorus removal at higher salinities.
# 2006 Elsevier B.V. Open access under CC BY-NC-ND license.
Keywords: Recirculating system; Effluent treatment; Waste capture; Membrane biological reactor; Salinity; Water reclamation
1. Introduction
1.1. Background
* Corresponding author. Tel.: +1 304 876 2815;
fax: +1 304 870 2208.
E-mail addresses:
(M.J. Sharrer),
(S.T. Summerfelt).
As the global population continues its exponential
rise, the demands placed on natural resources are
increasing. Technologies aimed at maximizing food
0144-8609 # 2006 Elsevier B.V. Open access under CC BY-NC-ND license.
doi:10.1016/j.aquaeng.2006.10.003
160
M.J. Sharrer et al. / Aquacultural Engineering 36 (2007) 159–176
production capabilities, environmental compatibility,
and profitability are continually being developed.
Agricultural practices and expertise have been
expanded to allow for higher yields and lower incidence
of disease. Similarly, the field of aquaculture has aspired
to develop progressively more sustainable, efficient, and
economical production capabilities. And, as yields of
marine fish continue to decline, fish production at
aquaculture facilities is becoming progressively more
important. Although production in these facilities is
rising, challenges associated with the intensification of
this production method are ubiquitous. These issues can
range from maintaining proper water quality, mechanical maintenance of production equipment, and controlling outbreak of disease. Another key issue that is
encountered with the intensification of fish culture
systems is effective waste management and disposal.
Water usage in fish culture facilities ranges from low
exchange ponds, to complete flow-through systems, to
tank-based systems using water recirculating technologies. Daily flows emanating from fish farms coupled
with cleaning events that are performed to reduce
suspended solids and improve water quality within an
aquaculture system can result in significant discharge of
waste material (Summerfelt, 1999). Components of
waste resulting from fish production include nitrogen
and phosphorus compounds, suspended solids, biochemical oxygen demand, and bacteria. One of the
benefits of recirculating aquaculture systems is their
capacity to concentrate the particulate waste materials
into a relatively small waste stream. Wastewater
reclamation is especially significant when marine
species are being raised within systems that treat and
recirculate brackish or full-strength seawater at inland
locations because discharge of the salts to a freshwater
watershed could be regulated and can also increase the
fish farm’s variable costs.
Semi-closed recirculating systems must flush the
concentrated biosolids contained in filter backwash
flows. The biosolids in the backwash flows are then
thickened (Chen et al., 1997; Ebeling et al., 2003,
2006; Brazil and Summerfelt, 2006; Summerfelt
et al., 1999) and the resulting supernatant or filter
permeate often requires further treatment (Brazil and
Summerfelt, 2006; Ebeling et al., 2003) and could
potentially be reclaimed in order to reuse its water,
salts, or heat. Further treatment of the thickened
sludge involves long term storage, composting, and
land application (Chen et al., 1997; Summerfelt,
1999; Summerfelt et al., 1999). The objective of this
paper is to evaluate a membrane biological filtration
system for reclaiming water, salts, and heat found
within the backwash flow discharged from semiclosed recirculating aquaculture systems.
1.2. Membrane filtration
A recent advancement in waste treatment technology
involves the filtration of wastewater through porous
membranes. Specifically, membrane biological reactors
(MBRs) combine the activated sludge process of a
conventional activated sludge (CAS) system with a
membrane submerged in the process water capable of
filtering particulate waste constituents from the mixed
liquor solution. This semi-permeable membrane can
retain particles greater than 0.01–10 mm, depending
upon pore size, while allowing dissolved components
and water to pass through the membrane (Viadero and
Noblet, 2002). The liquid that passes through the
membrane is referred to as permeate while the liquid
excluded by the membrane is known as retentate (Crites
and Tchobanoglous, 1998). As a result, components of
wastewater such as suspended solids, microorganisms,
and bacteria, along with the associated particulate
nitrogenous components, biological oxygen demand
(cBOD5), and chemical oxygen demand (COD) can be
selectively excluded from the effluent of MBRs
(Gunder, 2001). Membrane filtration that falls within
the category of micro-filtration (pore size 0.1–10 mm)
has shown the potential for pre-treatment of drinking
water by removing colloidal particles, microorganisms,
and other particulate material (Van der Bruggen et al.,
2003). Similarly, membrane filtration has been used for
surface water treatment in the Los Angeles area
resulting in permeate turbidity of <0.1 ntu (Karimi
et al., 2002). Membrane biological reactors have been
shown to take municipal wastewater flows and after
treatment provide high quality, reusable, particle free
effluent (DiGiano et al., 2004; Fleischer et al., 2005;
Marrot et al., 2004; Churchouse, 2001; Churchouse and
Wildgoose, 1999). Consequently, treatment of the
backwash flows produced in marine recirculating
aquaculture systems with MBRs can potentially reclaim
the water and its salt and heat for reuse in the fish
production systems, while simultaneously reducing salt
discharge to the environment.
Through the activated sludge process, using a
recirculating loop that includes anoxic and aerobic
treatment basins coupled with membrane filtration, an
environment is created that is suitable for the removal of
nitrogen from the wastewater through the mechanisms
of nitrification and denitrification. Nitrification, which
is a two-stage process and takes place in an aerobic
environment, occurs when un-ionized ammonia (NH3)
M.J. Sharrer et al. / Aquacultural Engineering 36 (2007) 159–176
is oxidized to nitrite (NO2À) (Eq. (1)), which is further
oxidized to nitrate (NO3À) (Eq. (2)):
NH3 þ 1:5O2 $ NO2 À þ H2 O þ Hþ þ 84 kcal molÀ1
(1)
NO2 À þ 0:5O2 $ NO3 À þ 17:8 kcal molÀ1
(2)
A community of autotrophic bacteria that utilize free
NH3 molecules and NO2À ions as energy sources
facilitates this microbiological process. Nitrosomonas
spp. and Nitrobacter spp., respectively, perform this
sequential action, and are cultivated within the mixed
liquor suspended solids contained in the membrane
filtration system (Hagopian and Riley, 1998).
Biological nitrate removal can be accomplished
through either dissimilatory or assimilatory pathways
(EPA, 1993a; van Rijn et al., 2006). Denitrification
occurs in one of two possible dissimilatory pathways
in which nitrate ions resulting from nitrification are
then available for reduction to nitrogen gas by
facultative anaerobes under anoxic conditions
(Stephenson et al., 2000; van Rijn et al., 1995). In
the second dissimilatory pathway nitrate is reduced to
ammonia by obligate and facultative anaerobes under
anoxic conditions; thus, both processes result in
concomitant release of energy used by the bacteria.
Denitrifying bacteria utilize nitrate, in the same way
as oxygen, as electron acceptors and organic carbon
usually serves as an electron source (EPA, 1993a;
Brazil, 2004; van Rijn et al., 2006). The stoichoimetric
relationship of the denitrification process is described
in the following unbalanced equation (Eq. (3)) (EPA,
1993a):
NO3 À þ CH3 OH þ H2 CO3 ! N2 þ H2 O þ HCO3 À
(3)
Denitrification can also occur where facultative
anaerobes reduce NO2À to elemental nitrogen (N2)
(e.g., (4)), which produces the intermediate compounds nitric oxide (NO) and nitrous oxide (N2O)
under certain conditions (EPA, 1993a; van Rijn et al.,
2006):
NO3 À ! NO2 À ! NO ! N2 O ! N2
(4)
Finally, the assimilatory pathway occurs when
microorganisms utilize nitrate to produce ammonia,
which is then utilized as a nitrogen source to generate
biomass (Eq. (5)) (EPA, 1993a; van Rijn et al., 2006;
Brazil, 2004):
NO3 À ! NO2 À ! NH4 þ
(5)
161
Another ammonia oxidation mechanism found in
urban estuarine sediments and known to be coupled
with wastewater treatment technology, is anaerobic
ammonia oxidation or anammox (Tal et al., 2005).
These autotrophic bacteria, which use nitrite as the
preferred electron acceptor and CO2 as a carbon source,
catalyze this reaction according to the following
equation (Tal et al., 2004):
NH3 þ HNO2 ! N2 þ 2H2 O
(6)
Conditions maintained within the membrane biological reactor likely cultivate the organisms capable of
performing this microbiological mechanism as well.
Denitrification can occur in a traditional activated
sludge process using an aerobic bioreactor combined
with a digestion basin kept under anoxic conditions
(Aboutboul et al., 1995). A wastewater treatment plant
utilizing an anoxic/oxic concept showed a 99.9%
reduction in NO3-N (Beeman and Reitberger, 2003). In
a study by Sadick et al. (1996) that analyzed the
performance of an anaerobic fluidized bed bioreactor,
microorganisms attached to the suspended sand
particles reduced the nitrate (NO3) concentration from
7.2 mg/L at the inlet to 0.3 mg/L in the effluent. In
typical membrane bioreactor systems, the aerated and
anoxic components of the coupled nitrification and denitrification processes are connected with a pump that
recycles water from the anoxic to aerobic tank. The
membrane component is located in the aerobic tank to
take advantage of aeration used to scour solids from the
membrane. An overflow drain from the aerobic tank to
the anoxic tank maintains a constant wastewater level in
the aerobic tank.
Phosphorus removal can also be accomplished
within the MBR process simultaneously with nitrification/denitrification. The mechanism of phosphorus
removal is both biological and physical. Phosphorus
is an essential nutrient utilized by microorganisms for
cell synthesis, maintenance, and energy transport (EPA,
1993b). The phosphorus accumulated by heterotrophic
bacteria within the activated sludge is subsequently
retained by the MBR when bacteria is excluded from the
permeate flow. Enhanced biological phosphorus
removal (EBPR) by de-nitrifying bacteria in the
activated sludge process is realized by subjecting the
mixed liquor suspended solids to alternating aerobic
and anaerobic conditions (EPA, 1993b). In the
anaerobic stage, phosphorus is released from the
bacterial biomass. Subsequently, luxury uptake of
phosphorus by microorganisms occurs in a vigorously
aerated and mixed aerobic zone of this sequential
process (Crites and Tchobanoglous, 1998; Barak and
162
M.J. Sharrer et al. / Aquacultural Engineering 36 (2007) 159–176
van Rijn, 2000; EPA, 1993b). An alternate mechanism
shows that, in an anaerobic environment, polyphosphate
accumulating organisms (PAOs) convert acetate to
polyhydroxyalkanoates (PHA), with simultaneous
degradation of polyphosphate and release of phosphate
(H3PO4) (Barak et al., 2003). Then, under anoxic
conditions, phosphate is incorporated into cellular mass
and polyphosphate is produced intracellularly (Barak
et al., 2003).
1.3. General experiences MBR systems
Although MBRs in wastewater treatment are a
relatively new tool, their application is rapidly
increasing. In year 2000, approximately 500 MBR
systems were in operation worldwide, of which 66% of
commercial use MBRs were operating in Japan
(Stephenson et al., 2000). The remaining membrane
systems are in North America and Europe (Stephenson
et al., 2000). Applications of MBR technology include
treatment of municipal wastewater, process water from
the food, chemical, dye, agriculture, brewery, and
medical industries. Treatment objectives and performance can differ based upon sludge characteristics and
discharge requirements (Brindle and Churchouse,
2001). Further, MBR systems are commercially
available from a number of suppliers (e.g., Zenon,
US Filter, Enviroquip, Mitsubishi) that utilize flat plate,
hollow fiber, or tubular membrane technologies
(Stephenson et al., 2000).
Past studies employing MBR systems indicate clear
reduction of key wastewater parameters. Viadero and
Noblet (2002), applying a laboratory scale membrane
filter with a 0.05 mm pore size, but with no biological
treatment component, saw removal efficiency of total
suspended solids (TSS) of 94% and COD of 76%.
Babcock et al. (2004) found that in a side-by-side
analysis of four different types of pilot-scale membrane
bioreactor technologies, inlet TSS levels of up to
400 mg/L were reduced to <4 mg/L. Additionally,
Biological Oxygen Demand (cBOD5) removal efficiency was consistently about 99%. Removal of total
nitrogen (TN) was 60–76% and total phosphorus (TP)
removal was in the range of 70–85%. Similarly, in a
large-scale membrane bioreactor system in Porlock,
UK, Churchouse and Brindle (2003) showed comparable removal efficiencies of TSS and cBOD5. In
addition, these researchers showed the capacity of MBR
technology to perform bacterial and viral removal with
a greater than six log reduction in bacteria and three to
five log reduction in viruses reported. In a comparative
analysis of both a CAS system and a MBR, the CAS
system indicated a peak TN removal efficiency of 62%,
while the MBR showed a peak TN removal of 77%
(Soriano et al., 2003). CAS peak COD removal was
85% while MBR COD removal was 96% (Soriano et al.,
2003). A key advantage of the MBR over the CAS is the
ability of the membrane to retain bacteria, which
prevents the entrainment of nitrifiers/denitrifiers in the
effluent (Soriano et al., 2003). Further, while the CAS
requires a biosolids concentration of approximately
0.5% to prevent concentrated floc settling problems, the
MBR can operate at solids concentrations of 2–3%
(Marrot et al., 2004). As a result, the potential for MBRs
to perform wastewater treatment at a finer scale than
traditional wastewater treatment systems is clear. In
scenarios with the need of a water system with the
capacity to reduce key water quality parameters below
stringent threshold levels or for wastewater reclamation,
MBR technology appears to have possible widespread
applications.
1.4. Effects of increased salinity on wastewater
treatment
One particularly challenging aspect of wastewater
treatment is the management of a high salinity effluent.
Specifically, nitrogen compounds may accumulate
because of the potential for inhibition of nitrifying and
denitrifying bacteria (Sakairi et al., 1996). Diverging
conclusions have been reported relating to the impact
of high salinity on the activated sludge process
(Hamoda and Al-Attar, 1995). In a study by Sanchez
et al. (2004), where concentrations from 0 g/L to 60 g/
L NaCl were utilized, a linear decrease was reported in
the rates of both nitritation (NH3 ! NO2À) and
nitratation (NO2À ! NO3À) with increased salinity.
And, Sakairi et al. (1996) reported nitrification rates
approximately six times less at higher salinity
compared to freshwater. In contrast, Hamoda and
Al-Attar (1995) reported no deterioration in the
activated sludge process with NaCl concentrations
of 30 g/L. In a similar study, Dahl et al. (1997)
reported that maximum nitrification rates were
achieved at 20 g/L chloride.
Similar variations associated with the effects of high
salinity on denitrification have been reported. In an
experiment conducted by Yang et al. (1995), utilizing an
up-flow reactor to enhance denitrifying bacterial
growth, nitrate removal at NaCl concentrations of
0 g/L, 10 g/L, 15 g/L, 20 g/L, 25 g/L, and 30 g/L were
tested. Results indicated that denitrification capacity
(%) was reduced to 75% at 20 g/L NaCl and 60% at
30 g/L NaCl when compared to the 0 g/L salinity
M.J. Sharrer et al. / Aquacultural Engineering 36 (2007) 159–176
control. In a similar study using bench-scale sequencing batch reactors, the specific nitrate reduction rate
decreased proportionally with the increase in salinity
(Glass and Silverstein, 1999). Conversely, Sakairi et al.
(1996) detected 100% nitrate removal under seawater
conditions provided that sufficient phosphorus was
available for adenosine tri-phosphate (ATP) generation.
Although little information is available relative to the
impact of increased salinity on phosphorus removal,
Barak and van Rijn (2000) postulated that because the
primary mechanism for phosphorus removal is associated with denitrifying bacteria, similar salinity effects
are likely to be observed. With regard to membrane
exclusion of solids (TSS, bacteria, etc.), which is a
physical screening process, increased salinity is
unlikely to impact their removal. However, this should
be researched to determine if changes in salt
concentrations create unforeseen changes in precipitates or release of cellular by-products that could hinder
permeate flow through the membrane.
1.5. Objective
The objective of this study was to evaluate the
performance of a pilot-plant MBR at treating fish
culture biosolids discharged from an aquaculture
facility and to assess the potential for the return of
processed water for reuse in the fish culture system.
Salinity levels within the MBR system were manipulated to determine the effects of salinity on membrane
filter function. The hypothesis to be tested: increasing
salinity from <0.03 ppt to 32 ppt will have no effect on
MBR performance once the system has been given
sufficient time to re-acclimate to the new conditions.
Specifically, analysis of outlet concentrations and
removal efficiencies of the key water quality parameters
will indicate no reduction in their removal at higher salt
concentrations.
163
2. Materials and methods
2.1. Waste water source
The Membrane Filtration study was conducted at
the Conservation Fund’s Freshwater Institute (Shepherdstown, West Virginia) utilizing the waste stream
emanating from two recirculating aquaculture systems with a total of 35 mtonnes (80,000 lbs) of annual
rainbow trout (Oncorhynchus mykiss) production
(Fig. 1). The first was a partial reuse system that
recirculates 1200–1850 lpm (320–490 gpm) of water
through three 3.66 m (12 ft) Â 1.1 m (3.5 ft) circular
‘‘Cornell-type’’ dual drain culture tanks, which
recycled 85–90% of the total flow (Summerfelt
et al., 2004). The recycled flow was collected and
filtered through a rotating drum filter (Model RFM
3236, PRA Manufacturing Ltd., Nanaimo, British
Colombia, Canada) equipped with 90 mm filter
screens. The second wastewater source originated
from a fully recirculating fish grow out system that
contained a single 9.1 m (30 ft) Â 2.4 m (8 ft) tank
that recycled approximately 4800 lpm (1250 gpm) of
water (Davidson and Summerfelt, 2005). The entire
water flow through the system was collected and
filtered by a rotating drum filter (Model RFM 4848,
PRA Manufacturing Ltd., Nanaimo, British Colombia, Canada) equipped with 90 mm filter screens.
Backwash effluent from both rotating drum filters
drained into a below ground equalization tank located
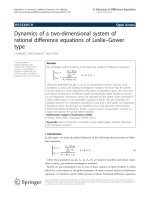
external to the fish culture facility (Fig. 1). Process
water fed into the MBR system via the equalization
tank was controlled by a pump and float switch
system. When the water level in the equalization tank
reached a specified depth, a float switch activated a
pump, which then fed wastewater into the MBR
system (Fig. 1). To achieve the desired flow through
the MBR, any excess wastewater flow pumped from
the equalization tank was diverted to an off-line
settling basin.
Fig. 1. Schematic indicates the flow path of drum filter backwash flows from fish culture systems to the membrane biological reactor (MBR).
164
M.J. Sharrer et al. / Aquacultural Engineering 36 (2007) 159–176
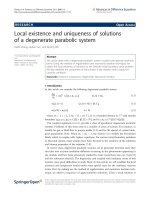
Fig. 2. Drawing indicates location and orientation of the main components of the MBR system.
2.2. Membrane biological reactor system
The MBR system (Enviroquip, Austin, TX, USA)
tested (Fig. 2) contained two reactor tanks; one that was
maintained in an anoxic state while the other was aerobic.
The design of the MBR system was generally based upon
the modified Ludzack–Ettinger single sludge process
(EPA, 1993a). However, the clarifier unit used in the
Ludzack–Ettinger design is replaced in this process by a
membrane filter submerged in the mixed liquor. The
anoxic tank, dimensions 2.6 m (8.5 ft diameter) Â 2.4 m
(8 ft tall), provided 6760 L (1790 gal) of operating
capacity and received the flow from the equalization
tank. The aerobic tank, dimensions 1.5 m (5 ft diameter) Â 3.0 m (10 ft tall), provided 5050 L (1340 gal)
of operating capacity and contained the submerged
membrane unit (Kubota Manufacturing, Japan), which is
capable of extracting 22.6 m3/day (6000 gal/day) of
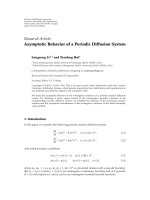
permeate from the mixed liquor solution. The rack of 50
Kubota plate membranes provided a total membrane
surface area of 40 m2 (Fig. 3). Overall flux through the
membrane rack was set at <0.57 m3/day m2 surface area.
The membranes provided a 0.4 mm nominal pore size,
which becomes even finer as biofilm coats the membrane.
A Goulds (Seneca Falls, NY) 1/3 hp pump recycled
approximately 54.5 m3/day of the mixed liquor from the
anoxic tank to the aerobic tank. Overflow from the
aerobic tank gravity fed into the anoxic tank to complete
the water recirculation loop. Aeration was provided
by a five horsepower Model-11 Dresser Roots blower
Fig. 3. Parallel orientation of the membrane plates and tubing directing flow of processed water through permeate manifold.
Fig. 4. Rolling action of the MLSS in the aerobic tank illustrates the
continuous air scouring of membranes provided by course bubble
aeration.
M.J. Sharrer et al. / Aquacultural Engineering 36 (2007) 159–176
(Turnbridge, Huddersfield, England). Aeration rate
below the membranes was never allowed to drop below
5.5 m3/min in order to provide continuous bubble
scouring of the membranes (Fig. 4). Dissolved oxygen
concentration was continuously monitored in the aerobic
tank using a Danfoss Evita Oxy dissolved oxygen meter
(Loveland, CO). A Proportional Integral Derivative
(PID) control of blower speed was provided by an Allen
Bradley SLC 500 programmable controller (Milwaukee,
WI). Aeration rate was adjusted with a PID controller to
maintain a dissolved oxygen concentration of approximately 2.0 mg/L. The anoxic tank was not aerated so as to
maintain dissolved oxygen concentrations of less than
0.5 mg/L. Concentration of mixed liquor suspended
solids (MLSS) within the anoxic and aerobic tanks was
maintained at approximately 18,000–30,000 mg/L by
periodic (approximately bi-weekly) biosolids removal.
Permeate water was pulled through the submerged
membrane unit by a Webtrol centrifugal pump (Weber
Industries, St. Louis, MO). The membrane was operated
24 h daily with a repeat cycle of 9 min of permeate flow
followed by 1 min of relaxation in order to maintain a
relatively low trans-membrane pressure differential. An
automated 20-min air-scouring event at an aeration rate
of 12–13 m3/min was programmed to occur nightly to
reduce build up of excess biofilm on the membranes.
2.3. Sampling regime
Water samples were taken from three sampling ports
in the MBR system (Fig. 5). The first was located at the
inlet into the anoxic tank from the equalization tank and
was used to evaluate the characteristics of the incoming
wastewater. The second sampling site was from the
overflow pipe connecting the anoxic and the aerobic
tanks. This site was sampled primarily for suspended
solids in order to maintain a desired mixed liquor
165
volatile suspended solids (MLVSS) concentration. The
third sampling site was located after the submerged
membrane unit in the effluent permeate line. This was
done in order to compare water quality characteristics of
the effluent to the influent water.
Salinity levels within the membrane biological
reactor system were manipulated by adding salt (NaCl)
into the anoxic tank. Specifically, a Meyers Mini Salt
Spreader (Cleveland, OH) mounted above the anoxic
tank added a Mix-n-Fine (Cargill Salt, Minneapolis,
MN) salt into the system via a timer control mechanism,
which allowed for hourly addition of salt. Salinity levels
in both the anoxic tank and MBR effluent were
monitored daily (recorded in parts per thousand) with a
YSI (Yellow Springs, OH) Model 30 Handheld Salinity,
Conductivity, and Temperature System to ensure that
the correct salinity was maintained. Salinity levels that
were investigated were approximately 0 ppt, 8 ppt,
16 ppt, and 32 ppt. MBR operation began in May 2004
and was managed under freshwater conditions at a
Hydraulic Loading Rate (HLR) of 13.6 m3/day until
study initialization. The experiment was conducted
from 26 October 2004 to 22 June 2005 (239 days) at a
HLR of 6.8 m3/day. Ten sets of data points at each level
of salinity were collected, once treatment across the
MBR had reached quasi-steady-state conditions. Time
periods for data collection once quasi-steady-state
conditions were reached at each treatment were days
225–261, 267–303, 420–442, and 448–464 for 0 ppt,
8 ppt, 16 ppt, and 32 ppt salinity, respectively.
2.4. Water quality parameters analyzed
The three sampling sites were tested for a series of
water quality parameters (Table 1). Methods were
assessed based upon salinity interference. Seawater is
indicated as a source of interference when applying
Fig. 5. Schematic indicates sampling ports and the flow of wastewater within the membrane biological reactor system.
166
M.J. Sharrer et al. / Aquacultural Engineering 36 (2007) 159–176
Table 1
Laboratory methods used for each water quality parameter (APHA, 1998), units expressed, and sampling locations
Parameter
Method
Units
Sampling
location
Salinity
Dissolved oxygen (DO)
pH
Alkalinity
Total nitrogena,b,c
Total ammonia nitrogenb,c,d,e
Nitrogen-nitrited,e
Nitrogen-nitrateb,d,e
Organic nitrogena,b
Total kjeldahl nitrogenb
Total phosphorusb,c,e
Total suspended solidsc,d
Total volatile solidsb,c
cBOD5 b
Total coliformb
Total heterotrophs b
YSI Model 30 Handheld
Hach Model HQ10LDO
YSI Model 60 Handheld pH Meter
Standard Methods 2320
Calculated
Standard Methods 4500-NH3
Standard Methods 4500-NO2
Standard Methods 4500-NO3
Calculated
Standard Methods 4500-Norg
Standard Methods 4500-P
Standard Methods 2560
Standard Methods 2560
Standard Methods 5210 5-day BOD
Hach membrane filtration method 8074
Hach membrane filtration method 8242
ppt
mg/L
pH
mg/L (as CaCO3)
mg/L
mg/L (as NH3-N)
mg/L (as NO2-N)
mg/L (as NO3-N)
mg/L
mg/L (as TKN-N)
mg/L
mg/L
mg/L
mg/L
cfu/100 mL
cfu/mL
1–3
1–3
1–3
1, 3
1, 3
1, 3
1, 3
1, 3
1, 3
1, 3
1, 3
1–3
1–3
1, 3
1, 3
1, 3
a
b
c
d
e
Calculated based upon values obtained for total kjeldahl nitrogen, total ammonia nitrogen, nitrite, and nitrate.
Removal efficiency calculated.
Analysis of variance performed.
Standard additions performed to assess error associated with salinity.
Analyzed with a DR4000/U spectrophotometer.
Standard Methods 4500-NH3 for total ammonia
nitrogen (TAN) (APHA, 1998). To calculate error,
standard additions were performed on the effluent
samples at the higher salinities, indicating 75%
recovery at 32 ppt salinity. As a result, at the higher
salinities, reported effluent TAN concentrations are
potentially low by 25%. Seawater is also indicated as a
source of interference when applying Standard Methods
4500-NO3 to assess nitrate nitrogen (APHA, 1998).
Standard additions were performed on the effluent
samples at the higher salinities to calculate error, which
indicated 50% recovery at 32 ppt salinity. Consequently, reported high salinity effluent nitrate–nitrogen
concentrations are potentially low by 50%. The Hach
HQ10 LDO meter used to measure dissolved oxygen in
the test were compensated for salinity. Enumeration of
heterotrophic and total coliform bacteria was conducted
at sampling sites #1 (inlet) and #3 (effluent). During
each sampling event, two or three replicates were
assayed for total heterotrophic bacteria and total
Coliform bacteria at both sampling sites. Heterotrophic
bacteria were assessed utilizing Hach membrane
filtration method 8242 using m-TGE Broth with TTC
indicator. After incubation, colonies were counted with
a low-power microscope and reported in number of
colony forming units (cfu) per 1 mL sample. Similarly,
coliform bacteria were analyzed using Hach Membrane
Filtration method 8074 (m-Endo Broth). Colonies were
counted with a low-power microscope and reported in
cfu per 100 mL sample. No indication of interference is
attributed to high salinity when applying either bacteria
enumeration method (APHA, 1998).
Data were collected and compiled for assessment
based upon the treatment efficiency of the MBR at each
of the salinity levels. Each of the water quality
parameters are expressed in terms of their mean
Æ standard error. Removal efficiencies of each key
water quality parameter are calculated (i.e.,
((inlet À outlet)/inlet) Â 100) and compared based
upon salinity level (Table 1). An analysis of variance
(ANOVA) was conducted separately for the most
interesting quality parameters (Table 1) in order to
determine statistical differences in the mean effluent
concentrations at each salinity level. Specifically, four
mean outlet concentrations were calculated representing each of the salinity concentrations (e.g., TSS mean
in mg/L at 0 ppt, 8 ppt, 16 ppt, 32 ppt) and analyzed for
differences in the means.
2.5. Activated sludge process assessment
The mean cell residence time (uc) or sludge age and
the food to microorganism ratio (F:M) are two common
parameters that can provide insight into the design and
control of an activated sludge process (Metcalf and
Eddy, 1991). A high mean cell residence time and a low
M.J. Sharrer et al. / Aquacultural Engineering 36 (2007) 159–176
167
F:M will produce a lower sludge yield (Stephenson
et al., 2000). Mean cell residence time for the MBR
system was calculated (Eq. (7)) based upon Stephenson
et al. (2000) as follows
uc ¼
V rX
Qw X w þ Qe X e
(7)
where uc is the mean cell residence within the MBR
system (days), Vr the MBR system volume (m3/day), X
the concentration of volatile suspended solids in the
MBR system (mg/l), Qw the waste sludge removed (kg/
day), Xw the concentration of volatile suspended solids
in the waste sludge (mg/l), Qe the treated effluent
flowrate (m3/day) and Xe is the concentration of volatile
suspended solids in the treated effluent (mg/l).
The food to microorganism ratio was calculated
according to Metcalf and Eddy (1991) (Eq. (8)) as
follows
F:M¼
S0
uX
(8)
where F:M is the food to microorganism ratio (dayÀ1),
S0 the inlet cBOD5 (mg/l), u the hydraulic detention
time based on the MBR system volume = Vr/Qe (days),
and X is the concentration of volatile suspended solids
in the MBR system (mg/l).
3. Results and discussion
3.1. MBR operation experience
We found that a key advantage to the MBR system
was its relative ease of operation and lack of extensive
maintenance requirement. The automated monitoring
features allow for minimal personnel commitment.
Specifically, dissolved oxygen requirements were
maintained under optimum conditions over monthslong time periods by the dissolved oxygen monitor and
the proportional integral derivative (PID) controller.
Moreover, float switches in the anoxic tank allow the
MBR to maintain proper depth, processing permeate
water and ‘‘requesting’’ drum filter backwash flows
from the equalization tank as needed. Membrane
fouling is automatically mitigated through programmable logic controller (PLC) procedures in which daily
membrane air scouring events prevent excessive build
up of biological material. Further automation of
optimized permeate flux through the membranes
involves the ability to program permeate pump run/
relax cycling. A 9 min run followed by a 1 min relax
cycling of the permeate pump allows flux of processed
water through the membranes for 9 min with relaxation
Fig. 6. Trans-membrane pressure (TMP) over the course of the study
and chemical cleaning events with (1) sodium hypochlorite and (2)
HCl. Membrane flux was 0.2 lpm/m2 membrane surface area.
and air scouring for 1 min. This automated process
sustains membrane flux over extended periods with
little operator involvement (Fig. 6).
Operator maintenance duties were minimal. Daily
checks were required to ensure proper function of
critical components (pumps, mixer, and blower unit),
verify manufacturer’s recommended trans-membrane
pressure range, and confirm dissolved oxygen levels in
both the aerobic and anoxic tanks. Approximately
weekly solids removal events from the MBR system
were performed to maintain MLSS within the desired
range. In particular, this 15-min procedure involved
diverting recycle pump flow from the aerobic tank into a
settling cone for later land application. Uninterrupted
MBR use was maintained throughout the solids removal
procedure. Bi-annual chemical membrane cleaning to
reduce biofouling and CaCO3 precipitation is recommended by the manufacturer and was confirmed by
experience (Fig. 6). Membrane fouling was monitored
by periodically recording the trans-membrane pressure
(TMP) value at the end of a 9-min permeate pumping
cycle. The TMP is actually a vacuum pressure that is
produced as the permeate pump suctions water out of
the membrane. A mean TMP of 1.4 Æ 0.1 psi was
observed over the course of the experiment. Fig. 6
illustrates TMP trend over the course of the experiment
and indicates membrane chemical cleaning events. In
situ chemical cleaning was simultaneously performed
on all membrane cartridges with a solution gravity fed
to the membranes from an external tank. A 189 L
(50 gal) 0.5% sodium hypochlorite solution was used to
reduce biofouling on two separate occasions, while a
single 189 L (50 gal) 5% hydrogen chloride solution
was used to dissolve inorganic scaling. A 1–2 h
interruption of MBR operation was necessary to
perform chemical cleaning. Further, no negative effect
168
M.J. Sharrer et al. / Aquacultural Engineering 36 (2007) 159–176
on microbiological removal capacity was observed
subsequent to chemical cleaning of the membranes,
confirming claims of the membrane system supplier.
Membrane cleaning procedures were found to be simple
and effective.
During the experiment, solids removal events were
performed every 6.8 Æ 0.7 days with a mean volume
removed of 1.49 Æ 0.1 m3. Mean concentration of
MLVSS in the sludge removed was 18,857 Æ 628 mg/L
and a mass MLVSS removed of 27.7 Æ 1.9 kg/event,
resulting in a rate MLVSS removed of 7.5 Æ 1.6 kg/day.
Using Eq. (7), a mean solids detention time (uc) of
64 Æ 8.0 days was calculated. Because the mass of
TVSS flushed out of the MBR within the permeate flow
was negligible (i.e., 0.1 kg/day) relative to the mass of
TVSS retained by the membrane (i.e., 27.7 Æ 1.9 kg),
the product of treated effluent flow rate times the
concentration of volatile suspended solids in the treated
effluent (QeXe) was negligible and assumed to be zero.
Using Eq. (8), the mean F:M ratio was calculated as
0.029 dayÀ1. Typical waste treatment plants that
process municipal wastewater and utilize a CAS system
have a mean cell residence time of 3–15 days and a F:M
ratio of 0.05–1.0 dayÀ1 (Metcalf and Eddy, 1991). MBR
technology has the ability to operate at mean cell
residence time of 6.2 days to >100 days and F:M ratios
in the range of 0.05–0.15 dayÀ1 (Stephenson et al.,
2000). Comparing the F:M ratio used in the present
study to that recommended by others indicates that the
MBR could have been loaded with two to six times
more cBOD5 and would have remained within
acceptable F:M ratio.
Over the course of the experiment, mean dissolved
oxygen concentrations (DO) were 3.2 Æ 0.3 mg/L in
the aerobic tank and 0.11 Æ 0.02 mg/L in the anoxic
tank. In our experience, the MBR works best when fully
loaded with all waste solids coming from the drum filter.
This is because the membranes require a minimum
aeration rate below the membranes to scour them clean
and lower cBOD5 loading rate reduces oxygen demand.
Ideally, the MBR is operated to maintain a DO
concentration of 2 mg/L in the aerobic membrane tank
and a DO of near 0 mg/L in the anoxic tank. If cBOD5
loading on the MBR is too low, then this minimum
aeration rate is higher than is required for cBOD5 removal
and the dissolved oxygen concentration increases to
4–6 mg/L in the aerobic tank. This can create a problem
when the oxygenated water is recirculated back to the
anoxic tank, because it will raise the DO in the anoxic
tank and the higher DO can reduce denitrification. In
addition, the MBR is operated at a mixed liquor volatile
suspended solids (MLVSS) concentration of 15,000–
30,000 mg/L. So the membranes are always seeing a high
solids loading. Therefore, pre-treating the backwash flow
does not make sense, because the inlet TSS is only about
1000 mg/L, which is much lower than the MLSS around
the membranes.
Mean alkalinity in the MBR was 275 Æ 5 mg/L in the
inlet and 305 Æ 5 mg/L in the permeate, indicating
recovery of alkalinity across the waste treatment system.
Theoretical stoichiometry indicates that for every 1g of
NH4+-N consumed by nitrifying bacteria 7.1 g alkalinity
(as CaCO3) are destroyed, and for every 1 g NO3À-N
consumed by denitrifiers 3.57 g alkalinity (as CaCO3) are
produced (EPA, 1993a). There was little nitrate entering
the MBR, but a NO3À-N concentration of only 10 mg/L
would have explained the net production of alkalinity
measured across the MBR system. We speculate that the
array of micro-biological pathways that were involved in
the conversion of the waste protein to TAN to cell mass to
nitrite or nitrate may have accounted for this net increase
in alkalinity across the MBR.
The MBR system footprint (153 m2), including
working room around the equipment, was small relative
to the fish culture facility footprint (1829 m2), resulting
in an 8.4% space requirement for MBR treatment of
Table 2
TSS and TVS removal at all conditions
Salinity (ppt)
0
8
16
32
TSS
Inlet (mg/L) Æ S.E.
Outlet (mg/L) Æ S.E.
Removal (%)
1688 Æ 302
0.3 Æ 0.1
99.98 Æ 0.01
1732 Æ 436
1.2 Æ 0.2
99.90 Æ 0.2
1357 Æ 296
1.3 Æ 0.1
99.83 Æ 0.03
754 Æ 64
2.5 Æ 0.7
99.65 Æ 0.1
TVS
Inlet (mg/L) Æ S.E.
Outlet (mg/L) Æ S.E.
Removal (%)
1380 Æ 246
0.1 Æ 0.04
99.99 Æ 0.0
1454 Æ 357
0.4 Æ 0.1
99.96 Æ 0.0
1144 Æ 257
0.2 Æ 0.04
99.97 Æ 0.01
642 Æ 55
0.3 Æ 0.1
99.96 Æ 0.01
M.J. Sharrer et al. / Aquacultural Engineering 36 (2007) 159–176
biosolids compared to total area for fish culture. Further,
the ability to site the MBR in a location removed from
the fish culture facility allows for biosolids treatment
and water reclamation in a biosecure setting.
3.2. Total suspended solids
Operated at a MLSS concentration of 15,000–
30,000 mg/L over the course of the experiment, the
MBR showed highly efficient removal (>99%) of TSS
and TVS at all salinity levels (Table 2). Even visual
inspection of water quality showed profound differences (Fig. 7). Mean outlet concentrations of TSS at
0 ppt, 8 ppt, 16 ppt, and 32 ppt were 0.3 Æ 0.1 mg/L,
1.2 Æ 0.2 mg/L, 1.3 Æ 0.1 mg/L, and 2.5 Æ 0.7 mg/L,
respectively. And, outlet TVS concentrations were
0.1 Æ 0.04 mg/L, 0.4 Æ 0.1 mg/L, 0.2 Æ 0.04 mg/L,
and 0.3 Æ 0.1 mg/L, respectively. An analysis of
variance (ANOVA) conducted across the salinities
indicated significant difference ( p < 0.001, a = 0.05) in
mean TSS outlet concentrations. However, post hoc
analysis utilizing Fisher’s PLSD showed no difference
( p = 0.4261, a = 0.05) in mean outlet TSS concentration when comparing means at 8 ppt and 16 ppt salinity.
A slightly reduced capacity for solids removal was
statistically significant at increased salinity. A possible
explanation for increased TSS concentrations in
permeate flow may be that elevated salinity can have
a negative effect on membrane integrity and solids
removal potential. However, further research with
regard to this mechanism needs to be conducted.
Alternatively, this occurrence may be related to
ordinary membrane deterioration over the course of
the experiment.
3.3. Bacteria removal
The membrane biological reactor was also efficient
at exclusion of bacteria from permeate flow at all
treatment levels (Table 3). Treatment efficiencies of
total heterotrophs ranged from 2 to 5.6 log10 removal
169
over the course of the experiment. Results indicate total
heterotroph bacteria counts in the permeate ranged from
2 cfu/mL to 121 cfu/mL. Removal efficiencies of total
coliform ranged from 3.2 to 7.0 log10 removal at the
four treatment levels. Further, total coliform bacteria
counts in the permeate ranged from 0 cfu/mL to 80 cfu/
mL over the course of the experiment. Bacteria in the
permeate could have been either the result of biofilm regrowth in the permeate piping or a hole or tear in the
membrane.
Further investigation of the bacteria enumeration
procedures for total heterotrophs and total coliform and
the potential error associated with analysis under
seawater conditions indicate that results are precise
relative to freshwater samples. According to Standard
Methods—Method 9222 (APHA, 1998), the membrane
filter (MF) technique is highly reproducible and useful
for monitoring bacteria counts in natural water systems,
including saline water. Standard Methods (APHA,
1998) does refer to utilization of a buffered solution
when analyzing samples containing high concentrations
of heavy metals. However, this is not relevant with
regard to water samples high in Na+ ions.
3.4. Biochemical oxygen demand removal
Results indicate that the MBR system was highly
efficient at removing cBOD5 under all of the conditions
tested (Table 4). Outlet concentrations were consistently low during all salinity trials. Specifically, mean
cBOD5 outlet concentrations ranged from 0.6 mg/L to
1.3 mg/L for all the trials. Mean cBOD5 removal
exceeded 99.8% at all salinity levels (Table 4). As a
result, evidence suggests that increased salinity had no
effect on the cBOD5 removal capability of the
heterotrophic microorganisms in the MLSS. A coupled
cBOD5 removal/denitrification process is evident in the
anoxic/aerobic sequence of the MBR system. Facultative denitrifiers utilize NO3À to metabolize exogenous
carbon (as influent cBOD5), and sufficient C/N ratios
are necessary to drive this process (EPA, 1993a).
Fig. 7. Water quality change in outlet vs. inlet water.
170
M.J. Sharrer et al. / Aquacultural Engineering 36 (2007) 159–176
Table 3
Removal of total heterotrophs and total coliform in the MBR system
Salinity (ppt)
0
8
16
Total heterotrophs
Inlet (cfu/mL) Æ S.E.
Outlet (cfu/mL) Æ S.E.
Removal (%)
3.4E+6 Æ 1.3E+6
68 Æ 26
99.993 Æ 0.004
1.2E+6 Æ 5.3E+5
121 Æ 70
99.95 Æ 0.02
1.5E+6 Æ 5.8E+5
8Æ1
99.997 Æ 0.001
1.7E+6 Æ 9.1E+5
2Æ1
99.9998 Æ 0.0001
Total coliform
Inlet (cfu/100 mL) Æ S.E.
Outlet (cfu/100 mL) Æ S.E.
Removal (%)
1.4E+7 Æ 5.2E+6
1Æ1
99.996 Æ 0.004
1.0E+7 Æ 4.9E+6
80 Æ 38
99.94 Æ 0.05
1.3E+7 Æ 5.5E+6
1 Æ 0.4
99.99999 Æ 0.00001
5.7E+6 Æ 1.4E+6
0 Æ 0.2
99.9998 Æ 0.0001
Research indicates that cBOD5/TKN ratios of 8.7 and
11.9 correspond to nitrogen removals rates of 66% and
83%, respectively (EPA, 1993a). The high inlet
cBOD5 from drum filter backwash flows in this
experiment (Table 4) resulted in a cBOD5/TKN ratio
of approximately 15 and facilitated the coupled
cBOD5 removal/denitrification process. We observed
TN removal rates of 89.5–95.5% (Table 5), indicating
comparable removal efficiency across the salinity
treatments.
32
3.5. Nitrogen removal
The MBR system performed similarly with regard to
the removal of nitrogen under all conditions tested
(Table 5), provided that a sufficient acclimation period
to the increased salinity was allowed. Although TAN
removal percentages varied based upon inlet concentrations, mean outlet concentrations were consistently
low. Specifically, mean outlet TAN concentrations were
1.4 Æ 0.7 mg/L, 1.8 Æ 0.3 mg/L, 0.9 Æ 0.1 mg/L, and
Table 4
Efficiency of cBOD5 removal by the MBR at all conditions
Salinity (ppt)
cBOD5
Inlet (mg/L) Æ S.E.
Outlet (mg/L) Æ S.E.
Removal (%)
0
8
16
32
1075 Æ 145
1 Æ 0.9
99.996 Æ 0.004
1583 Æ 410
1.3 Æ 0.03
99.91 Æ 0.02
930 Æ 281
0.7 Æ 0.1
99.87 Æ 0.04
372
0.6
99.84
Table 5
Removal of TAN, TN, and organic nitrogen in the MBR system
Salinity (ppt)
0
8
16
32
TAN
Inlet (mg/L) Æ S.E.
Outlet (mg/L) Æ S.E.
Removal (%)
4.1 Æ 0.7
1.4 Æ 0.7
57.4 Æ 19.2
1.9 Æ 0.3
1.8 Æ 0.6
13.7 Æ 22.8
4.5 Æ 2.5
0.4 Æ 0.1
78.3 Æ 6.6
Total nitrogen
Inlet (mg/L) Æ S.E.
Outlet (mg/L) Æ S.E.
Removal (%)
68.4 Æ 12.9
3.9 Æ 1.3
91.8 Æ 2.9
67.3 Æ 3.6
3.1 Æ 0.7
93.0 Æ 2.0
62.4 Æ 22.4
2.6 Æ 0.4
93.9 Æ 1.0
50.7 Æ 5.7
2.0 Æ 0.2
95.5 Æ 0.6
Organic nitrogen
Inlet (mg/L) Æ S.E.
Outlet (mg/L) Æ S.E.
Removal (%)
63.4 Æ 12.6
1.8 Æ 0.8
95.6 Æ 1.9
63.4 Æ 14.8
0.9 Æ 0.1
97.9 Æ 0.5
57.3 Æ 19.9
1.3 Æ 0.2
96.7 Æ 0.7
46.0 Æ 5.4
0.01 Æ 0.01
99.98 Æ 0.02
2.6 Æ 0.4
2 Æ 1.2
28.1 Æ 42.0
M.J. Sharrer et al. / Aquacultural Engineering 36 (2007) 159–176
2.0 Æ 1.2 mg/L at 0 ppt, 8 ppt, 16 ppt, and 32 ppt,
respectively. Analysis of variance (ANOVA) indicates
that there was no significant difference between the four
mean TAN outlet concentrations ( p = 0.5437,
a = 0.05). Additionally, results indicate that the MBR
system was efficient at removing total nitrogen, which
was accomplished without supplemental carbon substrate addition. Analysis of the TN outlet concentrations
also indicates efficient removal. In particular, mean
outlet TN concentrations were 3.9 Æ 1.3 mg/L,
3.6 Æ 0.7 mg/L, 3.5 Æ 0.7 mg/L, and 2.0 Æ 0.2 mg/L
at 0 ppt, 8 ppt, 16 ppt, and 32 ppt, respectively. Analysis
of variance (ANOVA) indicates that there was no
significant difference between the four mean TN outlet
concentrations ( p = 0.5855, a = 0.05) at the four
treatment levels. The removal percentages of organic
nitrogen were 95.6 Æ 1.9, 97.9 Æ 0.5, 96.7 Æ 0.7, and
99.98 Æ 0.02 at 0 ppt, 8 ppt, 16 ppt, and 32 ppt,
respectively.
A microbiological turnover period was observed as
nitrifying bacteria (NH3 ! NO3) acclimated to salinity
increasing from 8 ppt to 16 ppt. A prolonged bacterial
acclimation period under freshwater conditions was
conducted prior to collecting data at 0 ppt salinity.
When salinity within the MBR was increased to 8 ppt,
no reduction in nitrogen removal capacity was observed
(Fig. 8), indicating little to no effect on nitrifying
bacteria. However, when salinity was increased from
8 ppt to 16 ppt, a 110-day acclimation period to the new
condition was necessary before steady-state nitrification
171
was achieved. Fig. 8 indicates changes in permeate TAN,
nitrate-nitrogen, and nitrite-nitrogen concentrations over
the course of the experiment. Data indicate that
ammonia-oxidizing bacteria are vulnerable to increased
concentration in salinity beyond 8 ppt. Specifically,
results suggest that the transition from 8 ppt to 16 ppt
salinity causes a decrease in the Nitrosomonas spp.
population. Similar observations were made by Chen
et al. (2003) when analyzing nitrifier response to
increased salinity. Chen et al. (2003) reported that
specific nitrification rate (mg-N/g MLVSS/h) decreased
when chloride concentration was increased from
10,000 mg chloride/L to 20,000 mg chloride/L. A 4week acclimation period was needed for saline adapted
ammonia oxidizers to build up. Hovanec and DeLong
(1996) suggest that with regard to Nitrosomonas spp.,
ammonia-oxidizing bacteria in freshwater aquaria are a
different species from ammonia-oxidizing bacteria in
seawater aquaria. Therefore, it is likely another species of
ammonia-oxidizing bacteria was cultivated in the
membrane biological reactor before complete nitrification could recover. Additionally, with reference to
Nitrobacter spp., several subdivisions of Proteobacteria
are capable of nitrite oxidation (Hovanec and DeLong,
1996). As a result, a possible account for uninterrupted
nitrite uptake is explained by evidence of a consortium of
bacteria proficient at nitrite oxidation at a wide range of
salinities. Alternatively, continued NO2À uptake at
increasing salinity may have been (at least in part) due
to direct conversion to N2 by denitrifying heterotrophic
Fig. 8. Changes in TAN, NO3À-N, NO2À-N concentrations in the permeate over the course of the experiment and the bacterial acclimation period
needed at increased salinity.
172
M.J. Sharrer et al. / Aquacultural Engineering 36 (2007) 159–176
it is possible that increased TAN utilization was coupled
with carbon amendment.
Volatilization of gaseous NH3 due to vigorous
aeration in the aerobic tank is not considered a
significant mechanism for ammonia removal under
the conditions tested. Temperature conditions in the
MLSS ranged from 16.6 8C to 22.3 8C while pH ranged
from 7.13 to 7.48 over the course of the experiment.
And, according to Piper et al. (1982), these conditions
would result in a percent of unionized ammonia (NH3)
in the mixed liquor ranging from 0.37% to 1.43%,
which would not allow for significant stripping of NH3.
Fig. 9. TAN, NO3À-N, NO2À-N concentrations during MBR start up.
3.6. Phosphorus removal
bacteria. In either scenario, bacteria capable of withstanding changes in salinity may have performed further,
compensatory nitrite uptake.
The significant increase in permeate TAN concentration observed during the transition from the 8 ppt
salinity trial to the 16 ppt salinity trial was initially
considered to be similar to the transient spike in TAN
that can occur during startup of a nitrifying bacteria
population within a more traditional biofilter, i.e., where
an initial spike in the concentration of TAN is followed
by a subsequent peak in nitrite and then by an increase
in nitrate. However, the transition from the 8 ppt salinity
trial to the 16 ppt salinity trial did not produce an
appreciable increase in nitrite or nitrate concentrations.
To explain these results, we hypothesize that the
heterotrophic bacteria responsible for denitrification
were not inhibited by the increase in salinity, whereas
the autotrophic nitrifying bacteria were inhibited, at
least to some extent. In comparison, when the MBR was
first started-up, the TAN, nitrite, and nitrate concentrations never conclusively spiked—outside of one data set
that was collected some 60 days later (Fig. 9). We think
that the rapidly growing population of heterotrophic
bacteria incorporated a large portion of the TAN that
was released when the protein in the waste solids
degraded within the MBR. Further, in order to reduce
foaming during start up, sugar was introduced as a
carbon source to facilitate bacterial growth. As a result,
A marked reduction in phosphorus removal by the
MBR system was observed at increased salinity
(Table 6). The outlet concentration of phosphorus at
0 ppt salinity was 1.5 Æ 0.3 mg/L. However, outlet
concentrations at 8 ppt, 16 ppt, and 32 ppt salinity were
8.2 Æ 0.5 mg/L, 6.2 Æ 0.3 mg/L, and 6.2 Æ 0.5 mg/L,
respectively. Analysis of variance (ANOVA) indicates a
significant difference exists between mean outlet
concentrations ( p < 0.0001, a = 0.05). Data suggest
that elevated salinity inhibited luxury phosphorus
uptake. The enhanced biological phosphorus removal
(EBPR) process by de-nitrifying bacteria in the
activated sludge was suppressed. Reduced removal at
all elevated salinities was seen regardless of prolonged
acclimation periods. Houghton et al. (1971) also
observed inhibition of phosphorus uptake at elevated
salinity. They observed dramatically reduced phosphorus removal in the activated sludge process at 10 ppt
salinity when compared to 1 ppt salinity. The sodium
ion (Na+) was thought to be responsible for the
phenomenon, because similar results were seen when
either NaCl or NaHCO3 were added to the activated
sludge (Houghton et al., 1971). An alternative saline
aquaculture effluent nutrient removal technology
evaluated by Lymbery et al. (2006) utilizing a halophyte
plant (Juncus krausii) cultivated in an artificial wetland
also indicated reduced phosphorus removal capacity at
Table 6
Phosphorus removal at all conditions
Salinity (ppt)
Total phosphorus
Inlet (mg/L) Æ S.E.
Outlet (mg/L) Æ S.E.
Removal (%)
0
8
16
32
57.2 Æ 14.4
1.5 Æ 0.3
96.1 Æ 1.0
38.7 Æ 8.6
8.2 Æ 0.5
72.7 Æ 3.5
24.6 Æ 4.9
6.2 Æ 0.3
70.4 Æ 2.3
19.2 Æ 1.9
6.2 Æ 0.5
65.2 Æ 5.4
M.J. Sharrer et al. / Aquacultural Engineering 36 (2007) 159–176
elevated salinity (31 ppt). The authors postulated that
since adsorption to soil binding sites provided the bulk
of the phosphorus removal capability, binding sites
became saturated over time. Further, the halophyte plant
is adapted to estuarine conditions (20 ppt salinity) and
exhibits reduced growth at higher salinities (Lymbery
et al., 2006).
Optimization of the biological phosphorus removal
process would likely be increased with the incorporation of an anaerobic reactor, which would select for
phosphorus accumulating organisms (PAOs) in an
environment low in DO, NO2À, and NO3À and limit
competition from heterotrophic denitrifiers for carbon
substrate (Reddy, 1998; EPA, 1993a; Metcalf and Eddy,
1991; Albertson, 1983). A potential retrofit of the MBR
process used for this experiment might include a preanoxic anaerobic reactor in which PAOs would receive
the highest carbon levels in the form of inlet cBOD5.
The anaerobic reactor would gravity flow into the
anoxic tank. In addition, a small recirculated flow would
be required to provide low DO/low NO3À MLSS from
the anoxic to the anaerobic tank. However, consideration should be given to the competing requirements of
combined biological nitrogen and phosphorus removal
processes. Specifically, a high cBOD5:TP ratio (>20:1)
will ensure sufficient substrate is available for PAOs in
the anaerobic reactor while also maintaining carbon for
denitrifiers in the anoxic reactor, preventing accumulation of NO3À in the anaerobic reactor (EPA, 1993a). In
this experiment, the cBOD5:TP ratio was approximately
28:1, indicating sufficient carbon is available to drive
both processes. Consideration should also be given for
competing optimal sludge detention times (uc) of a
combined nutrient removal strategy. Efficient phosphorus removal is realized at a shorter uc relative to
nitrogen removal. As a result, an activated sludge
system should be operated at the shortest uc possible that
still achieves effluent nitrogen requirements (EPA,
1993a).
3.7. Alternative aquaculture biosolids reclamation
technologies
A range of technologies are currently available that
have the capacity to dewater concentrated biosolids flows
from fish culture systems and allow reclamation of the
resulting supernatant or permeate flow, each of which
have their own positive and negative attributes. Typically,
the concentrated backwash from recirculating aquaculture systems is treated to dewater and concentrate the
waste biosolids. A belt filter de-watering apparatus
employing a coagulation/flocculation technique has the
173
potential to effectively remove TSS and soluble
phosphorus from drum filter backwash flows while
showing significant removal of total nitrogen and cBOD5
(Ebeling et al., 2006). Also, geotextile tubes (constructed
of a porous, woven polyethylene material) utilizing a
similar polymer addition technique indicated effective
TSS, TP, and TN removal (Schwartz et al., 2004). The
most common dewatering method is simply to use a
settling basin that has been sized to provide an extended
biosolids storage period that allows the settled solids to
compact (Chen et al., 1997), but the supernatants
overflowing these gravity thickening tanks are high in
suspended solids and dissolved wastes and would require
further treatment before discharge or reuse (Brazil and
Summerfelt, 2006). Vertical flow created wetlands have
also been used to effectively dewater the solids contained
in the backwash discharged from pilot-scale (Summerfelt
et al., 1999) and full-scale aquaculture applications, but
have the same disadvantages of the previously listed
technologies. All of these systems possess the advantage
of low energy consumption relative to the MBR system.
However, the MBR is capable of waste treatment at a
much finer scale, particularly with regard to removal of
bacteria and dissolved wastes, such as cBOD5, nitrate,
and ammonia. Additional research has been conducted
specific to denitrification in marine RAS in an effort to
maximize water reuse capabilities. In a literature review
by van Rijn et al. (2006), denitrification reactors
operating within the recirculating loop have been
implemented on a limited and experimental basis.
Specifically, packed bed, moving bed, and fluidized
bed denitrifying reactors utilizing a variety of substrate
media and carbon sources indicate the potential for
incorporation of denitrification reactors within RAS.
However, nitrate removal rates in these systems are
varied, which necessitates further study for proper design
of denitrifying reactors (van Rijn et al., 2006).
An application of denitrification within a closed
marine recirculating aquaculture system utilizing the
high concentration of sulfate in seawater in combination
with the dissolved organic matter released by digestion
of waste biosolids to drive autotrophic assimilation of
nitrogen is described by Tal and Schreier (2004).
Specifically, gilthead seabream (Sparus aurata) were
raised in two 4.2 m3 tanks operated with a 2.0 m3
moving bed bioreactor for nitrification with a side-loop
fixed bed denitrification reactor (1.0 m3). In the side
loop, biosolids were collected from the backwash of a
microscreen drum filter and digested in a sludge
collection unit, which fed the anaerobic denitrification
reactor. Results indicated that nitrate levels in this
experimental system peaked at 35–45 mg/L NO3-N
174
M.J. Sharrer et al. / Aquacultural Engineering 36 (2007) 159–176
while a control fish culture system (operated without a
denitrification side loop) reached a concentration of
102 mg/L NO3-N (Tal and Schreier, 2004). Adding a
waste biosolids digester and denitrification reactor to a
closed seawater RAS can effectively retain seawater,
producing a near zero-exchange system that was shown
to be effective at low to moderate fish culture densities.
Although this internal sludge digestion and denitrification approach is a practical alternative to MBR
technology, it does add cost, complexity, and increased
footprint to each RAS. Further, the internal biosolids
digestion and denitrification technologies must also be
distributed to every RAS and cannot be located in a
single centralized location, as is the case for the MBR. If
the internal biosolids digestion and denitrification
technologies were centrally located to treat the biosolids
discharge from multiple RAS, the treated water would
pose a biosecurity threat if the flow were returned to
each of the separate RAS, because this technology does
not provide microbial exclusion.
The turnkey MBR system installed at Conservation
Fund’s Freshwater Institute, designed to treat
6000 GPD (23 m3/day), cost approximately $80,000.
An MBR system designed to treat wastewater from a
commercial scale aquaculture facility (approximately
450 mtonnes/year), would have to treat approximately
260 m3/day of backwash flow for reclamation, assuming a total recirculating water flow of 87,000 m3/day
and a 0.3% backwash flow (87,000 Â 0.003 = 260 m3/
day). A turnkey MBR system sized to reclaim this flow
would cost approximately $470,000, not including cost
of enclosing the system. Annual operating cost (at
$0.08 kWhÀ1) is estimated at $20,000 (50% for
electrical, 30% for sludge hauling, and 20% for labor)
(Brian Codianne, Enviroquip, Austin, TX). Indeed, this
is a significant capital investment. However, the
potential exists with MBR technology to treat effluent
to within stringent standards and combines the
opportunity of reusing saline water in a marine fish
culture system.
4. Conclusions
The potential of membrane biological reactors for
reclaiming saline water from the biosolids backwashed from marine recirculating aquaculture systems is apparent. The MBR performed exceptionally
well during this study. The physical exclusion of TSS
and bacteria (total heterotrophs and total coliform)
from the MLSS was nearly complete. Further, the
associated cBOD5 was almost completely removed.
Biological treatment of nitrogen through nitrification/
denitrification indicated consistent removal of total
nitrogen at all treatment levels, provided that
sufficient acclimation to each salinity level was given.
On the other hand, phosphorus removal did appear to
be reduced at the three higher salinity levels.
Additional research will be necessary to investigate
the implications of increased salinity on phosphorus
removal.
Further treatment of the reclaimed water processed
by the MBR system may be necessary based upon the
intended use. Temperature regulation with heat
exchangers may be needed in order to adjust reused
water to the appropriate temperature conditions.
However, if an objective of applying this technology
is the culture of warm water finfish, then the
conservation of heat in the membrane biological reactor
process can be viewed in terms of an economic benefit.
Supplementary disinfection of reclaimed water through
UV irradiation and/or ozonation prior to reuse in a fish
culture system might also be appropriate in order to
ensure complete sterilization of potential fish pathogens. Although fixed and variable costs for the MBR
system used for this experiment were relatively high,
broader application of this technology in the future will
likely result in a cost reduction.
Acknowledgements
Funding for this research was provided by the
Agriculture Research Service of the United States
Department of Agriculture, under agreement no. 591930-1-130. We would like to thank Michael Gearheart,
Susan Glenn, Christine Marshall, and Angela Crone for
their assistance with water quality analyses, and Brian
Mason, Daniel Coffinberger and Frederick Ford for
their assistance setting up and modifying the research
system.
References
Aboutboul, Y., Arviv, R., van Rijn, J., 1995. Anaerobic treatment of
intensive fish culture effluents: volatile fatty acid mediated denitrification. Aquaculture 133, 21–32.
Albertson, O.E., 1983. Nutrient Control. Water Pollution Control
Federation, Washington, DC.
American Public Health Association (APHA), 1998. Standard Methods for the Examination of Water and Wastewater, 20th ed.
APHA, Washington, DC.
Babcock, R., Chun, W., Arakaki, G., Strom, H., Tanimoto, R., 2004.
Side-by-side comparison of four different membrane bioreactor
technologies in Hawaii. In: Proceedings of the 77th Annual Water
Environment Federation Technical Exhibition and Conference.
New Orleans, LA, October 2–6. Water Environment Federation,
Alexandria, VA (CD-ROM).
M.J. Sharrer et al. / Aquacultural Engineering 36 (2007) 159–176
Barak, Y., van Rijn, J., 2000. Biological phosphate removal in a
prototype recirculating aquaculture treatment system. Aquacult.
Eng. 22, 121–136.
Barak, Y., Cytryn, E., Gelfand, I., Krom, M., van Rijn, J., 2003.
Phosphorus removal in a marine prototype, recirculating aquaculture system. Aquaculture 220, 313–326.
Beeman, R.E., Reitberger, J.H., 2003. An integrated industrial management facility for biological treatment of high nitrate and
carbonaceous wastewater. Environ. Prog. 22 (1), 37–45.
Brazil, B.L., Summerfelt, S.T., 2006. Aerobic treatment of gravity
thickening tank supernatant. Aquacult. Eng. 34, 92–102.
Brazil, B., 2004. Application of denitrification in aquaculture. Aquacult. Mag. 30 (4), 44–47.
Brindle, K., Churchouse, S., 2001. The Application of a Flat Plate
Submerged Membrane Bioreactor to Industrial Wastewater Treatment. Cranfield University, Bristol, UK.
Chen, S., Coffin, D.E., Malone, R.F., 1997. Sludge production and
management for recirculating aquaculture systems. J. World
Aquacult. Soc. 28, 303–315.
Chen, G.H., Wong, M., Okabe, S., Watanabe, Y., 2003. Dynamic
response of nitrifying activated sludge batch culture to increased
chloride concentration. Water Res. 37, 3125–3135.
Churchouse, S., 2001. Long Term Operating Experience with Submerged Plate Membranes. MBR Technology, Trowbridge, Wiltshire, UK.
Churchouse, S., Brindle, K., 2003. Long Term Operating Experience
of Membrane Bioreactors. School of Water Sciences Conference,
Trowbridge, Wiltshire, UK.
Churchouse, S., Wildgoose, D., 1999. Membrane Bioreactors Hit the
Big Time—From Lab to Full Scale Operation. Cranfield University, Bristol, UK.
Crites, R.W., Tchobanoglous, G., 1998. Small and Decentralized
Wastewater Treatment Systems. McGraw Hill Companies.
Dahl, C., Sund, C., Kristensen, G.H., Vrendenbergt, L., 1997. Combined biological nitrification of high salinity wastewater. Water
Sci. Technol. 36 (2/3), 345–352.
Davidson, J., Summerfelt, S.T., 2005. Solids removal from a coldwater
recirculating system—comparison of a swirl separator and a
radial-flow settler. Aquacult. Eng. 33, 47–61.
DiGiano, F.A., Andreottola, G., Adham, S., Buckley, C., Cornel, P.,
Daigger, G., Fane, A.G., Galil, N., Jacangelo, J.G., Pollice, A.,
Rittman, B.E., Rozzi, A., Stephenson, T., Ujang, Z., 2004. Safe
water for everyone. Water Environ. Technol. 13 (6), 31–35.
Ebeling, J.M., Sibrell, P.L., Ogden, S., Summerfelt, S.T., 2003.
Evaluation of chemical coagulation–flocculation aids for the
removal of phosphorus from recirculating aquaculture effluent.
Aquacult. Eng. 29, 23–42.
Ebeling, J.M., Welsh, C.F., Rishel, K.L., 2006. Performance evaluation of the Hydrotech belt filter using coagulation/flocculation aids
(alum/polymers) for the removal of suspended solids and phosphorus from intensive recirculating aquaculture microscreen backwash effluent. Aquacult. Eng. 35, 61–77.
EPA (U.S. Environmental Protection Agency), 1993a. Nitrogen Control Manual. Office of Research and Development, Office of
Water, Washington, D.C.
EPA (U.S. Environmental Protection Agency), 1993b. Phosphorus
Removal. Center for Environmental Research Information, Cincinnati, OH.
Fleischer, J.E., Broderick, T.A., Daigger, G.T., Fonesca, A.D., Holbrook, R.D., Murthy, S.N., 2005. Evaluation of membrane bioreactor process capabilities to meet stringent effluent nutrient
discharge requirements. Water Environ. Res. 77 (2), 162–178.
175
Glass, C., Silverstein, J., 1999. Denitrification of high nitrate, high
salinity wastewater. Water Resourc. 33 (1), 223–229.
Gunder, B., 2001. The Membrane Coupled Activated Sludge Process
in Municipal Wastewater Treatment. Technomic Publishing Company Inc., Lancaster, PA.
Hagopian, D.S., Riley, J.G., 1998. A closer look at the bacteriology of
nitrification. Aquacult. Eng. 18, 223–244.
Hamoda, M.F., Al-Attar, M.S., 1995. Effects of high sodium chloride
concentrations on activated sludge treatment. Water Sci Technol.
31 (9).
Houghton, W.H., Gottfried, R.J., Sinclair, N.A., Yall, I., 1971. Metabolic factors affecting enhanced phosphorus uptake by activated
sludge. Appl. Microbiol. 22 (4), 571–577.
Hovanec, T.A., DeLong, E.F., 1996. Comparative analysis of nitrifying bacteria associated with freshwater and marine aquaria. Appl.
Environ. Microbiol. 62 (8), 2888–2896.
Karimi, A.A., Adhami, S., Tu, S.C., 2002. Evaluation of membrane
filtration for Los Angeles’ open reservoirs. J. Am. Water Works
Assoc. 94 (12), 120–128.
Lymbery, A.J., Doupe, R.G., Bennett, T., Starcevich, M.R., 2006.
Efficacy of sub-surface flow wetland using the estuarine sedge
Juncus krausii to treat effluent from inland saline aquaculture.
Aquacult. Eng. 34, 1–7.
Marrot, B., Barrios-Martinez, A., Moulin, P., Roche, N., 2004. Industrial wastewater treatment in a membrane bioreactor. Environ.
Prog. 23 (1), 59–68.
Metcalf and Eddy Inc., 1991. Wastewater Engineering, Treatment/
Disposal/Reuse, 3rd ed. McGraw Hill, New York, NY.
Piper, R.G., McElwain, I.B., Orme, L.E., McCraren, J.P., Fowler, L.G.,
Leonard, J.R., 1982. Fish Hatchery Management. Department of
the Interior, U.S. Fish and Wildlife Service, Washington, DC.
Reddy, M., 1998. Biological and Chemical Systems for Nutrient
Removal. Water Environment Federation, Alexandria, VA.
Sadick, T., Semon, J., Palumbo, D., Keenan, P., Daigger, G., 1996.
Fluidized bed denitrification: meeting potential nitrogen limits in
Long Island Sound. Water Environ. Technol. 8 (8), 81–85.
Sakairi, M.A.C., Yasuda, K., Matsumora, M., 1996. Nitrogen
removal in seawater using nitrifying and denitrifying bacteria
immobilized in porous cellulose carrier. Water Sci. Technol. 34
(7/8), 267–274.
Sanchez, O., Aspe, E., Marti, M.C., Roeckel, M., 2004. The effect of
sodium chloride on the two step kinetics of the nitrifying process.
Water Environ. Res. 76 (1), 73–80.
Schwartz, M.F., Ebeling, J., Summerfelt, S., 2004. Geotextile tubes for
aquaculture waste management. In: Proceedings of the Fifth
International Conference on Recirculating Aquaculture. Virginia
Polytechnic Institute and State University, Blacksburg, VA.
Soriano, G.A., Erb, M., Garel, C., Audic, J.M., 2003. A comparative
pilot scale study of the performance of conventional activated
sludge and membrane bioreactors under limiting operating conditions. Water Environ. Res. 75 (3), 225–231.
Stephenson, T., Judd, S., Jefferson, B., Brindle, K., 2000. Membrane
Bioreactors for Wastewater Treatment. IWA Publishing, Padstow,
Cornwall, UK.
Summerfelt, S.T., Adler, P.R., Glenn, D.M., Kretschmann, R., 1999.
Aquaculture sludge removal and stabilization within created wetlands. Aquacult. Eng. 19 (2), 81–92.
Summerfelt, S.T., Davidson, J., Waldrop, T., Tsukuda, S., BebakWilliams, J., 2004. A partial–reuse system for coldwater aquaculture. Aquacult. Eng. 31, 157–181.
Summerfelt, S.T., 1999. Waste handling systems. In: Bartali, E.H.,
Wheaton, F.W. (Eds.), CIGR Handbook of Agricultural Engineer-
176
M.J. Sharrer et al. / Aquacultural Engineering 36 (2007) 159–176
ing, vol. II: Animal Production and Aquacultural Engineering.
American Society of Agricultural Engineers, St. Joseph, MI,
(Chapter 13), pp. 309–350.
Tal, Y., Watts, J.E.M., Schreier, H.J., 2005. Anaerobic ammonia
oxidizing bacteria and related activity in Baltimore inner
harbor sediment. Appl. Environ. Microbiol. 71 (4), 1816–
1821.
Tal, Y., Schreier, H.J., 2004. Dissimiliatory sulfate reduction as a
process to promote denitrification in marine recirculating aquaculture systems. In: Proceedings of the Fifth International Conference on Recirculating Aquaculture. Virginia Polytechnic
Institute and State University, Blacksburg, VA.
Tal, Y., Schreier, H.J., Yechezkel, E., van Rijn, J., 2004. Characterization and abundance of anaerobic ammonia oxidizing (anammox) bacteria in biofilters of recirculating aquaculture
systems. In: Proceedings of the Fifth International Conference
on Recirculating Aquaculture. Virginia Polytechnic Institute and
State University, Blacksburg, VA.
Van der Bruggen, B., Vandecasteele, C., Van Gestel, T., Doyen, W.,
Leysen, R., 2003. A review of pressure driven membrane processes. Environ. Prog. 22 (1), 46–56.
van Rijn, J., Tal, Y., Schreier, H.J., 2006. Denitrification in recirculating systems: theory and applications. Aquacult. Eng.
van Rijn, J., Fornarev, N., Berkowitz, B., 1995. Anerobic treatment of
intensive fish culture effluents: digestion of fish feed and release of
volatile fatty acids. Aquaculture 133, 9–20.
Viadero, R.C., Noblet, J.A., 2002. Membrane filtration for removal of
fine solids from aquaculture process water. Aquacult. Eng. 26,
151–169.
Yang, P.Y., Nitisoravut, S., Wu, J.Y.S., 1995. Nitrate removal using a
mixed culture entrapped microbial cell immobilization process
under high salt conditions. Water Res. 29 (6), 1525–1532.