Particle size distribution in the tilapia recirculating aquaculture system
Bạn đang xem bản rút gọn của tài liệu. Xem và tải ngay bản đầy đủ của tài liệu tại đây (1.9 MB, 54 trang )
1
Particle size distribution in the Tilapia Recirculating Aquaculture
System
By
Jelena Stokic
Master thesis (30 credits)
Department of Mathematical Sciences and Technology
University of Life science in Ås, Norway
April, 2012
2
ACKNOWLEDGEMENTS
It is a pleasure to thank to all those who made this thesis possible.
In the first place I would like to thank my supervisor Bjørn Frode Eriksen, for his great supervision,
excellent guidance, advice, useful comments and patience from the very first stage of my thesis until
its end, enabled me to develop an understanding of the subject, and who provided the necessary
location and equipment to accomplish the laboratory work for my thesis in the Tilapia laboratory of
UMB. Thank you very much for being understandable and flexible person considering my part time
job which helped me to stay in Norway and complete my master thesis.
I gratefully acknowledge to Odd-Ivar Lekang from the Department of Mathematical Sciences and
Technology of UMB, who with his rich scientific knowledge of aquaculture engineering crucial
contributed and supervised in completion of my thesis.
Many thanks go to Bjørn Reidar Hansen also from the Department of Mathematical Sciences and
Technology of UMB who provided me with a lot of productive information and ideas crucial for the
discussion part and for being an excellent model in some of pictures I have made for my thesis.
I would like to thank my fellows for their support and encourage with their best wishes.
Finally, special thanks go to my parents and my elder brother who have been my greatest inspiration
and who have always been by my side, supporting me when I was feeling down and helped me get
through very hard period I had in Norway far away from them.
3
ABSTRACT
This study was to evaluate methods for measuring and describing particle size distribution from three
different spots in Tilapia recirculating system at University of life science in Ås, Norway. For this
purpose serial filtration over different mesh size and parallel filtration over different mesh size
methods were compared. Water samples were taken from before drum filter, after drum filter and
after bio-filter (MBBR) and filtrated through eight different mesh size classes and calculated in mg
suspended solids per liter (mgSS/l). Serial method is telling about suspended solids between two
filter sizes, while parallel method tells about suspended solids bigger of a given filter size. Each
filtering method was done three times in three different days. Results of serial filtration showed large
difference in mgSS/l between days, especially between 0, 45 – 10 µm. Small particles (< 30 µm) are
dominating in both methods. Water before drum filter contains a lot of large particles which are
reduced after treatment in the drum filter. First and third days of serial filtration were more effective
for the total suspended solids (TSS) after drum filter, unlike the second day which showed no
decrease of TSS after drum filter: 9, 71 mgSS/l before drum filter, and 10 mgSS/l after drum filter.
In the first day TSS before drum filter was 23, 58 mgSS/l and after drum filter it was reduced to 8, 8
mgSS/l. In the third day experiment showed 27, 73 mgSS/l before drum filter, and 14, 37 mgSS/l
after drum filter. Water after Moving Bed Biofilm Reactor (MBBR) resulted in increase of TSS in
the first two days, whilst the third day showed reduction of TSS value.
Parallel filtration method can be calculated as comparing samples, same as serial filtration method.
This way of calculations of parallel filtration gave negative values for some of the particle size
groups which bring into question the accuracy of the method. More further developing of methods
are needed in order to get accurate results.
Keywords: Evaluating the methods; suspended solids; particle size distribution; recirculating
aquaculture system.
4
TABLE OF CONTENTS
1
INTRODUCTION ........................................................................................................................ 6
1.1
Background for the experiments ................................................................................................. 7
1.1.1 Mechanical methods for particles removal ............................................................................. 7
1.1.1.1 Settling techniques (sedimentation) ................................................................................. 8
1.1.1.2 Mechanical filters and Screening (micros-screening)...................................................... 8
1.1.1.2.1 Drum filter .................................................................................................................. 9
1.1.1.3 Fine filtration techniques (membrane filtration) ............................................................ 11
1.2
Features of solids ...................................................................................................................... 12
1.3
Describing the recirculation system (RAS) .............................................................................. 13
2
MATERIALS AND METHODS ............................................................................................... 15
2.1
Serial filtration .......................................................................................................................... 19
2.2
Parallel filtration ....................................................................................................................... 21
2.3
Serial vs. Parallel ...................................................................................................................... 24
2.4
Calculations............................................................................................................................... 26
3
RESULTS .................................................................................................................................... 27
3.1
Serial filtration .......................................................................................................................... 27
3.1.1 System function at serial filtration ........................................................................................ 27
3.2
Parallel filtration ....................................................................................................................... 33
3.2.1 System function at parallel filtration ..................................................................................... 33
3.3
Results of serial vs. parallel filtration ....................................................................................... 38
5
4
4.1
DISCUSSION .............................................................................................................................. 40
Purification efficiency regarding TSS ...................................................................................... 41
5
CONCLUSION ........................................................................................................................... 44
6
REFERENCES ........................................................................................................................... 45
7
APPENDIX.................................................................................................................................. 48
6
1
Introduction
The aim of this study was to describe particle size distribution at different water treatment spots
in a RAS for Tilapia and to evaluate methods for measuring particles distribution. Two filtrating
methods were used: serial filtration compared to parallel. For this purposes water samples were
taken from three different sampling spots: before drum filter, after drum filter and after Moving
Bed Biofilm Reactor (MBBR). Great importance was the way of calculating as well as making
size classes. These experiments showed the effectiveness of the drum filter and changes in total
suspended solids (TSS) concentration across recirculating aquaculture system (RAS).
Suspended solids in recirculation system mostly depends on type of culture system and its
management, the feed used and size and type of aquatic species cultured (Rijn, 1996). Suspended
solids are result of matter of metabolic origin, residual feed and carcass debris (Brinker and
Rösch, 2005). In recirculating aquaculture system (RAS) they are produced from uneaten feed,
faeces, algae, pathogens and bio-filter cell mass (Bergheim, 2007). Suspended solids are one of
the main components of the effluent from flow-through and open culture systems which require
treatment and improving water quality (Cripps, 1995). In flow-through facilities suspended
solids can pose severe ecological problems, where the waste is discharged directly into the
environment (Brinker and Rösch, 2005). Removing solids waste material from the water in
recirculation system must be conducted continuously. Very small solids remain suspended in the
water. Decomposition of these solids consume oxygen and produce ammonia, thus the low level
of suspended solid may help in protection fishes’ gills as well as stimulating the growth of
microorganisms (Masser at.al., 1999). The importance of solids removal lie in the fact that
particles cause gill damage and reduces fish resistance to diseases, also reduce growth rates and
induce mortality, clogging of biological filters, increase biochemical oxygen demand and
mineralization to produce ammonia (McMillan et. al. 2003). The aim of removing of fine solids
from the recirculation aquaculture system (RAS) is to improve water quality and fish health and
thus enhance production yield and decrease cost (Viadero and Noblet, 2002). Furthermore, high
levels of organic matter in the water inhibit the nitrification rate in the biofilter.
7
Removal of particles can be done by settling techniques (sedimentation), micro-screen filters,
granular media filters, membrane filters and by flotation (Bergheim, 2007).
According to one study of distribution of suspended solids on salmon smolt farms in Sweden and
Scotland, using particle characterization techniques, the majority of numbers of particles were
smaller than 30 µm, and the total of these particles were much lower than infrequently occurring
particles larger than 30 µm (Cripps and Bergheim, 2000). In this study much greater reduction of
SS is achieved using smaller pore size such as 60 µm.
1.1
Background for the experiments
This chapter is about earlier studies that are telling about the available methods for particle
removal from recirculation system and measuring its size and distribution. For applying some
method for removing particles, it is necessary to understand the nature of the wastes (Cripps and
Bergheim, 2000). Treatment techniques are to separate particles from the primary effluent flow
(Cripps, 1995). Removal of solids waste is a long-lasting process. It is the most critical process
in RAS (Summerfelt and Penne, 2005).
1.1.1 Mechanical methods for particles removal
Many mechanical methods are available for treatment of waste and removing solids such as
straining, sedimentation, impaction, interception, adhesion, flocculation, chemical and physical
adsorption and biological growth. But the most used mechanical methods are settlement,
screening/filtration and flotation (Bergheim, 2007). According to Cripps and Bergheim the most
popular method of mechanical particle removal in recirculation aquaculture system is by the use
of screens (Cripps and Bergheim, 2000).
8
1.1.1.1 Settling techniques (sedimentation)
Sedimentation is the traditional and widespread method for the removing solids. It is simple to
operate, as well as moderate running costs, but take up a lot of space (Bergheim, 2007). Particle
removal is usual done by settling and mechanical filtration process (Chen et.al. 1993).
Sedimentation is dependent upon flow rate, specific density of the particles and the size of
particles (Johnson and Chen, 2006). Sedimentation is the process where the suspended solids
with a greater density or specific density than water can settle out of suspension and thus be
separated from the main flow (Cripps and Bergheim, 2000). Under the force of gravity, particles
that are heavier than water will fall through the water with increasing speed until it reaches a
terminal value for its settling velocity (Timmons et.al. 2002) and it will not remove fine particles
from the water (smaller than 30µm) because they have low settling velocity that makes
gravitational removal method impractical.
According to these authors denser and larger particles will settle out faster than smaller, less
dense particles. Moreover, the best technique for maintaining large particles is to remove those
particles before any pumping has occurred.
1.1.1.2 Mechanical filters and Screening (micros-screening)
Mechanical filters are designed to remove particles greater than 80 µm, while smaller particles
accumulate (Chen at.al. 1993). Micro-screen filters require minimal labor and space and can treat
large flow rates of water with little head loss (Ebeling et. al. 2005). According to these authors
solids can be removed by virtue of physical restrictions or straining on a media when the mesh
size of a screen is smaller than particles in the wastewater. Solids from the waste are further
processed before final discharge. Solids content will vary based on screen opening size, influent
total suspended solids (TSS) load on the filter. If particles are too big, surface of the screen might
block, so particles have to be removed to avoid blockage (Lekang, 2007). Of huge importance
9
for mechanical filters or screen to be used for removing smaller particles is to prevent blockage.
Solids are removed from the screen by rotating the clogged screen surface with the high pressure
jet of water (Masser at.al. 1999). Two types of screens are available: static and rotary (Lekang,
2007). Rotary screens can be classified by how screens rotate into: axial rotating screen, radial
rotating screen (drum), rotating belt, horizontally rotating disc. Nevertheless the optimal removal
is achieved when the suspended particles are large with a minimum specific gravity. Bergheim
state that beside all advantages of micro-screen filtration it requires energy and also high
installation costs (Bergheim, 2007).
1.1.1.2.1 Drum filter
Drum filter is most commonly used system for filtration in RAS. It consists of rotating gauze
micro-screen through which waste water is passing. For the best drum filter performance
particles should be attached very gently to the filter gauze by hydraulic pressure and lifted out of
the water as the screen rotates. The turbulence should be kept to a minimum because high
turbulence can break the particles. At the drum filter there are two ways of passing the flow.
Those are flow passing from the inside to the outside of the drum filter and from the outside to
the inside. “Outside-in” mechanism has the advantage because of low turbulence and therefore
allows more successful removal of fragile particles (Bergheim, 2007). Typical RAS treatment
system for solids removal usually using micro-screen sieving, such as rotary drum filtration, or
rotary disc screening in a wide range of screen mesh sizes (from 60 to 200 µm) (Viadero and
Noblet, 2002).
10
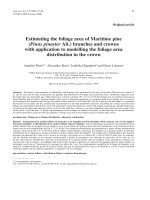
Figure 1: Different types of rotating filters with automatic back-flushing. (A) Upper side of a
disc filter, where radial rotating screens are vertically placed to the water flow direction. (B) A
rotary belt filter where the water passes through the belt, while particles are transported to the
surface. (C) Drum filter with the straining cloths. (D) Part of a drum filter used for back-flushing
the straining cloths (Lekang, 2007)
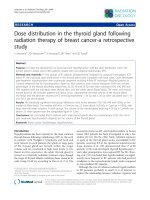
Figure 2. Rotating drum filter. Water enetrs the open end of a drum and passes through the
screen High pressure jet of water (from outside of the drum) washes the solids off the screen and
into an internal collection trough leading to a waste drain (Masser, et.al. 1999). (Picture is
copied from Hidrotech homesite)
11
1.1.1.3 Fine filtration techniques (membrane filtration)
Membrane filtration is using for removal of very fine solids in recirculating system because of
high pressure required and low flow. But it’s highly susceptible to clogging, also highly energy
demand and extremely high head loss (Bergheim, 2007).
There are three different grades of filtration: (Bergheim, 2007)
a) Micro-filtration with 50 nm pore size (macro pores) – is achieved using hydrostatic
pressure difference. This method allows larger dissolved solutes to pass;
b) ultra-filtration with pre size 2-50 nm (mesopores) – also using hydrostatic pressure
difference and along with microfiltration allow the permeation of water and small
molecules.
c) Nano-filtration where is less than 2 nm pore size is used (micro pores) and achieved by
using dense material with smaller pore size.
Microfiltration (MF) can be done in a two ways such as “dead-end” and “cross-flow” mode. In
“dead-end” mode feed flows vertically to the membrane and only clean water leave the filter
housing (Viadero and Noblet, 2002). Particles that are retained on the membrane continue to
accumulate and making a cake on the filter. In cross-flow mode the feed flows passes parallel to
the membrane surface using permeate and retentive stream. By using this mode caking and
clogging are reduced (Berheim, 2007).
Figure 3: Illustration of microfiltration system operating. “Dead - end” filtration (left) and
“Cross - flow” filtration (right) (Viadero and Noblet, 2002)
12
“No perfect method for all aquaculture systems”. All methods have their advantages and
disadvantages. The best solution would be to use multiple treatment methods for particle removal
and thus achieve the optimal results. The effectiveness of all techniques depends on particle size
distribution and specific density of the particles. Bergheim also states that the significant
consideration is the economic viability of different techniques (Bergheim, 2007).
1.2
Features of solids
The most interesting spots in RAS (tilapia fish laboratory UMB) for particle analysis is outlet
pipe from the fish tank (water is taken before comes to drum filter), after drum filter and after
bio-filter. The biggest particles are in the outlet pipeline and come from fish tanks. Tilapia is
herbivore. For their feeding they use plant feed and these particles are not as big as particles from
salmonid production. The more quickly particles are removed from water, the less time they have
to break down and less oxygen they will demand from the culture system. When they become
smaller it is harder to remove from the culture system.
Suspended solids are particles that are trapped on the filter mesh. Two most important
characteristic of suspended solids are: specify density and particle size (Timmons et.al. 2002).
Specific density of the particle depends mostly on their organic nature and that particles originate
from uneaten fish feed, fish excretion, or bacteria grown in the system (Chen et.al. 1993).
Particles of suspended solids originate of feces and uneaten feed, thus they differ in their size and
specific density. Because of that they respond differently on different control mechanisms. As
specific density is determined by the source of the particles, it’s defined as a ration of wet
particles to that in the water (Timmons et.al. 2002). Particle size ranges over less than 1 µm in
diameter to larger particles up to more than 200 µm. Configuration of particles is variable and
they tend to become more complex with size. Even though, large particles have tendency to
become small particles and rapid and efficient removal of the settleable (large > 100 µm)
particles is necessary. Fine particles are more difficult to remove in the system (Timmons et.al.
2002) and (Bergheim, 2007). Very small (fine) particles (< 30 µm) have low settling velocities
13
that make gravitational removal methods impractical, so sedimentation techniques will not
remove these kinds of particles.
1.3
Describing the recirculation system (RAS)
Recirculating Aquaculture System (RAS) is a closed system for rearing fish with efficient water
utilization, independence from climatic conditions and reduced effluent volume (Chen et al.
1993). In RAS it is very important to have adequate water treatment components with proper
functioning to handle solids removal (Pfeiffer et.al. 2008). Recirculating aquaculture systems
provide constant and adjustable rearing medium with slightly and slow variations and minimal
head loss (Blacheton, 2000). The recirculating system was designed to ensure a constant and
stable supply of solid waste to filter tested. RAS is controlled and maintained to enhance the
efficiency and intensity of fish production with no influence by external factors (Steicke, 2007).
The major units in RAS that are considered for the maintenance, is solids removal, ammonia
removal and aeration/oxygenation (Twarowska et.al. 1997). Recirculating aquaculture system
consist of mechanical and biological filtration components, pumps and fish tanks and includes
water treatment for improving water quality and provide disease control within the system
(Hutchinson et.al. 2004).
Fish laboratory at the university has three sections:
-
Feeding lab has 10 tanks each 250 L and 10 tanks each 100 L. All tanks are connected
with reuse system;
-
Reproduction lab has 5 tanks each 400 L, 8 aquariums each 250 L and a hatchery. Of
these only the big 5 tanks are connected to the reuse system; and
-
Water treatment section the most important for this study.
14
The design of RAS tilapia (water treatment section) (Figure 4) includes drum filter (removal of
big particles), bio-filter (to remove ammonia), air blower (to aerate the water and keep the biofilter media moving), circulating pump and electric heaters. The bio-filter is built as a “Moving
Bed Biofilm Reactor”. In recirculation system for tilapia more than
flow is an average
l min and water temperature is
of water is reused. he
. he total water volume in RAS is
7000 L (Table 1). Each tank has an individual aerator to keep oxygen at an acceptable level for
some hours if the circulating pump or the central air blower fails. Oxygen, pH and temperature
are measuring continuously and the total ammonia nitrogen (TAN) and nitrite (NO2) are
measuring every second week (Fish laboratory information).
Figure 4: Main components of recirculating system (RAS) tilapia at UMB: fish rearing tanks,
component for mechanical water treatment (drum filter, model HDF 501 – 1H), component for
biological treatment (bio-filter, MBBR) and pump.
15
Table 1: Operation data for the tilapia reuse system during 2010 (Fish laboratory information)
Temperature
26°C
Oxygen, inlet fish tanks
85-90% saturation
pH
6.8-7.2
TAN
0.2-0.4 mg/l
Nitrite (NO2)
0.4-0.8 mg/l
Biomass
150 kg
Flow
150 l/min
2
Materials and methods
This experiment was conducted using filtrating method. The aim was to indicate particle size and
distribution in tilapia recirculating system in order to achieve better water quality and better fish
production and their health on the first place.
The work was done in the RAS units of the fish laboratory located at the University of the Life
Science in Ås, Norway.
Water samples were taken for particle size analyses at three different locations or spots in the
RAS:
From the outlet pipe from the fish tank (before drum filter)
16
After drum filter (before biofilter) and
After biofilter.
First experiment was filtrating water from fish tank outlet pipe. The aim of such filtration was to
find particles and determine their distribution and size before they come through drum filter. It is
preferable for mechanical filtration to be as close as possible to the outlet of fish tank in order to
avoid breaking the larger, more easily removed particles into smaller particles (Blancheton,
2000).
Particles in the fish tank resulting from food and feces produced by fish. With water they come
to drum filter, where that water going to be filtrated and normally some amount of particles
accumulate to the walls of pipe. Water stay in the pipe because the fish tank is situated on the
higher level than the water treatment system, which means drum filter, bio-filter and pump that
pumping water up to the fish tank again. Drum filter is on the lower level than fish tank and that
difference is 10 cm thus the water is always in the pipe. Particles in that water are attached to the
pipe walls. This fact is very important for taking samples. When taking a sample, the principle is
to let that “old” water out by tilting the tube down in order to get “fresh” water with the “fresh”
particles. Particles that are in the pipe before the water flow out 1 minute are not a good indicator
of the actual state of the particles in the fish tank. To determine size and frequency of distribution
prior to their entry into the drum filter it need to let water flowing out 1 minute. Particles in the
pipe will sediment when velocity is lower than 0, 5 m/s. Letting water out velocity will increase.
After drum filter water sample is taken by putting the canister under the water source that comes
from outlet pipe from drum filter (Figure 10). For the filtering water samples after MBBR,
canister is submerged into the water after MBBR (Figure 12).
In this study two different experiments were compared. Two basically different filtrations
include different amount of water. These are:
1. Filtration in series. In this experiment 15 liters of water were used: 5 liters from
each spot.
17
2. Filtration in parallel. 5 liters of water were used for each spot (40 l in total for
whole experiment).
3. Filtration series vs. parallel, combination of serial and parallel filtration. In total
45 liters are used and only one location was used in experiment.
Equipment used in this study:
Plastic buckets 5 liters volume
Filters cloths , round 200 µm, 120, 90, 60, 30, 20, 10 µm pore size (supplied by
HydroTech AB)
Glass micro fiber filter 0, 45 µm for fine particles (GF/C, company Whatman) with
good flow rates, high loading capacity and retention of very fine particles
Erlenmeyer form
-
Erlenmeyer bottle, 100 ml capacity (or collecting bottle, 1 L) with side-arm socket
-
Glass-filter unit with glass filter plate for all membrane filters.
-
Top for the glass filet unit with the flange 200 ml
-
Electric pump for supporting the vacuum
Digital drying scale for particle analysis (company Ohaus , model MB45). Scale has
accuracy of 0,001 g, 0, 01% moisture and capacity 45g. Also, provide information about
% of solids, time, temperature, weight, and drying curve.
18
Figure 5: Filtering setup: glasses with the filter plate, Erlenmeyer bottle with side-arm socket
and electric pump for supporting the vacuum.
Figure 6: Digital drying scale for particle analysis (company Ohaus , model MB45) for
calculating the weight of residue retained on the filter. Scale has the accuracy of 0,001 g
(1,0mg), 0, 01% moisture and capacity 45g. Also, provide information about % of solids, time,
temperature, weight, and drying curve (left) and Glass micro fiber filter 0,45 µm for fine
particles (GF/C, company Whatman) with good flow rates, high loading capacity and retention of
very fine particles (right.)
19
2.1
Serial filtration
The experiment was conducted using filtrating method. Serial filtration was done in a three
different days and then calculated in average for a given location. First day was 22. October,
second day was 23. October and third day was 24. October 2011. For this study water samples
were taken from three spots: before water comes to the drum filter (Figure 7), after water
treatment through drum filter (Figure 10) and after water treatment in bio-filter (Figure 12). All
three spots covered one day experiment. Samples were collected by piping out the water into the
bucket or canister. In experiment before drum filter, water is taken by tilting tube down (outlet
pipe from the fish tank) and letting the water flow out 1 minute. That is to pipe clean out of
particles that stay in the pipe longer time. After that time 5 liter canister was put under the tube
and filled with the water. After drum filter water sample is taken by putting the canister under the
water source that comes from outlet pipe from drum filter. For the filtering water samples after
bio-filter, canister is submerged into the water after bio-filter. After taking samples, before it
starts with filtering, it is significant to carefully stir the water. This is because the large particles
would be raised from the bottom and mixed with other particles over the entire surface. If the
mixing water not done, large particles would remain on the bottom and thus would not get
correct results on distribution and size of particles passing through or that remain on filter of a
certain mesh size. In the bucket, water stirring is done by carefully taking water with hand from
the bottom to top, so the entire amount of water is mixed together. Also, if the water is in
canister, slightly turn it up and down several times water is stirring and particles are mixing
together. Mixing of water is necessary not only to do before filtering, but also several times
during the operation. Stirring must be very carefully because turbulence that occur in rough
stirring of water contributes to break down of suspended solids into smaller ones.
Water samples were taken at the same time in three canisters, each 5 L contains, taken from each
spot: 5 L from outlet pipe (before drum filter), 5 L after drum filter and 5 L after a bio-filter.
The whole process of filtering in serial was divided into three parts: before drum filter, after
drum filter and after bio-filter. All three parts contain the same amount of water. After sample
preparation which involves collecting water into the canisters and stirring the water it is filtered
20
through the filters. Serial filtration is done by using one canister of 5 L water sample from each
spot for all filter sizes. Sample was passed sequentially through a series of eight different pore
size filters; first through 200 µm and 120 µm, then 90, 60, 30, 20, 10 and 0, 45 µm (Figure 8).
Glass fiber filters (GF/C company Whatman) were used to obtain fine particles in the water
sample. Glass fiber filters have good flow rates, high loading capacity and retention of very fine
particles.
Each experiment was conducted in three days to be able to compare results in order to get higher
accuracy of a method. Sample volume used for the suspended solids is ranged from 0,200 to 5 L.
Poured samples were then analyzed for the total suspended solids (mgSS/l). Each filter with
collected solids was put in the drying machine where its weight was measured. To be able to
measure the weight, it must reach 0,500 grams. Usually filters are less than 0,500 g, but adding
distillated water, desired weight can be reached. Before analysis each filter is dried properly and
tare. After filtering, particles were analyzed using a digital drying machine (Ohaus, model
MB45). A well-mixed sample is filtered through a standard glass microfiber filter and the residue
retained on the filter is dried to constant weight (30 sec stable) at
-
.
Digital machine is calculating the weight of residue that retained on the filter in grams, which is
used in calculations for making results (Part 2.4).
Figure 7: Fish tank outlet pipe, spot where the water sample before drum filter is taken (left).
The tube is tilted down and held for 1 minute to “old” water flow out. After that time, 5 l canister
was put under the tube and filled with the water (right).
21
Figure 8: Schematic explanation for the serial filtration for solids analysis. One water sample
(5 L) used for filtration throughout eight different filter sizes.
2.2
Parallel filtration
This experiment was also conducted at fish laboratory using filtrating method. Water was taken
from reuse system from three locations: from outlet pipe from fish tank (before drum filter), after
water treatment in drum filter and after water treatment in the bio-filter. Filtration in parallel was
22
done in three day 1. – 3. November 2011. Samples were collected into canisters each 5 L
contains to provide a total sample volume of 40 L. For this experiment eight different pore size
filters were used: 200 µm, 120, 90, 60, 30, 20, 20, 10 and finally 0, 45 µm for fine particles.
After taking samples, before it starts with filtering, it is significant to carefully stir the water.
This is because the large particles would be raised from the bottom and mixed with other
particles over the entire surface. If the mixing water is not done, large particles would remain on
the bottom and thus would not get correct results on distribution and size of particles passing
through or that remain on filter of a certain mesh size. In the bucket, water stirring is done by
carefully taking water with hand from the bottom to top, so the entire amount of water is mixed
together. Also, if the water is in canister, then slightly turn it up and down several times water is
stirring and particles are mixing together. Mixing of water is not only necessary to do before
filtering, but also several times during the operation. Stirring must be very carefully because
large particles can break.
Parallel filtration was divided into 3 days. Throughout three days of parallel experiment, samples
(8 buckets with content of 5 L water each) were filtered through eight filters pore sizes. Water
was taken from outlet pipe from the fish tank (before drum filter), after drum filter and after biofilter.
Parallel filtration is done by using eight canisters filled up with 5 L water sample in each. It starts
with filtering 5 L water through 200 µm filter, then another 5 L water through 120 µm, 5 L
through 90 µm, 60, 30, 20, 10 and 5 L through 0,45 µm (Figure 9). Thus it shows the amount of
particles on each filter pore size obtained from each 5 L sample.
23
Figure 9: Schematic explanation of parallel filtration. For each filter size new 5 L of water
sample is used for filtration.
Figure 10: Spot where water sample after drum filter is taken (drum filter outlet pipe) (left).
Water sample is taken by putting the canister under the water source that comes from outlet pipe
from drum filter (right).