Effect of dietary protein and lipid levels on
Bạn đang xem bản rút gọn của tài liệu. Xem và tải ngay bản đầy đủ của tài liệu tại đây (607.82 KB, 9 trang )
JOURNAL OF THE
WORLD AQUACULTURE SOCIETY
Vol. 41, No. 6
December, 2010
Effect of Dietary Protein and Lipid Levels on Growth
Performance, Carcass Composition, and Digestive Enzyme
of the Juvenile Spotted Babylon, Babylonia areolata Link 1807
Shu Y. Chi
Laboratory of Aquatic Economic Animal Nutrition and Feed, College of Fisheries, Guangdong
Ocean University, Zhanjiang 524025, China
Qi C. Zhou1
Laboratory of Fish Nutrition, College of Life Science and Biotechnology, Ningbo University,
Ningbo 315211, China
Bei P. Tan, Xiao H. Dong, Qi H. Yang, and Jian B. Zhou
Laboratory of Aquatic Economic Animal Nutrition and Feed, College of Fisheries, Guangdong
Ocean University, Zhanjiang 524025, China
Abstract
This study was undertaken to evaluate the effects of dietary protein and lipid levels on growth
performance, feed utilization, carcass composition, and digestive enzyme activity of the juvenile
spotted babylon, Babylonia areolata. Six experimental diets were formulated to contain three protein
levels (25, 35, and 45%) at two lipid levels (8 and 12%). Triplicate groups of 40 animals (average
weight 5.05 ± 0.08 g) were stocked in 120-L tanks and fed to apparent satiation twice daily for
8 wk. Growth performance and feed utilization were significantly affected by dietary protein and
lipid levels (P < 0.05). Protein efficiency ratio (PER), specific growth rate (SGR), and weight gain
(WG) were the best at 45%/8% treatment (P < 0.05). There was no significant interaction between
different levels of dietary protein and lipid on survival rate and the soft body to shell ratio (SB/SR).
There was an interaction effect between dietary treatments on PER, SGR, and WG, in which shellfish
fed with 45% protein at 8% lipid had the highest interaction (P < 0.05). There was an interaction
effect between dietary protein and lipid levels on pepsin, tryptase, and lipase activities in soft body.
Tryptase enzyme activity of 45%/8% treatment was the lowest and the highest was found in 25%/8%
treatment which also had the highest activity of lipase. Results indicated that the juvenile spotted
babylon would obtain better growth performance when fed with diets containing 45% dietary protein
at 8% dietary lipid.
Members of the genus Babylonia are distributed
in the Indo-Pacific region, of which spotted
babylon, Babylonia areolata, a large marine
gastropod (adult size 50–60 mm) extends from
Sri Lanka and the Nicobar Islands through
the Gulf of Siam, along the Vietnamese and
Chinese coast to Taiwan (Altena and Gittenberger 1981). Juvenile spotted babylon is one
of the most extensively cultured marine mollusks in the Southeast Asian countries, and
1
Corresponding author.
it is the second most economically important
marine gastropods for human consumption in
Thailand (Kritsanapuntu et al. 2009). It is a
carnivore inhabiting the muddy/sandy subtidal zone at depths of 4–20 m (summer) and
40–60 m (winter) (Cai et al. 1995). It was
previously abundant, but declined in number
because of overfishing since the late 1980s. In
recent years, there has been a rapid increase
in market demand for this species in Thailand
and other Asian countries. As a result, this
species has attracted a great interest of shellfish
© Copyright by the World Aquaculture Society 2010
903
904
CHI ET AL.
farmers because of its resistance to handling,
rapid growth, delicious meat, and high market
price (Zhou et al. 2007a). However, a main constraint to spotted babylon culture development
is the limited supply of trash fish or crabs that
are presently the main feed source for growout. The use of formulated feeds for growing
to marketable size would be practical and efficient in terms of labor cost compared with the
present practice of using trash fish as the rearing
diet. The requirement level for dietary nutrients
is the basis for their inclusion levels in the feed
formula. Limited studies have been reported on
the nutrient requirements of spotted babylon
(Ke et al. 1997; Xu 2006; Zhou et al. 2007a,
2007b; Zhang et al. 2009).
Protein is one of the most important nutrient
categories for growth and the most expensive
macrocomponent of fish feed because of its
bulk in the feed formula (National Research
Council 1993). Protein requirements are always
studied in aquaculture species with the aim of
determining the minimum amount requirement
to produce maximum growth. The relevant
studies for shellfish mainly focused on scallop,
abalone, and spotted babylon. Uriarte and
Farías (1999) reported that the postlarvae
of Chilean scallop, Argopecten purpuratus,
showed significantly better growth and survival
when fed with the higher protein diet. For
abalone, some researchers reported that protein
requirements ranged from 20 to 44% (Uki
et al. 1985; Mai et al. 1995; Coote et al. 2000;
G´omez-Montes et al. 2003; Thongrod et al.
2003). As for spotted babylon, the protein
requirements ranged from 25 to 48% (Ke et al.
1997; Xu 2006; Zhou et al. 2007a).
Lipid is one of the important nutrients to
provide energy for mollusk, especially at larval
and juvenile stages. Lipid provides a source
of energy, essential fatty acids and other lipid
classes such as phospholipids, sterols, and fatsoluble vitamins (Watanabe 1982). The optimal
dietary lipid level had been demonstrated
for mollusk species, such as Haliotis discus
hannai (Uki et al. 1985; Mai et al. 1995)
and Haliotis tuberculata (L.) (Mai et al. 1995).
Zhou et al. (2007b) reported that the optimal
dietary lipid requirement for maximum mean
protein gain of juvenile spotted babylon was
about 6.54% of dry diet with 43% crude
protein. Britz and Hecht (1997) reported that
the combination of 34% protein and 2–6% lipid
was optimum for the growth of abalone Haliotis
midae. Therefore, this study was undertaken to
determine the optimal levels of dietary protein
and lipid to support optimum growth response,
body composition, and digestive enzyme of the
juvenile spotted babylon.
Materials and Methods
Diet Preparation
Six diets were formulated to contain three
protein levels (25, 35, and 45%) at two lipid
levels (8 and 12%) for each protein (Table 1).
Fish meal and soybean meal were used as
protein sources. Fish oil/soybean oil (1:1) and
wheat meal were used as lipid and carbohydrate
sources, respectively. Diet ingredients were
ground through an 80-mesh sieve. Lipid and
distilled water (40% w/w) were added to the
premixed dry ingredients and thoroughly mixed
until homogenous in a Hobart-type mixer. The
1-mm diameter pellets were wet extruded using
a pelletizer (Institute of Chemical Engineering, South China University of Technology,
Guangzhou, China), air-dried, and then sealed
in plastic bags and stored at −20 C before use.
Animal Rearing
Juvenile spotted babylon was obtained from
a local shellfish farm (Dongding breeding
farm, Zhanjiang, China). Management was as
described in our previous study (Zhou et al.
2007a). Prior to the start of the trial, juvenile
spotted babylon was acclimatized to a commercial diet (containing 42% crude protein and
6% crude lipid) and was fed twice daily to
apparent satiation for 2 wk. A 2 × 3 factorial
experiment in a completely randomized design
was used. Each experimental diet was randomly
assigned to three tanks. The acclimated spotted
babylon (initial mean weight, 5.05 ± 0.08 g)
was sorted into 18 120-L cylindrical fiberglass
tanks at a stocking density of 40 spotted babylon per tank. Juvenile spotted babylon was fed
to visual satiety twice daily at a rate of 4% wet
905
EFFECT OF DIETARY PROTEIN AND LIPID LEVELS
Table 1. Ingredients and composition of experimental diets (g/kg dry matter).
Diets (protein, %/lipid, %)
Ingredients
Fish meala
Soybean mealb
Wheat mealb
Fish oil/soybean oil (1:1)b
Celluloseb
Mineral mixturec
Vitamin premixd
Squid meale
Lecithine
Calcium dihydrogen phosphatef
Choline chlorideg
Ascorbyl-2-monophosphateh
Sodium alginateg
Composition
Moisture
Gross energy (kJ/g)
Crude protein
Crude lipid
Crude ash
Calcium
Available phosphors
25/8
25/12
35/8
35/12
45/8
45/12
168
147.1
510
37.4
49.7
5.0
5.0
35.5
5.0
15.0
2.0
0.3
20
168
147.1
510
77.8
9.3
5.0
5.0
35.5
5.0
15.0
2.0
0.3
20
323.8
250
240
27.4
71
5.0
5.0
35.5
5.0
15.0
2.0
0.3
20
323.8
250
240
67.6
30.8
5.0
5.0
35.5
5.0
15.0
2.0
0.3
20
500.5
285.8
60
14.8
51.1
5.0
5.0
35.5
5.0
15.0
2.0
0.3
20
500.5
285.8
60
55.2
10.7
5.0
5.0
35.5
5.0
15.0
2.0
0.3
20
106
16.0
249.3
80.7
66.2
12.4
6.7
103
17.6
248.2
120.7
66.2
12.4
6.7
109
15.2
349.7
79.4
96.1
20.9
9.0
102
16.9
355.2
119.2
96.1
20.9
9.0
97
15.2
448.9
79.4
127.8
30.4
11.6
109
16.9
447.7
119.4
127.8
30.4
11.6
a Imported
from New Zealand (g/kg dry matter: protein, 670.5; lipid, 92.0).
from Yuhai Feed Company Ltd., Zhanjiang, China (g/kg dry matter: protein, 430.0; lipid, 19.0).
c
Mineral premix was based on Zhou et al. (2007a). mg/kg: MnSO4 ·H2 O, 10; CuSO4 ·5H2 O, 1; FeSO4 ·H2 O, 4;
ZnSO4 ·7H2 O, 8; Na2 SeO3 , 0.05; KI, 0.2; and CoCl2 ·6H2 O, 0.05.
d
Vitamin premix was based on Zhou et al. (2007a). mg/kg or IU: vitamin A, 2400; vitamin D, 400; vitamin E, 30;
vitamin K (menadione sodium bisulfate), 14; thiamin, 10; riboflavin, 9; pyridoxine, 14; vitamin B12 , 0.008; niacin, 40;
d-calcium pantothenate, 30; folic acid, 2.4; biotin, 0.2; and inositol, 60.
e Purchased from Yuehai Feed Company Ltd., Zhanjiang, China.
f Sichuan Lomon Corporation Phosphorous Co., Sichuan, China.
g China National Medicines Corporation Ltd., Shanghai, China.
h 35% ascorbic acid activity, Hoffmann-La Roche Ltd., Basel, Switzerland.
b Purchased
body weight for 8 wk, 30% of the ration was
fed at 0900 h, and 70% at 1800 h, which was
the start of the dark phase during which most
feeding activity occurs (Liu and Xiao 1998).
Feed consumption was recorded for each tank
and animals were bulk weighed and counted
every 2 wk to adjust the quantity of feed.
Uneaten feed were removed daily before the
next feeding, dried, and weighed to calculate
the feed intake. They were provided with sandfiltered seawater (2 L/min) with continuous aeration. The bottom of each tank was covered
with about 4 cm clean sea sand, which simulated the natural environment that they normally
inhabit. Tanks were thoroughly cleaned and the
sea sand was changed biweekly. Water quality
parameters were monitored daily between 0900
and 1800 h. During the feeding trial, water temperature ranged from 28.5 to 30.5 C, salinity
from 27 to 32 ppt, and pH from 7.8 to 8.0.
Ammonia nitrogen was maintained from 0.02
to 0.03 mg/L and dissolved oxygen was from
6.0 to 6.5 mg/L.
Sample Collection and Chemical Analyses
At the end of the growth trial, spotted babylon was starved 24 h and weighed. A sample of
150 animals at the initiation of the feeding trial
and 20–25 animals per tank at termination were
used for carcass proximate analysis, and then
shell and soft body tissues were individually
weighed for the calculation of soft body to
906
CHI ET AL.
shell ratio (SB/SR) (Mai et al. 1995). Soft
body of spotted babylon was sampled, sealed
in plastic bags, and stored frozen (−20 C)
for the analysis of nutrient composition. Crude
protein, crude lipid, moisture, and ash in diets
and soft body were determined by standard
methods (AOAC 1995). Moisture was determined by oven-drying at 105 C for 24 h. Crude
protein (N × 6.25) was determined by the Kjeldahl method after acid digestion using an Auto
Kjeldahl System (1030-Auto-analyzer, Tecator,
H¨ogan¨as, Sweden). Crude lipid was determined
by ether extraction using a Soxtec System HT6
(Tecator). Ash was determined by muffle furnace at 550 C for 24 h.
Digestible Enzyme Analyses
The soft body of 15 spotted babylon from
each tank was homogenized in 10 volumes
(w/v) of ice-cold double distilled water by
an electric homogenizer (IKA, T-25, Staufen,
Germany). Homogenates were centrifuged at
10,000 g for 30 min at 4 C to analyze protease activity and 1660 g for 20 min at 4 C
to analyze lipase activity, respectively. After
centrifugation, the supernatants were collected
and stored frozen at −70 C until analyzed. The
assays for pepsin and tryptase activity were
measured using the casein hydrolysis method
of Liu et al. (1991) and Pan et al. (2005).
The substrate was 0.5% casein (Sigma, St.
Louis, MO, USA) in citric acid (China National
Medicines Corporation Ltd., Shanghai, China)
buffer (pH 3.0) for pepsin and in borax–sodium
hydroxide (China National Medicines Corporation Ltd.) buffer (pH 9.8) for tryptase. The
reaction proceeded at 37 C for 15 min and
was stopped with trichloroacetic acid (China
National Medicines Corporation Ltd.). Percolate was filtered and mixed with 0.5 mol/L
Na2 CO3 . Color was allowed to develop for
20 min after adding forint-hydroxybenzene. At
20 min, the enzyme activity was calculated
from the light absorption at 680 nm. One unit
of protease activity was defined as 1-μg tyrosine liberated by hydrolyzing casein in 1 min
at 37 C. Lipase activity was determined by the
method of Pan and Wang (1997). Homogenates
were incubated with 2% polyvinyl alcohol
(Sigma, N81384) in 25-mM phosphate buffer,
pH 7.5, containing 25% olive oil (China
National Medicines Corporation Ltd.) as an
emulsifying agent at 40 C for 15 min, and then
15-mL 95% ethanol was added to terminate the
reaction. Two to three drops of phenolphthalein
were added to the solution and a titration action
with 0.05 mol/L sodium hydroxide was performed. Consumed volume of sodium hydroxide was measured when the solution showed
light red. One unit of lipase activity was defined
as the amount of enzyme that catalyzed the
release of 1 μmol of fatty acids in 1 min at pH
7.5 and 40 C. Specific activities were expressed
as enzyme activity per milligram protein.
The protein concentration in homogenates was
determined by Bradford (1976) and bovine
serum albumin (China National Medicines
Corporation Ltd.) as the standard.
Calculations and Statistical Analysis
The parameters were calculated as follows:
Specific growth rate (SGR, %) = (ln Wt −
ln Wi ) × 100/t.
Percent weight gain (WG, %) = 100 × (Wt −
Wi )/Wi .
Protein efficiency ratio (PER) = (Wt − Wi )/
protein intake (g).
Soft body to shell ratio (SB/SR) = Ws /shell
weight (g).
where Wt (g) is final body weight, Wi (g) the
initial body weight, Ws (g) the soft body
weight, and t the experimental duration in day.
Results are presented as mean ± SE of the
three replicates. All data were analyzed using
two-way ANOVA and Tukey’s multiple range
test (Puri and Mullen 1980). All statistical
analyses were performed by SPSS version 13.0
(SPSS, Chicago, IL, USA).
Results
Growth performance and feed utilization of
the juvenile spotted babylon fed with different
dietary protein and lipid levels are shown in
Table 2. There was no significant interaction
907
EFFECT OF DIETARY PROTEIN AND LIPID LEVELS
6
a
4
b
3
2
a
PER
SGR
b
c
c
1
0
25
35
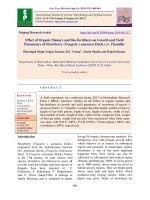
Figure 1. Effect of dietary protein levels on the protein
efficiency ratio (PER) and specific growth rate (SGR) of
juvenile spotted babylon. Regardless of lipid levels, Fig. 1
showed significant differences among protein levels on
PER and SGR. The highest PER and SGR were found
in 45% protein treatments (P < 0 .05 ).
350
a
300
WG%
250
b
150
100
WG
c
50
0
25
a
b
c
a
a
a
35
b
b
Pepsin
Tryptase
Lipase
c
0
25
35
45
Protein levels%
Protein levels%
200
20
18
16
14
12
10
8
6
4
2
45
45
Protein levels%
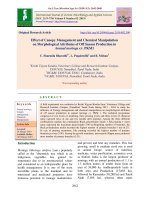
Figure 2. Effect of dietary protein levels on the weight
gain (WG) of juvenile spotted babylon. Regardless of
lipid levels, Fig. 2 showed significant differences among
protein levels on WG, which was found the highest in 45%
protein treatments (P < 0 .05 ).
Figure 3. Effect of dietary protein levels on the digestive
enzyme activities of juvenile spotted babylon. Regardless
of lipid levels, significant differences of pepsin activities were found in three protein treatments (P < 0 .05 ).
Tryptase and lipase activities of 25% protein treatments were higher than those of 45% protein treatments
(P < 0 .05 ).
Digestible enzymes activity (U/mg pro.)
PER, SGR%
5
extract content than those fed with the other
diets (P < 0.05) (Table 3).
Pepsin, tryptase, and lipase activities in soft
body were significantly affected by the dietary
protein and lipid levels (P < 0.05) (Figs. 3, 4
and Table 4). The highest pepsin activity was
found in animals fed with the 35%/8% diet
(P < 0.05). The tryptase activity was lowest
in spotted babylon fed with the 45%/8% diet;
however, animals fed with the 25%/8% diet
had a significantly higher tryptase activity than
those fed with the other diets (P < 0.05). The
lowest lipase activities were found in animals
fed with the 35% protein at 8 and 12% lipid
diets.
Digestible enzymes activity (U/mg pro.)
between different levels of dietary protein and
lipid on survival rate and SB/SR. Regardless of
protein levels, the SB/SR of shellfish fed with
8% lipid (0.41 ± 0.02) was significantly higher
than 12% lipid (0.39 ± 0.04) (P < 0.05).
However, there was an interaction on PER,
SGR, and WG among the dietary treatments,
in which shellfish fed with 45% protein at 8%
lipid had the highest interaction (P < 0.05).
Regardless of lipid levels, PER, SGR, and WG
of shellfish fed with 45% protein were the
highest (P < 0.05) (Figs. 1, 2).
Moisture, crude protein, and ash in soft body
were not significantly affected by the dietary
protein and lipid levels (P > 0.05) (Table 3).
Juvenile spotted babylon fed with 45% protein
at 12% lipid diet had a significantly higher ether
18
16
a
b
14
12
10
a
a
8
b
6
b
Pepsin
Tryptase
Lipase
4
2
0
8
12
Lipid levels%
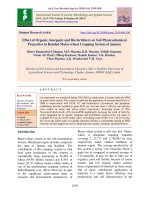
Figure 4. Effect of dietary lipid levels on the digestive
enzyme activities of juvenile spotted babylon. Regardless
of protein levels, significantly higher digestible enzyme
activities were found at 8% lipid treatments (P < 0 .05 ).
908
CHI ET AL.
Table 2. Effect of dietary protein/lipid ratio on growth performance, survival, and feed utilization of juvenile spotted
babylon.
Diets
(protein, %/
lipid, %)
25/8
25/12
35/8
35/12
45/8
45/12
PER
1.23
1.63
1.69
2.97
5.11
4.29
±
±
±
±
±
±
SGR
0.01d
0.90
0.73
1.11
1.84
2.55
2.17
0.34d
0.07d
0.21c
0.35a
0.26b
±
±
±
±
±
±
WG
0.01d,e
65.44
51.63
86.00
180.22
318.81
237.73
0.12e
0.04d
0.08c
0.10a
0.07b
±
±
±
±
±
±
Survival rate
0.90d
95.00
95.83
96.7
100
99.2
100
10.46d
4.32d
11.80c
24.55a
13.66b
±
±
±
±
±
±
SB/SR
2.50
2.20
3.33
0.00
0.83
0.00
0.40
0.38
0.41
0.37
0.43
0.44
±
±
±
±
±
±
0.01
0.01
0.01
0.00
0.01
0.01
PER = protein efficiency ratio; SGR = specific growth rate; WG = weight gain; and SB/SR = soft body to shell ratio.
Data represent mean ± SE (n = 3). Values in the same column sharing different superscript letters are significantly
different (P < 0.05).
Table 3. Effect of dietary protein/lipid ratio on soft body composition of juvenile spotted babylon.
Diets
(protein, %/
lipid, %)
25/8
25/12
35/8
35/12
45/8
45/12
Moisture
Crude protein
Ether extract
±
±
±
±
±
±
±
±
±
±
±
±
±
±
±
±
±
±
73.81
73.35
72.78
71.87
72.41
71.85
0.35
0.51
0.42
0.37
0.57
0.35
50.01
52.18
54.05
46.76
53.83
50.51
1.00
1.20
4.45
2.34
1.17
4.03
22.13
21.56
19.84
23.42
23.21
30.84
Crude ash
1.41b
18.38
16.89
20.36
17.41
16.24
15.10
1.38b
3.12b
0.72b
0.22b
1.69a
±
±
±
±
±
±
0.98
0.52
1.64
1.49
0.70
0.46
Data represent mean ± SE (n = 3). Values in the same column sharing different superscript letters are significantly
different (P < 0.05).
Table 4. Effect of dietary protein/lipid ratio on the digestive enzyme activities of juvenile spotted babylon.
Diets
(protein, %/
lipid, %)
Pepsin
(U/mg protein)
Tryptase
(U/mg protein)
Lipase
(U/mg protein)
25/8
25/12
35/8
35/12
45/8
45/12
13.37 ± 0.56b,c
15.45 ± 0.22b
19.37 ± 0.56a
13.02 ± 0.50c
11.15 ± 0.55c
12.40 ± 0.32c
12.2 ± 0.62a
5.27 ± 0.24c,d
9.02 ± 0.46b
6.28 ± 0.57c,d
4.11 ± 0.23d
7.24 ± 0.77b,c
11.35 ± 0.69a
7.29 ± 0.65b
5.39 ± 0.41b,c
3.97 ± 0.33c
7.22 ± 0.26b
7.38 ± 1.14b
Data represent mean ± SE (n = 3). Values in the same column sharing different superscript letters are significantly
different (P < 0.05).
Discussion
In this study, PER, SGR, and WG of the
shellfish were significantly affected by dietary
protein and lipid levels. Similar results were
observed in abalone fed with diets containing
three protein levels at 24, 34, and 44%, each
with three lipids levels at 2, 6, and 10%, respectively (Britz and Hecht 1997). Juvenile green
abalone, Haliotis rufescens, fed 40.5 and 44.1%
protein diets showed significantly better growth
performance than those fed the other diets (26,
31 and 35% protein with the same energy content at about 4.1 kcal/g) (G´omez-Montes et al.
2003). Xu (2006) reported that the optimal protein and lipid requirement of juvenile spotted
babylon (initial weight 2.16 ± 0.05 g) should
be 36.5–43.1% and 7.8–10.7%, respectively;
growth performance would be restrained when
the dietary lipid level was under 7.8%. In this
EFFECT OF DIETARY PROTEIN AND LIPID LEVELS
study, the maximum growth performance of
spotted babylon was observed in diet containing 45% protein at 8% lipid. However, Liu
et al. (2006) indicated that Babylonia formosae
(initial weight 1.60 ± 0.11 g) fed with different dietary protein levels (crude protein from
25 to 48%) have no significant differences in
growth performance, which was different from
our results. Dietary protein is not enough to
meet the growth requirement; lower growth
rates would be observed (Smith 1989). If the
dietary energy level is insufficient in the diets,
protein will be used as energy for maintenance
(National Research Council 1983). The estimation of protein requirements is affected by
some factors such as rearing conditions, stage of
growth, and sources of protein, but a more significant factor may be the dietary energy content
in quantitative determination (Wilson 1989).
Lee et al. (2002) reported that a positive correlation was found between the levels of dietary
digestible protein/digestible energy ratio and
growth performance at the same lipid levels.
The results of juvenile spotted babylon fed with
25 and 35% protein indicated a sparing effect
of the lipid for protein on growth performance.
Juvenile spotted babylon fed with diet containing 12% lipid had higher PER than that fed
with 8% lipid diet. The trend indicated that
spotted babylon can effectively utilize dietary
lipid as an energy source and dietary protein
will be used for growth. The theory behind
a protein sparing effect is that, when protein
provides essential amino acids to meet growth
requirements, extra dietary protein will be used
for energy purposes. Increases in the nonprotein energy component of diets (at a specific
protein concentration) have been reported to
improve growth and reduce the protein requirement through protein sparing in the American lobster (Capuzzo and Lancaster 1979).
When spotted babylon was fed with a diet containing excess energy, WG may be decreased
because of the reduced feed consumption. However, when spotted babylon was fed with a
diet deficient in energy, dietary protein will be
used as an energy source and this elevates the
909
production cost. In this study, there was no significant sparing effect when the dietary protein
increased to 45%.
Mai et al. (1995) found that SB/SR of
abalone did not differ significantly when fed
with diets containing 20–50% protein. In this
study, although the protein and lipid had significant influences on SB/SR, the interaction
between protein and lipid was not significant.
The main difference in protein and lipid utilization may be because of the carnivorous feeding
activity of spotted babylon, whereas abalone is
a herbivorous mollusk.
Protein level in diet would affect the body
protein and lipid contents of scallop spat, but
there were no effects on protein deposition with
the growth change (Uriarte and Farías 1999).
However, the increase of dietary lipid levels
should be carefully considered as it may affect
carcass quality, mainly because of an increase
of lipid deposition (Cowey 1993; Hillestad and
Johnsen 1994). Zhou et al. (2007a) reported
that lipid content in soft body (initial weight =
93.50 ± 1.70 mg) decreased with increasing
dietary protein levels from 27 to 49% with
lipid levels from 15 to 3%. In this study,
by comparison with the spotted babylon fed
with the different protein and lipid levels,
ether extracts of soft body of juvenile spotted
babylon were significantly affected by the
dietary protein and lipid levels; however, there
was no significant difference in the protein
content of soft body. Increasing dietary protein
level did not influence the protein content
in soft body. However, our previous studies
reported that crude protein, moisture, and ash
content in soft body significantly decreased
when the dietary lipid level increased from 1.83
to 11.73% at 43% dietary protein, but the lipid
content was reversed (Zhou et al. 2007b). It is
speculated that excretive nitrogen level would
increase with increasing dietary protein level
(Hawkins and Bayne 1991).
In this study, the digestive enzyme activities
in soft body were significantly affected by the
dietary protein and lipid levels. Protease activity
in the digestive gland is a key determinant
enzyme of the digestibility and assimilation
efficiency of ingested proteins. The results
910
CHI ET AL.
showed that spotted babylon fed with a diet
with 35% protein and 8% lipid had the highest
pepsin activities of those fed the diets. With
the dietary protein level increasing at the same
lipid level, pepsin activity showed a downtrend,
except 35%/8%. On the contrary, Pan et al.
(2005) and Zhou et al. (2007a) reported that the
activities of pepsin and tryptase in soft body
were elevated with an increase in the dietary
protein. The main reason may be because of
different species or different dietary lipid level
and/or development stage. At the low lipid
level, tryptase activity significantly declined
with the protein increasing. However, at the
high lipid level, the trend was adverse precisely
without difference. Lipase activities of lipid
level at 12% were lower than those at 8% with
dietary protein level at 25 and 35%. The lipase
activities were improved at 45% protein level.
To the juvenile spotted babylon, lower protein
level would limit the utilization of higher lipid.
The juvenile spotted babylon could digest lipid
and utilize the dietary lipid as an energy source
at higher protein levels.
Conclusion
In summary, this study provides some insight
into the nutrition of juvenile spotted babylon.
The levels of protein and lipid at 45 and 8%
were recommended for the best growth of juvenile spotted babylon (initial mean weight =
5.05 ± 0.08 g).
Acknowledgments
This work was supported by Zhanjiang
Science and Technology Research Program
(grant number 200401). The authors are grateful
for J. C. Zhang and S. L. Zeng for their skilled
technical assistance.
Literature Cited
Altena, C. O., Van Regteren, and E. Gittenberger. 1981.
Zoologische Verhandelingen. Leiden E-Journal of Brill
188:1–57.
AOAC (Association of Official Analytical Chemists).
1995. Official method of analysis, 16th edition.
Association of Official Analytical Chemists, Arlington,
Virginia, USA.
Bradford, M. M. 1976. A rapid and sensitive method
for the quantification of microgram quantities of
proteins utilizing the principle of protein-dye binding.
Analytical Biochemistry 72:248–254.
Britz, P. J. and T. Hecht. 1997. Effect of dietary protein
and energy level on growth and body composition of
South African abalone, Haliotis midae. Aquaculture
156:195–210.
Cai, Y. Y., Y. Zhang, and R. F. Wei. 1995. Conchology
conspectus, 1st edition. Shanghai Technology Publishing Company, Shanghai, China.
Capuzzo, J. M. and B. A. Lancaster. 1979. The effects
of diet on the growth energetics of postlarval lobsters
(Homarus americanus). Proceedings of the World
Mariculture Society 10:689–700.
Coote, T. A., P. W. Hone, R. J. Van Barneveld, and
G. B. Maguire. 2000. Optimum protein level in a
semi-purified diet for juvenile greenlip abalone (Haliotis laevigata). Aquaculture Nutrition 6:213–220.
Cowey, C. B. 1993. Some effects of nutrition and flesh
quality of cultured fish. Pages 227–236 in S. J.
Kaushik and P. Luquet, editors. Fish nutrition in practice, volume LXI. Proceedings of the IV International
Symposium on Fish Nutrition and Feeding. Les Colloques INRA, Paris, France.
G´omez-Montes, L., Z. García-Esquivel, L. R. D’Abramo,
A. Shimada, C. V´asquez-Pel´aeze, and M. T. Vinna.
2003. Effect of dietary protein: energy ratio on intake,
growth and metabolism of juvenile green abalone
(Haliotis fulgens). Aquaculture 220:769–780.
Hawkins, A. J. S. and B. L. Bayne. 1991. Nutrition
of marine mussels: factors influencing the relative
utilization of protein and energy. Aquaculture 94:
177–196.
Hillestad, M. and F. T. Johnsen. 1994. High-energy/lowprotein diets for Atlantic salmon: effects on growth,
nutrient retention and slaughter quality. Aquaculture
124:109–116.
Ke, C. H., Y. Fu, H. Tang, S. Q. Zhou, and F. X. Li.
1997. Studies on food diet and digestive rate of dietary
protein for the ivory shell (Babylonia formosae habei ).
Marine Science 5:5–7 (in Chinese).
Kritsanapuntu, S., N. Chaitanawisuti, and Y. Natsukari.
2009. Growth and water quality for growing-out
of juvenile spotted Babylon, Babylonia areolata, at
different water-exchange regimes in a large-scale
operation of earthen ponds. Aquaculture International
17:77–84.
Lee, S. M., I. G. Jeon, and J. Y. Lee. 2002. Effects of
digestible protein and lipid levels in practical diets
on growth, protein utilization and body composition
of juvenile rockfish (Sebastes schlegeli ). Aquaculture
211:227–239.
Liu, D. J. and S. Q. Xiao. 1998. Preliminary study on
ecology of Babylonia formosae. Journal of Fisheries
Science in China 5:93–96.
Liu, Y. M., J. Z. Zhu, H. Y. Wu, and D. Z. Shi. 1991.
Studies on digestive enzymes and amino acid of larval
and post larval stages of prawn (Penaeus chinensis)
EFFECT OF DIETARY PROTEIN AND LIPID LEVELS
(O’sbeck 1965). Oceanologia et Limnologia Sinica
22:571–575.
Liu, L. H., L. Q. Chen, A. H. Dong, S. X. Zheng, and
Z. G. Liu. 2006. Effects of different dietary protein
levels on growth performance and body composition
of Babylonia formosae. Fisheries Science of China
25:601–607.
Mai, K. S., J. P. Mercer, and J. Donlon. 1995. Comparative studies on the nutrition of two species of abalone
(Haliotis tuberculate L. and Haliotis discus hannai
Ino.). IV. Optimum dietary protein for growth. Aquaculture 134:165–180.
National Research Council (NRC). 1983. Nutrient requirements of warmwater fishes and shellfishes. National
Research Council, National Academy Press, Washington, DC, USA.
National Research Council (NRC). 1993. Nutrient requirements of fish. National Research Council, National
Academy Press, Washington, DC, USA.
Pan, L. Q. and K. X. Wang. 1997. The experimental
studies on activity of digestive enzyme in the larvae
Penaeus chinensis. Journal of fisheries of China
21:26–31.
Pan, L. Q., G. Q. Xiao, H. X. Zhang, and Z. H. Luan.
2005. Effects of different dietary protein content on
growth and protease activity of Eriocheir sinensis
larvae. Aquaculture 246:313–319.
Puri, S. and K. Mullen. 1980. Applied statistics for
food and agriculture scientists. G. K. Hall Medical
Publishers, Boston, Massachusetts, USA.
Smith, R. R. 1989. Nutritional energetics. Pages 1–29
in J. E. Halver, editor. Fish nutrition, 2nd edition.
Academic Press, San Diego, California, USA.
911
Thongrod, S., M. Tamtin, C. Chairat, and M.
Boonyaratpalin. 2003. Lipid to carbohydrate ratio in
donkey’s ear abalone (Haliotis asinina, Linne) diets.
Aquaculture 225:165–174.
Uki, N., A. Kemuyama, and T. Watanabe. 1985. Development of semipurified test diets for abalone. Bulletin of the Japanese Society of Scientific Fisheries
51:1825–1833.
Uriarte, I. and A. Farías. 1999. The effect of dietary protein content on growth and biochemical composition of
Chilean scallop Argopecten purpuratus (L.) postlarvae
and spat. Aquaculture 180:119–127.
Watanabe, T. 1982. Lipid nutrition in fish. Comparative
Biochemistry and Physiology. 73B:3–15.
Wilson, R. P. 1989. Amino acids and proteins. Pages
111–151 in J. E. Halver, editor. Fish nutrition. Academic Press, New York, New York, USA.
Xu, Y. B. 2006. Studies on protein and lipid requirement
of Babylonia areolata Link. Master’s thesis. Ximen
University of China, China.
Zhang, L. L., Q. C. Zhou, and Y. Q. Cheng. 2009. Effect
of dietary carbohydrate level on growth performance
of juvenile spotted babylon (Babylonia areolata).
Aquaculture 295:238–242.
Zhou, J. B., Q. C. Zhou, S. Y. Chi, Q. H. Yang, and
C. W. Liu. 2007a. Optimal dietary protein requirement for juvenile ivory shell (Babylonia areolata).
Aquaculture 270:186–192.
Zhou, Q. C., J. B. Zhou, S. Y. Chi, Q. H. Yang, and
C. W. Liu. 2007b. Effect of dietary lipid level on
growth performance, feed utilization and digestive
enzyme of juvenile ivory shell (Babylonia areolata).
Aquaculture 272:535–540.