BÁO CÁO TÀI CHÍNH CÔNG TY honda motor
Bạn đang xem bản rút gọn của tài liệu. Xem và tải ngay bản đầy đủ của tài liệu tại đây (228.45 KB, 20 trang )
IV: FINANCIAL ANALYSIS OF HONDA MOTOR COMPANY:
4.1: Table of data.
4.1.1. Balance Sheets.
Yen(millions)
Total current assets
Finance subsidiariesreceivables, net
Investments and
advances
Net property on
operating leases
Net property, plant and
equipment
Other assets
Total assets
Total current liabilities
Long-term debt,
excluding current
portion
Other liabilities
Total liabilities
Total Honda Motor Co.,
Ltd. shareholders'
equity
Noncontrolling interests
Total equity
Total liabilities and
equity
FY2010
4,613,724
FY2011
4,690,047
FY2012
4,739,086
FY2013
5,323,053
FY2014
5,771,266
2,361,335
2,348,913
2,364,393
2,788,135
3,317,553
642,681
639,932
623,607
668,790
817,927
1,308,147
1,357,632
1,472,757
1,843,132
2,236,721
2,086,663
1,939,356
1,973,458
2,399,530
2,818,432
616,565
11,629,115
594,994
11,570,874
3,419,130
3,568,192
3,579,759
4,089,004
4,711,329
2,313,035
2,043,240
2,235,001
2,710,845
3,234,066
1,440,520
7,172,685
1,376,530
6,987,962
1,454,937
7,269,697
1,630,085
8,429,934
1,563,238
9,508,633
4,328,640
4,449,975
4,392,226
5,043,500
5,918,979
127,790
132,937
125,676
161,923
194,419
4,456,430
4,582,912
4,517,902
5,205,423
6,113,398
11,629,115
11,570,874
614,298
612,717
660,132
11,787,599 13,635,357 15,622,031
11,787,599 13,635,357 15,622,031
Table 4.1: Balance Sheets
4.1.2. Income Statements.
Yen(millions)
FY2010
FY2011
FY2012
FY2013
FY2014
Net sales and other
operating revenue
8,579,174
8,936,867
7,948,095
9,877,947 11,842,451
Cost of sales
6,414,721
6,496,841
5,919,633
7,345,162
8,761,083
Selling, general and
administrative
Research and
development
Operating costs and
expenses
Operating income
Other income
(expenses)
Income before income
taxes and equity in
income of affiliates
Income tax expense
Equity in income of
affiliates
Net income
attributable to
noncontrolling
interests
1,337,324
1,382,660
1,277,280
1,427,705
1,696,957
463,354
487,591
519,818
560,270
634,130
8,215,399
8,367,092
7,716,731
363,775
569,775
231,364
544,810
750,281
-27,577
60,773
26,039
-55,919
-21,341
336,198
630,548
257,403
488,891
728,940
146,869
206,827
135,735
178,976
252,662
93,282
139,756
100,406
82,723
132,471
-14,211
-29,389
-10,592
-25,489
-34,642
Net income
attributable to Honda
Motor Co., Ltd.
268,400
534,088
211,482
367,149
574,107
Basic net income
attributable to Honda
Motor Co., Ltd per
common share
¥147.91
¥295.67
¥117.34
¥203.71
¥318.54
9,333,137 11,092,170
Table 4.2: Income Statements
4.2.
Analysis of the financial structure of the company.
4.2.1. Analysis of structural properties.
CONSOLIDATED BALANCE SHEET (assets)
Total current
assets
FY2014
FY2013
FY2012
5,771,266
5,323,053
4,739,086
Unit: Yen (millions)
Difference
±
%
2014/2013
448,213
8.42
Difference
±
%
2013/2012
583,967
12.32
Finance
subsidiariesreceivables,
net
3,317,553
2,788,135
2,364,393
529,418
18.99
423,742
17.92
Investments
and
advances
817,927
668,790
623,607
149,137
22.30
45,183
7.25
Net property
on operating
leases
2,236,721
1,843,132
1,472,757
393,589
21.35
370,375
25.15
Net property,
plant and
equipment
2,818,432
2,399,530
1,973,458
418,902
17.46
426,072
21.59
Other assets
660,132
612,717
614,298
47,415
7.74
-1,581
-0.26
Total assets
15,622,031
13,635,357
11,787,599
1,986,674
14.57
1,847,758
15.68
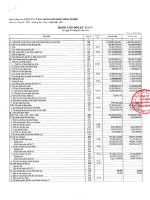
Table 4.3 Analyzes the structure of assets.
Looking at our target assets reflects the scale of the Honda company is relatively large, with a
manufacturing company is a large-scale analysis shows that the stature and growth commensurate with
a leading company the world in the field of industrial production. Through our tables show total assets
increased slightly in 2013 compared with 2012, an increase of ¥1,847,758 million, equivalent to
15.68%. By 2014 the total assets of ¥15,622,031 million, an increase of 14.57% compared to 2013.
This shows that the size of the company's capital increase, production and business scale has been
expanded.
Figure 1: Graph showing total assets (2010-2014).
In 2013, Finance subsidiaries-receivables, net increase of ¥423,742 million, an increase of
17.92%. This shows that companies with capital accumulation in the checkout process, so companies
need to take steps to reduce the amount receivable.
Investments and advances have increased slightly from ¥623,607 million in 2012 increased by
¥668,790 million in 2013, with a growth rate of 7.25%. This shows that the company has invested to
expand its market to seek long-term returns.
Net property plant and equipment with a strong ¥426,072 million, with a growth rate of
21.59%, showing that the technical facilities of the company have been strengthened, the production
scale of the company is increasingly expanding. In addition, the Total current assets task in 2013 was
¥5,323,053 million rose to ¥583,967 million rate is 12.32%, this factor accounts for the largest
proportion of the company.
By 2014, Total current assets task increased ¥5,771,266 million rose ¥448,213 million
equivalent of 8.42%. The increase had a decrease compared to 2012 was 12,32%. Finance subsidiariesreceivables, net increased by 18.99% or ¥529,418 million compared to 2013.
Investments and advances increased strongly to reach 817,927 million yen, an increase of 22.30%, this
increase is much higher compared to 2012 which suggests that companies tend to invest very high. Net
property, plant and equipment increased by ¥418,902 million increase of 17.46%. Compared to the
fifth floor at 2012 - 2013, the growth rate tends to decrease.
So from the above analysis we can conclude that the asset structure of the company is relatively
reasonable, but it can not be concluded that the financial situation of the company as well. As a
business with good financial situation does not only manifest in reasonable structural properties, but
also to have a capital to form fixed assets including structured legal and appropriate.
The capital structure analysis indicates the ability to financially sponsor of the company as well as the
degree of autonomy of the business or the difficulties that the company faces. Therefore, we must
continue to carry out structural analysis and capital volatility of the Company.
4.2.2. Analysis of scale and capital structure.
Based on data from the accounting balance sheet in 2012, 2013, 2014 tabulation analysis
of the changes in the size, capital structure is as follows:
FY2014
FY2013
FY2012
Values
Values
Values
Total current
liabilities
4,711,329
4,089,004
3,579,759
622,325
15.22
509,245
14.23
Long-term debt,
excluding
current portion
3,234,066
2,710,845
2,235,001
523,221
19.30
475,844
21.29
Other liabilities
1,563,238
1,630,085
1,454,937
-66,847
-4.10
175,148
12.04
Total liabilities
9,508,633
8,429,934
7,269,697
1,078,699
12.80
1,160,237
15.96
Total Honda
Motor Co., Ltd.
shareholders'
equity
5,918,979
5,043,500
4,392,226
875,479
17.36
651,274
14.83
194,419
161,923
125,676
32,496
20.07
36,247
28.84
6,113,398
5,205,423
4,517,902
907,975
17.44
687,521
15.22
15,622,031
13,635,357
11,787,599
1,986,674
14.57
1,847,758
15.68
Indicators
Noncontrolling
interests
Total equity
Total liabilities
and equity
Difference
±
(2014/2013)
Difference
%
±
(2013/2012)
%
Table 4.4: A breakdown of scale, capital structure.
Based on the data above table shows:
In 2013, the total capital of the company is ¥13,635,357 million, an increase of 15.68%.
In particular, the Total current assets 14.23% increase compared with 2012. Long-term debt,
excluding current portion increased by ¥475,844 million, 21.29% respectively. This causes
increased Total liabilities significant number 1,160,237 million yen, an increase of 15.96%
compared to 2012.
In 2012 Total Honda Motor Co., Ltd. shareholders' equity was ¥4,392,226 million, by
2013 this number increased to ¥5,043,500 million. So there is a heap of additional capital
contributions from shareholders to increase investment in business expansion.
Total resources of Honda Motor Company Ltd. in 2014 was ¥15,622,031 million, an
increase of ¥1,986,674 million to increase the proportion of 14.57%. In particular, increased
liabilities ¥1,078,699 million for the 7.91%. The proportion of liabilities is 61.82%, down
0.96% compared to 2014. Sources equity increased to ¥907,975 million rate is 6.66%: The
proportion of equity is 38.18%, up 0.96% compared to 2013 This shows the funding policy of
the company is using its capital, this is the company policy is maintained through Honda Motor
Ltd many years, and increasingly deliver better results, it is evident in the financial position of
the company improved throughout 2014.
- Liabilities:
Total current liabilities increased to ¥622,325 million, rate is 4.56%, increasing the
proportion of 0.17%, respectively, from 29.99% to 30.16%, still accounts for the largest
proportion of liabilities.
Long-term debt, excluding current portion tends to increase with ¥523,221 million, rate
is 3.84%, the proportion of long-term debt liabilities in 2014 is 20.70%, up 0.82% compared
with the 2013. Meanwhile, Other liabilities ¥66.847 million decrease to 0.49%, rate reduction
in 2014 has been very well managed company.
- Equity:
Figure 2: Graph showing equity (2010-2014).
Increased in all parts, in the capital owners, ¥907,975 million increase with growth rate
is 6.66%, 39.13% proportion of equity ownership. Total Honda Motor Co., Ltd. shareholders'
equity increased from 36.99% to 37.89% in 2014, with a growth rate of 6.42% is equivalent to
¥875,479 million. This suggests that the company has additional capital in business activities
aimed at expanding the market looking for more profits.
Conclusion: Thus, the allocation of capital in Honda Motor Co. Ltd. in 2014 have
markedly improved. Total liabilities tends to decrease. Total equity tends to increase. Shows
that companies are using their own money to invest in the business.
4.2.3. Analysis autonomy in financing activities.
To analyze the degree of independence and financial autonomy of the company, should
the criteria "funded ratio":
Coefficient sponsorship (%)
2014
37.89
2013
36.99
2012
37.26
Table 4.5: Table assess the level of financial independence.
Looking at the above table we can see, the numbers of indicators reflecting the degree of
financial independence from Honda in 2014 increased compared to 2013 and 2012 thus
demonstrates the level of financial independence of units has increased over the years. Thus,
the financial situation of the company is trending up. However, the amount of capital that the
company spent remains limited. This can assess the financial situation of the company is not
very convenient.
4.2.4. Analysis of solvency.
To assess the solvency of units, need to consider the relationship between solvency and
liquidity needs. Solvency of the unit include all properties that are capable unit at current prices
in payment at the time of study and are arranged in the order of rotation speed of capital.
Demand payment of the unit includes short-term liabilities, long term sorted in order of
payment terms.
2014
1.64
Generalized Ratio
2013
1.62
2012
1.62
Table 4.6: The list of general payments.
We see the overall solvency of the unit in 2014 increased compared to 2013 and 2012 at
the time of 2013 and 2012, the solvency Essential 1.62 times, 1.64 times the time in 2014. This
is a fundamental factor contributing to the financial stability of the unit. Ratio of overall units
in 2014 compared to 2013 increased from 1.62 to 1.64 with 0.02 pace of 1.2%. This growth
rate is small, but the unit also demonstrated the ability to pay the debts of the company is
gradually raised to make the financial situation of the unit more stable, positive impact to
business operations.
* Analysis of the short-term solvency.
To analyze the short-term solvency of the Vietnam Dairy Products Joint Stock Company, we
determine the reflection coefficient of solvency in the short term.
2014
Chỉ số hiện hành
1.93
2013
1.98
Chênh lệch
2012
±
%
(2014/2013)
1.93
-0.05
-2.75
Chênh lệch
±
%
(2013/2012)
0.05
2.83
Table 4.7: Table evaluate the short-term solvency.
Solvency coefficient of short-term debt decreased in 2013 compared to 2012 was 0.02,
1.52% speed reduction. Meanwhile, the 2014 ratio fell 0.08 short time, or 6.15% decrease
compared to 2013 units. Demonstrate progress has been made in improving the financial
situation. However, in both years, the solvency ratio of short-term debt is higher than 1 unit
demonstrates that there is sufficient short-term assets to pay short-term liabilities. From a shortterm payment situation we see on the solvency of short-term debt is relatively good unit.
4.3.1. The report analyzed the results of operations:
To control the operations and business performance, consider the fluctuation of the items
in the statement of earnings. We need to analyze and compare the rates and rate fluctuations
between the years of each indicator on report operating results. To report analyzes business
results in 2014 to compare the 2013 targets on reported operating results for the 2014 targets.
Table 4.8: A breakdown of reported operating results
Unit: Yen (millions)
Difference
Indicators
2014
2013
Net sales and other
operating revenue
11,842,451
9,877,947
7,948,095
1,964,504
19.89
1,929,852
24.28
8,761,083
7,345,162
5,919,633
1,415,921
19.28
1,425,529
24.08
1,696,957
1,427,705
1,277,280
269,252
18.86
150,425
11.78
634,130
560,270
519,818
73,860
13.18
40,452
7.78
11,092,170
9,333,137
7,716,731
1,759,033
18.85
1,616,406
20.95
750,281
544,810
231,364
205,471
37.71
313,446
135.48
-21,341
-55,919
26,039
34,578
-61.84
-81,958
-314.75
Income before income
taxes and equity in
income of affiliates
728,940
488,891
257,403
240,049
49.10
231,488
89.93
Income tax expense
252,662
178,976
135,735
73,686
41.17
43,241
31.86
Equity in income of
affiliates
132,471
82,723
100,406
49,748
60.14
-17,683
-17.61
Net income attributable
to noncontrolling
interests
-34,642
-25,489
-10,592
-9,153
35.91
-14,897
140.64
574,107
367,149
211,482
206,958
56.37
155,667
73.61
318.54
203.71
117.34
115
56.37
86
73.61
Cost of sales
Selling, general and
administrative
Research and
development
Operating costs and
expenses
Operating income
Other income
(expenses)
Net income
attributable to Honda
Motor Co., Ltd.
Basic net income
attributable to Honda
Motor Co., Ltd per
common share
2012
Difference
Values
2014/2013
%
Values
2013/2012
%
From the analysis shows:
- The total profits of the company increased ¥155,667 million equivalent to 73.61%
compared with the year 2012. By 2014, net income attributable to Honda Motor Co., Ltd. is
¥574,107 million rose 56.37%. Thus we can see that the net income attributable to Honda tends
to decrease.
- In recent years a number of economies are more volatile and more difficult very
particular peers, as well as general company announced losses. This number is impressive
result. Given that the company had an effective year. Achieving this result is likely due to better
cost management and focus on the product added value.
Specifically:
- Net sales and other operating revenues in 2013 increased by ¥1,929,852 million, an
increase of 24.28%. In 2014 revenue increased by 18.89% (¥11,842,451 million). This figure
shows that the company's revenue decreased while the amount of investment the company has
grown, so companies need to take measures to improve the financial situation at present.
- Net profit from business operations of the company increased by ¥205,471 million
equivalent to 37.71% compared with 2013, an increase of 135.48% compared to 2012.
- In the men's 2013 Profit before income taxes and equity in earnings of affiliates
increased ¥231,488 million equivalent to 89.93%.
- Earnings before income taxes and equity in earnings of affiliates increased ¥240,049
million equivalent to 49.10%.
Net sales : Yen
(millions)
Japan
North America
Europe
Asia
Other
FY2010
70,461
103,956
124,665
461,067
380,143
FY2011
70,244
96,664
103,890
577,669
439,727
FY2012
72,915
97,306
96,146
579,562
502,899
FY2013
72,949
112,176
86,424
667,473
400,527
FY2014
79,455
141,563
102,634
868,464
471,515
Table 4.9: Net sales table selling motorcycles.
Net sales : Yen
(millions)
Japan
North America
Europe
Asia
Other
FY2010
FY2011
FY2012
FY2013
FY2014
1,383,855
3,013,432
575,326
1,041,258
540,977
1,310,734
3,252,852
441,696
1,221,704
567,112
1,329,645
2,855,683
355,963
836,301
428,383
1,462,664
3,905,276
388,464
1,385,449
567,363
1,714,752
4,717,769
487,673
1,599,069
657,097
Table 4.10: Net sales table selling cars.
The increase in revenue was mainly due to the growth of automobiles and motorcycles:
Besides, the wide distribution network in the world carved with production facilities authorized
in the country has increased revenue by increasing the number of products and product quality
are more advanced day.
Cost of sales in absolute terms increased from ¥7,345,162 in 2013 to ¥8,761,083
million in 2014 equivalent to the rate of 19.28%.
Selling expenses and general manager in 2014 reached ¥1,696,957 million, equivalent
to 18.86% compared to 2013, this increase is still lower than the growth in revenue. Therefore,
to obtain 100 in revenue in 2014 spent less than the cost of sales. In other words businesses
save costs business more efficient.
Cost of research and development rose 13.18% or ¥73,860 million. This shows that the
company has invested in research and development to produce new products to meet market
demand and to compete with other competitors.
Income tax expenses increased by ¥73,686 million equivalent to 41.17% of the income
showed strong growth that the company is pleased the company is worth:
Equity in earnings of affiliates in 2014 reached ¥132,471 million, an increase of
¥49,748 million equivalent to 60.14%: Demonstrated that the company's branch operations
effectively.
4.3.2. Analysis of the cash flow statement:
Report cash flow is a useful source of information for assessing the ability to generate
cash, solvency or capital requirements of a business loan. Cash flow statement is a summary
table to answer the question "of corporate money comes from and how used, for what
purpose?" It also enables us back to why businesses are profitable that borrowers must pay
taxes or state bankruptcy is because there is no debt payments ...
Thus, the analysis of the cash flows of an enterprise is one of the important pillars for the
administrator is able to capture the true financial situation of the company. So the financial
situation of how Honda is reflected through the cash flow situation of the company in 2014.
Difference
Indicators
Cash flows from
operating
activities
Cash flows from
investing
activities
Free cash flow
2014
Difference
2013
2012
1,229,191
800,744
761,538
428,447
53.51
39,206
5.15
-1,708,744
-1,069,756
-673,069
-638,988
59.73
-396,687
58.94
-479,553
-269,012
88,469
-210,541
78.26
-357,481
-404.07
Vaulues
2014/2013
%
Vaulues
2013/2012
%
Cash flows from
financing
activities
Effect of
exchange rate
changes on cash
and cash
equivalents
Net change in
cash and cash
equivalents
Cash and cash
equivalents at
beginning of the
year
Cash and cash
equivalents at end
of the period
370,555
119,567
-68,230
250,988
209.91
187,797
-275.24
71,784
108,460
-52,150
-36,676
-33.82
160,610
-307.98
-37,214
-40,985
-31,911
3,771
-9.20
-9,074
28.44
1,206,128
1,247,113
1,279,024
-40,985
-3.29
-31,911
-2.49
1,168,914
1,206,128
1,247,113
-37,214
-3.09
-40,985
-3.29
Table 4.11: Reporting cash flows.
Based on the above table it is easy to see, first formed in terms of cash flow from
operations in 2014, the net cash flow from business operations and financial performance
remaining balance revenue expenditure respectively ¥428,447 million and ¥ 250,988 million
while net cash flow from investing activities was net revenue expenditure was ¥638,988
million shortage:
On the basis of the balance between revenue and expenditure of money, the amount of
net cash flow in 2014 -¥37,214 million, and net amount of cash flow in 2013 is - ¥40,985
million. In 2014 the company has expanded its production scale, and on this basis has grown
operate effectively.
Figure 3: Graph showing cash flows (2010-2014).
So on average in 2014, only the operations only produce business and financial
operations are excess payments during the investment activity, the deficiency payment.
However, the results still showed a positive sign and reasonable. Because, in the investment
stage facilities company has cash balance of production and business activities.
From table analysis Cash Flow Report shows that, of the cash flows Honda Company is
primarily generated from operating activities and financing activities
* In 2013, net cash flow from operating activities was ¥800,744 million, suggesting
business activity increases the amount of units.
- Cash flow from financing activities was ¥119,567 million.
- Cash flow from investing activities is ¥-1,069,756 million. Investment proved to reduce the
amount of units. Although this activity creates a huge amount of money but besides that the
amount paid is greater than the amount of money generated should be negative.
*In 2014, net cash flow from operating activities was ¥1,229,191 million, an increase of
¥428,447 million compared to 2013 with 53.51% relative reduction.
- Business activities have a positive cash flow. This is the sign of a healthy, optimistic about the
ability to secure money for production and business activities.
Thus, summary cash flow from operating activities provide basic information to assess
the ability to generate cash from operations Honda. The company has a healthy financial
situation, pay the debts, maintenance activities, pay dividends and undertake new investment
activities without external sources of finance.
- Cash flow from investing activities is ¥-1,708,744 million, an increase of ¥638,988 million
compared with 2013 increased by 59.73% relative.
Looking at the cash flow statement. We see the net flow of investment is ¥-1,708,744 million.
This is not necessarily a bad sign for production and business activities. On the other hand,
suppose if the net cash flows from investing activities positive (revenues> expenses) is not
necessarily good because, while the results of the proceeds from the sale of fixed assets and the
recovery of capital investments own more than the amount spent to expand investment, fixed
asset purchases and increased financial investment. In other words, this means a contraction in
investment activities.
- Net cash flow from financing activities was ¥370,555 million yen rose versus ¥250,988
million in 2013 to 209.91% of relative.
So in 2014 financial performance has brought a major source of revenue for the company.
Through analysis of the cash flows on, we see, Honda is a company that has potential
indeed. The company not only creates brackish i recorded in the profit, but the profit is actually
generated, reflected by positive net cash flow of the company during the year. Ability to
generate cash and pay the company are also appreciated. Mobilization policies of major
transport company is using its own internal resources, this reaffirms the company's financial
good health. Besides the company is also a policy of reasonable use of the investment process,
expand market share, increase product quality floor ... prestige in the market continue to hold a
leading position.
The above analysis shows that remittance flows through two in 2013, 2014 is consistent with
the characteristics of business of the Company Honda.
4.3.3. Analysis of the financial statements for the detection of financial risks.
To analyze the financial risks we first consider debt settlement risks affecting the production
and business operation of the unit. Debt Settlement risk occurs when not enough or businesses
can not afford to pay. Therefore, to analyze our payment risk analysis focus and ability to pay
its debts and short-term debt limit.
2014
2013
2012
Difference
±(2014/2013)
%
Difference
±(2013/2012)
%
Ratio of general
1.64
1.62
1.62
0.02
1.23
0
0.00
Ratio of shortterm
1.22
1.30
1.32
-0.08
-6.15
-0.02
-1.52
Table 4.12: Table payment risk analysis.
Ability to pay short-term debt and reduce the overall solvency of the unit in 2014
increased slightly compared with 2013, in 2012 but remained low, indicating the unit has been
made in the payment of debts make the financial situation of the financial units encouraging.
In addition, to detect financial risks, we consider the indicators reflecting the relationship
between accounts receivable compared with liabilities (H) of the unit.
The percentage of receivables
against payables
2014
2013
2012
34.89
33.07
32.52
Table 4.13: Table percentage of receivables versus payables.
This indicator at 3 years is less than 100% debt units proved more sellers than buyers of
debt.Thus, the debt situation of the unit positive impact to the financial performance of the unit.
4.3.4. Analysis of the relationship between the financial reporting.
Besides analyzing each financial reports, analyzing the relationship between the
financial statement analysts will comprehensively assess the financial situation of enterprises.
To analyze the relationship between the report we focus primarily on the analysis of
generalized business performance, effective use of long-term assets, efficient use of short-term
assets.
Net sales and other
operating revenue
11,842,451
9,877,947
7,948,095
1,964,504
19.89
1,929,852
24.28
Income before
income taxes and
equity in income of
affiliates
728,940
488,891
257,403
240,049
49.10
231,488
89.93
Net income
attributable to Honda
Motor Co., Ltd.
574,107
367,149
211,482
206,958
56.37
155,667
73.61
Total Honda Motor
Co., Ltd.
shareholders' equity
5,918,979
5,043,500
4,392,226
875,479
17.36
651,274
14.83
Return on Assets
(ROA)
3.9
2.9
1.8
1.00
34.48
1.10
61.11
Return on Sales
(ROS)
4.8
3.7
2.7
1.10
29.73
1.00
37.04
Return on Equity
(ROE)
10.5
7.8
4.8
2.70
34.62
3.00
62.50
Table 4.14: Table generalized analysis business performance.
4.3.5. Analysis of business performance generalizations.
* Coefficient of profit after tax to assets (ROA) was 0.29 in 2013, meaning that for
every 100 properties are at potentially lucrative copper is 29 higher than in 2012 is 18 copper
while the eastern profitability is much higher at 39 compared to 2 in 2012 and 201.
We see, ROA increased 61.11% compared with 2012 and a downward trend in 2014 is
34.48% with an increase. However this increase remained high efficiency demonstrated good
properties, such as factors contributing improve capital efficiency.
* Return on equity (ROE) of the Corporation in 2014 was 1.05. That is when the other
factors constant, a contract equity participation in production and business activities will
generate profits here at 1.05 a profit is very attractive for investors because this ratio is
relatively high, in 2013, a contract equity participation in a co-production of business activities
will be 0.78 in profit: 2014 compared to 2013 increased 0.27 this increase is due to two
reasons:
- The Company uses the asset effectiveness is demonstrated by the increase in asset turnover.
Asset Turnover (Round)
2014
0.76
2013
0.72
2012
0.67
Table 4.15: Asset Turnover.
- Maintain a good level of gross profit in difficult times and have policies to control
costs better through increased profit margin on sales.
Now that we see that the strength of the profitability of equity of the Company has
increased over 3 years is due to the profit after tax of the company and increase net revenue of
the Corporation is increased in accordance with the law, besides the equity ownership has
increased over the years which suggests that the company has funded quite good and effective
use.
In 2014 the economic situation, with major macroeconomic fluctuations and
unpredictable as hyperinflation, frozen credit markets, recession ... so many businesses,
including business activities in the same field has suffered huge profits decline. However, the
results of the Honda business in 2014 showed that the profitability of the company are very
impressive improvement compared to the same period last year. This shows that the assertion
of product quality, reputation, has helped Honda increase its competitive position, market share
of greater than other companies in the same industry.
4.4.
Financial strategy for the company Honda.
To assess the level of management, executive producer of a business enterprise, it is used as a
measure of production efficiency of the enterprise business. Production and business
effectiveness is evaluated on two angles: economic efficiency and social performance. Within
the scope of corporate governance, it is primarily interested in economic efficiency. This is an
economic category reflects the utilization of corporate resources to achieve the best results with
the most reasonable cost. Thus the economic resources especially funds of enterprises have a
huge impact on the efficiency of production and business enterprises. Therefore, improving the
efficiency of capital is required nature and often mandatory for businesses. Efficiency rating
which will help us to see the performance in general business management and in particular the
use of capital.
Above, we have analyzed each common traits, individual financial situation of Honda Motor
Company. From this analysis, partly to see the positive aspects and limitations exist. For the
positive side, the enterprise should continue to develop further, while the surface is limited to
strive to find remedies.
To survive was difficult to stand even more difficult. Now, the problem is now overcome the
difficulties incurred in the enterprise. These problems hinder the path of business development.
From that judgment, plus an understanding of the business situation, 8 group strongly suggest
some recommendations to the desired small contribution to the development of the whole
enterprise.
4.4.1. Measures to increase the efficiency of fixed capital.
Fixed asset management: production line layout reasonable, mining capacity and improve
operating efficiency of machinery, solving all the fixed assets no longer needed or outdated also
consistent with the scale of production to recover fixed capital investment more modern
machinery and equipment to improve product quality. Or put into rotation, added to liquid
assets to produce more business.
For effective use of fixed capital in production and business activities, often need to implement
measures to not only preserve but also to develop the fixed capital of the business after each
business cycle. The essence is to ensure monetary amounts of capital to the end of a cycle, with
the number of capital can now withdraw or extend the amount of capital that businesses spent
initially to purchase investment fixed assets at current prices.
Must appreciate the value of fixed assets, facilitate accurate reflection of the state of affairs of
fixed capital, to preserve capital. Timely adjustments to facilitate exactly calculation of
depreciation expense, not to lose WC.
Determining the right time to use the fixed assets to determine the appropriate level of
depreciation, not to lose capital and minimize adverse h¬uong image of intangible
amortization.
Improving the efficiency of fixed assets of the business is all about time and productivity.
Timely disposal of fixed assets are not needed or did h¬u damage, no excessive reserves of
fixed assets not needed.
Well done maintenance mode, repair, preventive fixed assets not to happen down of fixed
assets hu¬ tr¬uoc h¬u down time or unusual damage to stop production. In the case of fixed
assets to conduct major repairs to consider, carefully calculate its performance. That is,
considered between costs should spend the first new shopping t¬u fixed assets to make a
decision accordingly.
Enterprises must actively implement measures to prevent risks in the business to limit losses of
fixed capital due to the objective reasons nhu¬: property insurance, the financial reserve fund ...
4.4.2. Measures to increase the efficiency of working capital.
Through analysis of the use of working capital Honda Motor Company in recent years shows
the capital needs of the company is very large but regular working capital is not sufficient to
meet demand.
So that led to the company to raise outside capital to finance working capital needs. Working
capital deficiency caused major debt situation. To avoid this situation when the construction
company working capital levels should be based on the specific situation in tr¬uoc of a
construction company working capital norms consistent with the financial situation of
enterprises do not cause shortage of working capital. At the same time to build working capital
norms for each quarter, each month to plan production suitable not wasters in the period.
While the Company's working capital, the company still missing other objects are still
occupied, this is not reasonable. So the debt collection business in the future need of a resolute
d¬uoc. In addition, businesses should also consider the liabilities for each customer t¬uong. If
customers have low prestige, now wants to sell should not be too wide to avoid risk. For trade
credit policy th¬uong reasonable business need to assess your level of risk or reputation of the
client. Need to carefully evaluate the impact of policies sold subject to corporate profits.
To assess the level of risk can be found in the sale of products can now consider the aspects
nhu¬ prestige level of the customer, general financial condition of the company, the value of
the products used to guarantee credit. In general, for each policy sold subject to business need
careful assessment in accordance with the following main parameters:
- Number of products l¬uong d¬uoc expected consumption.
- Selling price.
- The additional costs incurred for increasing the debt.
- The discount accept.
- The average debt collection period for the debt.
- Predict the number of customer accounts receivable.
The remedies and limited customer accounts receivable:
- Create a good image for your business to meet customer demand for such products quality,
delivery on time ... from which customers can easily arise goodwill in their business
transactions.
- Reduced price for customers ordering in bulk, or early payment
- Reminders, urging customers to their debts to their business when they are due.
- Agreement with the payment if the material is not enough business to pay cash but with
materials stored in the warehouse, it helps firms solve a debt capital for inventory and helps
businesses their part to save costs when buying materials outside the business conditions are
common materials.
- If your debts are too many businesses that can not afford the payment, then we can use that
debt to contribute capital to the business.
- Check the level of credibility and solvency of their business prior to selling debt.
- For bad debts should use measures such as reducing and reschedule if the solvency of
troubled businesses, sold debt for the debt buying business, legal use tool.
- At the same time in the stage of working capital reserves also make efficient use of working
capital decreases. When determining production needs during the early years of the company
should determine the appropriate reserves and rapid liberation of reserve assets if there is
excess.