Graphene oxide enhanced adsorption capacity of chitosan/magnetite nanocomposite for Cr(VI) removal from aqueous solution
Bạn đang xem bản rút gọn của tài liệu. Xem và tải ngay bản đầy đủ của tài liệu tại đây (1.33 MB, 11 trang )
Mater. Res. Express 6 (2019) 025018
/>
PAPER
RECEIVED
12 September 2018
Graphene oxide enhanced adsorption capacity of chitosan/
magnetite nanocomposite for Cr(VI) removal from aqueous solution
ACCEPTED FOR PUBLICATION
1 October 2018
PUBLISHED
9 November 2018
Hoang V Tran1
1
2
3
, Tuong L Tran2, Truong D Le1,3, Thu D Le1, Hang M T Nguyen3 and Le T Dang3
School of Chemical Engineering, Hanoi University of Science and Technology, 1 Dai Co Viet Road, Hanoi, Vietnam
Agro-Forestry-Aquaculture Department, Quang Binh University, 312 Ly Thuong Kiet Street, Dong Hoi City, Quang Binh Province,
Vietnam
Faculty of Environment, Thuyloi University, 175 Tay Son Street, Hanoi, Vietnam
E-mail:
Keywords: Fe3O4/graphene oxide/chitosan (FGCs) nanocomposite, Cr(VI) removal, recoverable and recyclable adsorbent, magnetite,
heavy metal ions removal
Supplementary material for this article is available online
Abstract
In this work, we propose a simple method for preparing of Fe3O4/graphene oxide/chitosan (FGCs)
nanocomposite and its application for removal of Cr(VI) from aqueous solution by adsorption
process. The advantages of this adsorbent that it can be recovered by an external magnet as well as it
can be regenerated. For that, FGCs nanocomposite has been synthesized co-precipitation method and
synthesized FGCs has been characterized by x-ray diffraction (XRD), Fourier-Transform Infrared
spectroscopy (FT-IR), vibrating sample magnetometer (VSM), Transmission Electron Microscopy
(TEM), Field Emission Scanning Electron Microscopy (FESEM) and Energy Dispersive x-ray
spectroscopy (EDX). The sorption efficiency of FGCs was evaluated by adsorption Cr(VI) ions from
aqueous solution to optimize contents in FGCs adsorbent material and also for adsorption process.
The results shown that the adsorption of Cr(VI) on FGCs can be reached to maximal with the content
of FGCs is 68 wt% of Fe3O4 nanoparticles, 2 wt% of graphene oxide (GO) and 30 wt% of chitosan (CS)
(sample FGCs-68/2/30). The adsorption process was carried out at pH3 (pH=3) with the contact
time ca. 40 min and dosage of adsorbent around 0.04 mg.mL−1.The adsorption isotherm fits the
Langmuir model with adsorption capacity of FGCs-68/2/30 for Cr(VI) is 200 mg.g−1. In addition, the
reusability of FGCs nanocomposite was tested and about 75% of removal efficiency was obtained after
6 cycles. Therefore, the FGCs nanocomposite has a good stability and may be a promising material for
removal of heavy metal ions from aqueous solution to clean up the environment.
1. Introduction
The pollution in groundwater and seawater is a serious problem affecting the human life. With the development
of the industry, textile, dyeing, leather and plasticK factories are constantly developing and create the pollution
to the environment. Water pollution with toxic heavy metal ions such as Hg2+; Pb2+; Cd2+; Cu2+; Ni2+K
contaminant constitutes a serious environmental hazard in particular for aquatic bio-systems, where symbiotic
processes may be affected. According to the World Health Organization (WHO) , the limit of Cr(VI) in potable
water is 0.05 mg L−1 (EPA, 1990) [1]; Pb(II) is 0.015 mg L−1 (EPA, 1992) [2]; Cd(II) is 50 μg/LK These heavy
metal ions are easy to be absorbed to the human body, they can invade the human organs, lead to liver damage,
skin diseases and may cause cancers. In the aquatic environment, chromium exits mainly in two states, Cr (III)
and Cr(VI) where Cr(VI) is the most toxic [3]. Because of Cr(VI) ions are easy to dissolve and diffuse in the tissue
therefore they are necessary to remove them from contaminated water. There are various technologies for
removal of Cr(VI) ions from aqueous solution such as: ion exchange, chemical precipitation, membrane
filtration and biological treatment [4, 5]. However, these methods shown practical disadvantages such as poor
stability, high cost, create a secondary pollution in extreme conditions [6].
© 2018 IOP Publishing Ltd
Mater. Res. Express 6 (2019) 025018
H V Tran et al
The adsorption processes are the most common method to remove Cr(VI) from aqueous solution because of
its high efficiency and low cost, can adsorb effectively even in low concentration of heavy metal ions [7, 8]. A
recent literature review focused on the use of the GO materials as promising adsorbent materials for the removal
of heavy metal ions from the water [9–11]. Graphene oxide is made of single layer of carbon atoms which are
closely packed into honeycomb two dimensional (2D) lattices [9, 10, 12–14]. Having the large surface area
(∼2630 m2 g−1) [15], oxygen containing surface functionalities such as hydroxyl, carboxylic, carbonyl, and
epoxide groups, and high water solubility makes GO become a material of great interest in adsorption-based
technologies as well as in other fields. Many research groups have reported the use of GO as adsorbent material
for heavy metal ions removal: Zhang et al [6] have used reduced GO (rGO) to adsorb Cr(VI) with the maximum
adsorption capacity can reach 198 mg g−1, Yang et al [16] showed the adsorption capacity of Cu(II) ions on GO is
46.6 mg/g, Wang et al [17] concluded that the suitable pH for Zn(II) removal was 7.0 with the adsorption
capacity was up to 246 mg/g or rGO is even used for enhanced ultraviolet protection applications. However, in
experiment, the dispersion of single-layered GO are difficult to remove out from water after adsorption
processes. On the other hand, the hybrids of graphene with magnetic nanomaterials have been extensively
exploited for removal of pollutants from water. Fe3O4 is the most frequently used materials for water
purification due to its high biocompatibility which ensures safety and also the magnetic properties which makes
it easy to collect post- treatment. After the adsorption, Fe3O4 –graphene composite can be easily separated out
from the solution via an external magnet bar. Yao et al used Fe3O4@graphene to dye removal from aqueous
media with the adsorption capacities on methylene blue were 45.27 mg g−1 and Congo red were 33.66 mg g−1
[18]. Uheida et al used Fe3O4 and ɤ-Fe2O3 for the removal of Co2+ ions [19]. Zhou et al synthesized Fe3O4
composed polypyrrole and grapheme oxide to mercury adsorption [20].
In the previous work, we have presented the use of Fe3O4/chitosan for removal of Ni2+ and Pb2+ by
complexation of Ni2+ and Pb2+ ions with amino (–NH2) groups of chitosan [21]. After that, this material was
used to removal of Cr(VI) ions by attraction of negative charge of Cr(VI) ions with positive charge of –NH3
groups of chitosan [22]. In this work, we have used GO to improve the surface area of Fe3O4/chitosan. Kinetic,
adsorption isotherm and recycle ability were also studied to understand the mechanism of adsorption.
2. Experimental
2.1. Materials
Graphite was extracted from pencils which were purchased from a local bookstore. Other chemicals, such as
sulfuric acid (H2SO4) 98 wt%, sodium nitrate (NaNO3), potassiumpermanganate (KMnO4), hydrogen peroxide
(H2O2) solution 30 wt%, FeCl3.6H2O, FeSO4.4H2O, acetic acid (CH3COOH) solution 30 wt%, were purchased
from Sigma Aldrich.Sodium hydroxide (NaOH) flakes and hydrochloric acid (HCl) solution were purchased
from Duc Giang Chemical Company (Vietnam). Chitosan was extracted from shrimp shell following previous
report [21].
2.2. Preparation of Fe3O4/graphene oxide/ chitosan nanocomposite (FGC)
Graphene oxide was synthesized from pencil’s graphite using Hummer’s method [23]. Then after, the
Fe3O4/graphene oxide/chitosan nanocomposite (FGCs) was synthesized following previous report using coprecipitation method from three solutions of precursor materials: (i) a solution of Fe2+ and Fe3+ ions was
prepared by dissolving of FeSO4.4H2O and FeCl3.6H2O appropriate molar ratio of Fe2+: Fe3+ of 2: 1 into
distilled water; (ii) GO solution was prepared by dispersion on graphene oxide into distilled water under
sonication condition. (iii) Chitosan solution (0–60 wt%) was prepared by adding chitosan into an acid acetic
1 v/v.% solution. These solutions were mixed and neutralize to pH8 by NaOH 1 M. FGC has formed as black
precipitation in solution and it will be collected by external magnet bar and then washed by distillated water and
dried at 80 °C for 8 h.
2.3. Cr(VI) removal procedure
0.04 g FGC powder was added into a 10 ml of 200 mg.L−1Cr(VI) solution. The mixture was incubated for
various contact times at different temperatures. To adjust pH in range of pH2 to pH10, the 0.1 M HCl and 0.1 M
NaOH solutions were used. The residue concentration of Cr(VI) in solution after adsorption process has been
obtained by measure UV–vis spectra and using a calibration curve for determining of Cr(VI) concentration in
solution (figure SI.2(b) is available online at stacks.iop.org/MRX/6/025018/mmedia).
2
Mater. Res. Express 6 (2019) 025018
H V Tran et al
2.4. Batch adsorption and kinetic experiment
The amount of Cr(VI) uptake by FGCs (qe, mg.g−1) was calculated following equation:
qe =
C0 - Ce
ma
(1)
The Langmuir equation (2) and Freundlich equation (3) isotherms can be linearized into the following
forms:
Ce
1
1
=
+
· Ce
qe
KL · q max
q max
logq e = logKF +
1
logCe
n
(2)
(3)
Where: C0 and Ce (mg.L−1) are the initial and equilibrium concentrations of Cr(VI) in solution, respectively;
ma is the concentration of FGCs (g.L−1); qe, qmax is the equilibrium Cr(VI) concentration on the adsorbent and
the monolayer capacity of the adsorbent (mg.g−1), respectively. KL is the Langmuir constant (L.mg−1) and
related to the free energy of adsorption; KF is the Freundlich constant (L.g−1) and n (dimensionless) is the
heterogeneity factor.
2.5. Materials characterization
Absorbance measurements (UV–vis) spectra were measured using Agilent 8453 UV–vis spectrophotometer
system with the wavelength in a range of 200–1200 nm. X-ray Diffraction (XRD) patterns of CS, GO and FGCs
samples were obtained at room temperature by D8 Advance, Bruker ASX, using CuKα radiation (λ=1.5406 Å)
in the range of 2θ=10°–60°, and a scanning rate of 0.02 s−1. Morphology of GO and FGCs nanocomposite
were analyzed by Field Emission Hitachi S-4500 Scanning Electron Microscope (FE-SEM) and Transmission
Electron Microscope (TEM, JEOL, Voltage: 100 kV, magnification: ×200,000), respectively. The magnetic
behaviors of the samples were measured at room temperature using a vibrating sample magnetometer (VSM 880
DMS/ADE Technologies, USA) at fields ranging from −10 to 10 kOe at 25 °C, with accuracy of 10−5 emu.
Chemical composition of samples was determined by JEOL Scanning Electron Microscope and Energy
Dispersive x-ray (SEM/EDS) JSM-5410 Spectrometer. The infrared (IR) spectra were recorded by Nicolet FT-IR
Spectrometer model 205 with KBr pellets in transmission mode in the region from 500 cm−1 to 4000 cm−1.
3. Results and discussion
3.1. Characterizations of FGCs
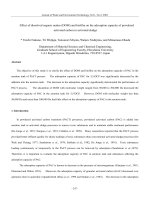
Figure 1(A) showed XRD patterns of pure CS (curve a); GO (curve b); pure Fe3O4 (curve c); Fe3O4/GO/CS
(FGC) (curve d). Six characteristic peaks for Fe3O4 corresponding to (220), (311), (400), (422), (511) and (440)
were observed in Fe3O4 and FGC sample (JCPDS file, PDF No. 65-3107) [21, 23], which indicated the forming of
FGC composite did not result in phase change of Fe3O4. XRD pattern of GO (figure 1(A), curve b) shows (002)
diffraction peak at 2θ=9.98° indicating the distance between graphene layers. However, in FGCs nanomposite
samples (figure 1(A), curve d), this peak disappeared due to a very low content of GO in these samples. From the
XRD parameters of graphene oxide (figure 1(A), curve b), the interlayer distances (d(002)) in the graphene oxide
were estimated using Bragg’s Law [24] of ca. d(002)=0.885 nm. The mean dimension of the crystallite
perpendicular to the plane of graphene samples L002 can be determined using Debye–Scherrer equation (4):
L 002 =
k. l
b . cos q
(4a)
Where, k=0.94 is the shape factor, β is the full width at half maximum given in radians, λ is a wavelength of
x-ray (λ=0.154 06 nm), and θ is the angle between the incident ray and the scattering planes. Therefore, L002
was calculated of ca. 3.23 nm and the thickness of obtained GO was calculated of around N=4÷5 layers
(detailed calculating was described in section I of supporting information).
Figure 1(B) shows FT-IR spectra of CS (curve a), the adsorption at 3578 cm−1 is due to the stretching
vibration of O-H group, the band at approximately 2881 cm−1 reflects the C–H stretching vibration of the –CH2
groups in chitosan and the characteristic adsorption bands at 1674 and 1589 cm−1 ascribes to C=O stretching
and N-H blending in amide groups of chitosan [25, 26]. In FT-IR spectrum of pure Fe3O4 (figure 1(B), curve b),
the peak at 610 cm−1 is attributed to Fe–O group, the peak around 3420–3422 cm−1 can be related to the –OH
group of adsorbed water [21]. In the spectrum of GO (figure 1(B), curve c), the peaks at 1739, 1610 and
1463 cm−1 is due to the stretching vibration of C=O bond of carboxyl groups, the skeletal C–C vibrations of unoxidized graphene domains and the vibrations of alkoxy C–O [7]. The adsorption at 3568 cm−1 is attributed to
the stretching vibration of O–H group of adsorbed water and a sharp absorption peak at 3371 cm−1 depicts the
3
Mater. Res. Express 6 (2019) 025018
H V Tran et al
Figure 1. (A) XRD patent of (a) CS; (b) GO; (c) Fe3O4; and (d) FGC (with Fe3O4/GO/CS ratio was 68/2/30 as wt%); (B) FT-IR spectra
of (a) chitosan (CS); (b) Graphene Oxide (GO); (c) Fe3O4 and (d) FGC nanocomposite.
stretching vibrations of the surface hydroxyl (–OH) groups on the GO [27]. In the specific spectrum of FGC
(curve d), compared with the spectra of CS and GO, we see that, a O–H group band at 3578 cm−1 had a weak
intensity, proves the physical water in chitosan was evaporated during synthesis and calcination. It also shows
that there are some shift bands of amide groups in spectrum of FGC (1674 and 1589 cm−1 in chitosan shifted to
1597, 1516 and 1394 cm−1, respectively). Besides, there are some peaks at around 563 cm−1 ascribe to Fe–O
groups of Fe3O4 nanoparticles in FGC nanocomposite, however, it can be seen that the peak at 610 cm−1 of Fe–
O group in pure Fe3O4 (figure 1(B), curve b) was shifted to 563 cm−1 in FGC (figure 1(B), curve d), which
indicates that Fe3O4 are linked successfully to GO and CS. These results indicate an enhanced hydrogenbonding interaction between chitosan and the fillers by using both Fe3O4 and GO [25].
The magnetization hysteresis loops of the pure Fe3O4 nanoparticles and FGC nanocomposite are presented
in figure SI.1. Based on the plot of magnetization (M), magnetic field (H) and its enlargement near the origin, the
saturation magnetization (Ms), remanence magnetization (Mr), coercivity (Hc) and squareness (Sr=Mr/Ms)
could be calculated. Because of no remanence and coercivity, it can be suggested that the pure Fe3O4 and FGC
sample are superparamagnetic [21, 23]. In addition, results in figure SI.1 shown that the saturation
magnetization values (Ms) for pure Fe3O4 and FGCs nanocomposite was 40.4 emu.g−1 and 20.2 emu.g−1,
respectively. These results indicated that FGC sample exhibited typical superparamagnetic behavior and high
saturation magnetization value (Ms), therefore the FGC nanocomposite sample can be easily removed from
solutions and recycled by applying an external magnetic field.
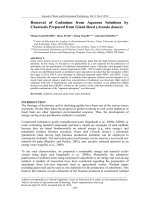
Figures 2(a) and (b) show FE-SEM images of the obtained GO flakes. The GO material consisted of randomly
aggregated, thin, crumpled sheets closely associated with each other to form a disordered solid. The images of
Fe3O4/chitosan composite are showed in the figures 2(c) and (d). It can be seen that the material has porous
4
Mater. Res. Express 6 (2019) 025018
H V Tran et al
Figure 2. FESEM of (a), (b) pristine GO; (b), (c) CS/Fe3O4 nanocomposite; (e), (f) FGC nanocomposite. FESEM images were taken at
(a), (c), (e) low magnification and (b), (d), (f) high magnification.
surface and much holes. Figures 2(e) and (f) showed that FGCs have the surface more porous than Fe3O4/CS
material. In figures 2(f), it can be seen that Fe3O4 nanoparticles, which particles size around of 30–40 nm, were
deposited onto GO sheets. It can be explained that the role of GO in FGC creating the new 3D structures, make
increasing the surface area with high porosity. It is very promissory in applications FGC for adsorbing
Cr(VI) ions.
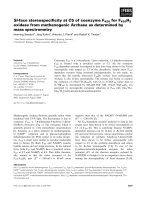
The morphologies of GO and FGCs were also investigated by TEM (figure 3). The results revealed that GO
(figure 3(a)) has layered-like structure with some wrinkled edges; the layer is very thin and transparent. TEM of
Fe3O4 nanoparticles (figure 3(b)) showed strong agglomeration of 20–40 nm of Fe3O4 nanoparticles. With
Fe3O4/chitosan nanocomposite (figure 3(c)) the agglomeration degree is lower than in Fe3O4 only. In case FGCs
sample, the spherical Fe3O4 nanoparticles with diameter is about 25 nm were obtained and uniform on the
surface of GO sheets (figure 3(d)).
3.2. Adsorption Cr(VI) ions
The UV–vis spectra of Cr(VI) solutions with different concentrations are shown in figure SI.2(a) and calibration
curve for determining of Cr(VI) concentration in solution has been generated by drawing the optical density at
5
Mater. Res. Express 6 (2019) 025018
H V Tran et al
Figure 3. TEM of (a) GO; (b) Fe3O4 nanoparticles; (c); Fe3O4/CS nanocomposite and (d) and FGC nanocomposite.
wavelength of 360 nm (OD360nm) vs. Cr(VI) concentration in solution (figure SI.2(b)). This curve has been used
to determine the residue concentration of Cr(VI) in solution after adsorption process.
Contact time of Cr(VI) ions adsorption was studied from determination of absorbance after adsorbed. Effect
of contact time was shown in figure SI.3. Results showed that the longer contact time, the higher adsorption
capacity. It can be seen in figure SI.3, in the first 40 min, the concentration of Cr(VI) ions is adsorbed rapidly.
From 40 to 60 min, the adsorption was on the slight increase and achieves balance at 60 min. The adsorption rate
of Cr(VI) on FGCs adsorbent (v, mg.L−1.s−1) can be estimated using following equation:
v=-
dC
C - Co
C - Co
=- t
=- t
dt
t-0
t
(4b)
Here, Ct and C0 (mg.L−1) are considering time and the initial concentrations of Cr(VI) in solution, respectively.
Following the Lambert Beer’s equation:
A = e (l).l.C
(5)
Where: A is absorption; C is concentration of chromium (VI) solution vs. time so that the absorption (A) respects
to concentration (C). Therefore, equation (4) can be modified to equation (6) below:
v=-
C t - Co
A - Ao
=- t
t
t
(6)
The reaction order respect to chromium ions is calculated by the plot between velocity (inversely proportional to
time) and the absorption (figure SI.4). The obtained plot is nearly linear with the correlation coefficients
(R2=0.9843) that means the reaction order respect to Cr(VI) is 1 (the first order law).
Beside of contact time, pH of solution also affects the adsorption process. For study the effect of pH on
Cr(VI) adsorption, experiments have been done with different pH values from 1 to 10 at an initial Cr(VI)
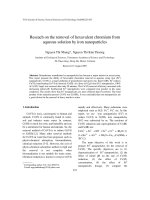
concentration of 100 mg L−1 and with adsorbent doses of 0.04 mg. The results indicate that, figure 4(a), in acid
condition from pH1 to pH3, the equilibrium Cr(VI) concentration on the adsorbent (qe, mg.g−1) were of 42 to
95 mg g−1, however, when pH was changed from pH3 to pH10, the obtained qe has been decreased. These
results suggested that in acidic condition of solution, chromium ion removed was many. To explain this trend,
−
2−
the form of chromium ion was considered. At low pH, chromium ion exits mainly in Cr2O2−
7 ; HCrO4 , Cr3O10
2−
−
and Cr4O13 form whereas hydrogenchromate ion (HCrO4 ) is dominated between pH 1.0 and 4.0 [1]. As the
pH increases, this form shifts to Cr2O2−
7 . The high adsorption efficiency at low pH is attributed that there are so
6
Mater. Res. Express 6 (2019) 025018
H V Tran et al
Figure 4. (a) Effect of pH on equilibrium adsorption (qe, mg.g−1) of Cr(VI) by FGC nanocomposite; (b) Influence of temperature on
the Cr(VI) adsorption on FGC nanocomposite. Experiment conditions: C0=200 mg l−1; T=10 °C; 20 °C; 30 °C; 40 °C; 50 °C;
pH=3; contact time: 1 h); (c) Effect of GO content in FGC nanocomposite to Cr(VI) removal. Experiment conditions:
C0=200 mg l−1; T=25 °C; contact time: 1 h; (d) Effect of CS content in FGC nanocomposite to Cr(VI) removal. Experiment
conditions: C0=200 mg l−1; T=25 °C; contact time: 1 h; (e) Influence of adsorbent amount on equilibrium adsorption (qe,
mg.g−1). Experiment conditions: C0=200 mg l−1; T=25 °C; m=0,01; 0,02; 0,04; 0,06; 0,08 (g); pH=3;1 h.
many hydronium ions (H+) surround the surface of Fe3O4/GO, which will promote the attraction of HCrO−
4
(or Cr2O2−
7 ) anions on the surface by electrostatic attraction. With increasing pH, the lesser hydronium ions, the
electrostatic attraction between Fe3O4/GO and Cr(VI) anions is weaken, thus reducing the sorption efficiency.
In this work, the maximum of Cr(VI) ions adsorption is at pH3 (figure 4(a)).
The influence of temperature on the adsorption capacity of chromium ions is shown in figure 4(b). It can be
seen that the adsorption capacity increases with the increasing of temperature of 30 °C. Over this temperature,
the adsorption decreases. It may be due to this material is less stable at high temperature. At the high
temperature, the pore site of chitosan is miniatured and inactivation of adsorbent surface [6].
7
Mater. Res. Express 6 (2019) 025018
H V Tran et al
The thermodynamic parameters of the adsorption process such as enthalpy change (ΔH), entropy change
(ΔS) and free enthalpy change (ΔG) of reaction are obtained from experiments using the following equations
[28]:
DS 0
DH 0
R
RT
(7)
DG 0 = DH 0 - T DS 0
(8)
ln
qe
Ce
−1
=
−1
Where, R is gas constant (R=8,314 J.mol .K ), Ce is the equilibrium concentration of Cr(VI) ions
(mol.L−1), T is absolute temperature (oK). From the linear fit of ln(qe/Ce) versus 1/T, we will calculate ΔH0 and
ΔS0 values are 25.72 kJ.mol−1 and 182 J.mol−1.K−1 respectively. The positive value of enthalpy change and
entropy indicate the adsorption process is endothermic and the increasing of randomness during the sorption of
Cr(VI) ions onto FGCs surface [28]. The values of ΔG0 at 283, 293, 303, 313 and 323 °K are −25.8; −27.6;
−29.4; −31.2 and −33.1 (kJ.mol−1) respectively. The negative values indicate that the adsorption Cr(VI) ions
process is spontaneous [29].
To investigate the effect of GO content on the adsorption capacity of Cr(VI) ions, we keep the amount of
chitosan is constant (except one sample has only Fe3O4 in its content) and change content of GO from 0 to
12.5 wt%. The amount of adsorbent is still 0.04 g at pH3 and room temperature. Figure 4(c) shows that over
2 wt% of GO, the adsorption capacity decreases. The reason maybe dues to with the increasing of GO amount,
the adsorption sites on the surface increase and get equilibrium state with the fix amount (2 wt%). After that, the
distribution of chitosan and GO on the surface decreases make adsorption site decreases. The result is the
removal decreases respectively [6]. Especially, without CS and GO, the adsorbent cannot adsorb any heavy metal
(chromium) (the dash line in figure 4(c)). That means Fe3O4 only has magnetic properties which makes the
adsorbent easy to collect post- treatment. In next works, we fixed the GO content of 2 wt% and change CS
content in range from 0 to 60 wt%. The results show that (figure 4(d)) the adsorption capacity increases with the
increasing of CS content. Over 30 wt%, the adsorption capacity of FGC nearly gets balance. The adsorbent
amount greatly affects the adsorption capacity of chromium ions. To optimize the adsorbent amount, we change
the content of substance from 0.01 to 0.08 mg. Figure 4(e) shows that the optimized amount of adsorbent
is 0.02 g.
3.3. Adsorption isotherm
In order to optimize the use of FGCs for Cr(VI) removal, it is important to establish the most appropriate
adsorption isotherm. The amounts of Cr(VI) in the solution were determined after equilibration and its
concentration in solution was be extracted from calibration curve. The result is shown in figure 5 and table 1.
The data of the Cr(VI) adsorbed at equilibrium (qe, mg.g−1) and the equilibrium Cr(VI)concentration (Ce,
mg.L−1) were fitted to the linear form of Langmuir adsorption model. The obtained results are shown on figure 5
2
with the obtained correlation coefficients (R2Langmuir =0.9557 and RFreundlich
=0.947 06) showed that dye
adsorption equilibrium data were fitted well to the Langmuir isotherm (figure 5(A)) rather than Freundlich
isotherm (figure 5(B)). The maximum monolayer capacity qmax and KL the Langmuir constant (L.mg−1) were
calculated from the Langmuir model as 200 mg.g−1 and 0.0245 L.mg−1, respectively. Compare to the other
adsorbent, such as magnetite/chitosan (55.8 mg.g−1), acid activated carbon (71 mg.g−1) [30], nano iron oxide
impregnated in chitosan bead (NIOC) (69.8 mg.g−1) [31] or waste tire (174.55 mg.g−1) for adsorption of Cr(VI)
(table 2), FGCs has a higher adsorption efficiency.
3.4. Regeneration studies
The adsorption mechanism of Cr(VI) onto FGCs adsorbent is proposed in figure 6(A). Here, amino (–NH2)
groups of chitosan coating on FGCs surface in acidic solution (pH3) have been protonated as (–NH+
3 ) as positive
charge on FGCs’s surface. By excess hydrogen ion, the FGCs adsorbent becomes cations and they are easy to
−
attract chromium anions (as CrO2−
4 , HCrO4 K as negative charge) on the surface by electrostatic attraction and
thereby the results the adsorption efficiency increases.
To confirm that Cr(VI) ions have been loaded on FGC after adsorption, we have analyzed FESEM and EDX
of FGCs before and after Cr(VI) adsorption. FESEM micrographs of FGC nanocomposite before and after their
exposure to Cr(VI) solution was shown on figures 6(b) and (c), respectively. It can be seen that the different
surface morphology of FGC before and after Cr(VI) adsorption. Energy dispersive x-ray spectroscopy (EDX) of
original FGCs sample includes only C, O, Fe form their compositions (figure 6(d)), however, after adsorption
Cr(VI), two new peaks have appeared at 0.5 keV and 5.5 keV which can be attributed to successfully adsorbed
Cr(VI) on FGC surface.
After Cr(VI) adsorption, FGCs can be recovered from working solution using an external magnet
(figure 6(B)). Then, FGCs can be recycled using NaOH solution, because of in alkaline solution, –NH+
3 groups
will be de-protonated to be –NH2 groups therefore Cr(VI) ions have been de-adsorbed and so that FGC will be
8
Mater. Res. Express 6 (2019) 025018
H V Tran et al
Figure 5. (a) Langmuir plot and (b) Freundlich plot.
Table 1. The parameters for the Langmuir and Freundlich models.
Langmuir
qm (mg/g)
200
Freundlich
KL
R2
n
KF
R2
0,025
0,9557
0,854
3,104
0,94 706
Table 2. Comparison of the Cr(VI) adsorption capacity of some adsorbents.
Adsorbents
Reduced graphene oxide/NiO (RGO/NiO) nanocomposites
Fe3O4 hollow microspheres/graphene oxide composite
Magnetic chitosan nanoparticles
Natural clay
FGC nanocomposite (Fe3O4/CS/GO)
Activated carbon (AC)
Acid activated carbon
Nano iron oxide impregnated in chitosan bead (NIOC)
Modified graphene oxide /chitosan composite (GEC)
Chitosan/montmorillonite magnetic microspheres
Waste tire
9
Cr(VI) adsorption capacity, qm (mg/g)
References
198
32.33
55.80
15.67
200
3.46
71
69.8
86.17
58.82
174.55
[6]
[7]
[22]
[32]
This work
[33]
[30]
[34]
[35]
[36]
[37]
Mater. Res. Express 6 (2019) 025018
H V Tran et al
Figure 6. (a) Illustration scheme for adsorption of Cr(VI) onto FGC surface; (b), (c) FESEM of FGC nanocomposite surface: (b), (c)
before and (e), (f) after adsorption Cr(VI), respectively; EDX of FGC nanocomposite (d) before and (g) after adsorption of Cr(VI),
respectively; (h) digital photos of (1) initial Cr(VI) solution; (2) a mixture solution of Cr(VI) solution and FGC nanocomposite as
adsorbent; and (3) removal of FGC nanocomposite from solution after adsorption process by external magnet; (i) Effect of recycling
adsorbents on FGC nanocomposites at experiment conditions: C0=200 mg l−1; m=0,04 g; T=25 °C; pH=3; and contact time
of 1 h.
regenerated. To evaluate the recyclable of the FGC nanocomposite, we performed the desorption experiments.
As can be seen in figure 6(C), the sorption capacity of Cr(VI) ions decreases with the increasing cycle number.
After 6 cycles, the adsorbed efficient is about 75% of the first cycle (after 6 cycles, qmax∼150 mg.g−1).
10
Mater. Res. Express 6 (2019) 025018
H V Tran et al
Therefore, it can be concluded that the FGCs nanocomposite has a long-term stability and can be used as an
excellent adsorbent for removal of Cr(VI) ions.
4. Conclusion
In summary, FGCs nanocomposite is used for the removal of Cr(VI) ions from aqueous solution. The acidic
condition is favoured for Cr(VI) removal with the maximum adsorbed efficiency is at pH3. The adsorption
isotherms was studies revealed that the adsorption process of Cr(VI) on FGCs was fitted the Langmuir isotherm
model and adsorption capacity of FGCs was found of 200 mg.g−1. After 6 cycles of Cr(VI) adsorption, the Cr(VI)
sorption capacity of FGCs was about 75% comparing to original sample. Based on the obtained results, FGCs
nanocomposite is high recommendation used for a magnetically separable adsorbent for highly efficient Cr(VI)
ion removal from water.
ORCID iDs
Hoang V Tran
/>
References
[1]
[2]
[3]
[4]
[5]
[6]
[7]
[8]
[9]
[10]
[11]
[12]
[13]
[14]
[15]
[16]
[17]
[18]
[19]
[20]
[21]
[22]
[23]
[24]
[25]
[26]
[27]
[28]
[29]
[30]
[31]
[32]
[33]
[34]
[35]
[36]
[37]
Kobya M 2004 Bioresource Technology. 91 317–21
Farghali A A, Bahgat M, Enaiet Allah A and Khedr M H 2013 Beni-Suef University Journal of Basic and Applied Sciences. 2 61–71
Sharma D C, Chatterjee C and Sharma C P 1995 Plant Science. 111 145–51
Li L, Zhang J, Li Y and Yang C 2017 Journal of Membrane Science. 544 333–41
Kongsricharoern N and Polprasert C 1995 Water Science and Technology. 31 109–17
Zhang K, Li H, Xu X and Yu H 2018 Microporous and Mesoporous Materials. 255 7–14
Liu M, Wen T, Wu X, Chen C, Hu J, Li J and Wang X 2013 Dalton Transactions. 42 14710–7
Zaini M A A, Okayama R and Machida M 2009 Journal of Hazardous Materials. 170 1119–24
Thangavel S, Thangavel S, Raghavan N, Krishnamoorthy K and Venugopal G 2016 Journal of Alloys and Compounds. 665 107–12
Pandiyarasan V, Archana J, Pavithra A, Ashwin V, Navaneethan M, Hayakawa Y and Ikeda H 2017 Materials Letters. 188 123–6
Fakhri A 2017 Journal of Saudi Chemical Society. 21 S52–7
Krishnamoorthy K, Ramadoss A and Kim S-J 2013 Science of Advanced Materials. 5 406–10
Krishnamoorthy K, Veerapandian M, Yun K and Kim S J 2013 Carbon 53 38–49
Krishnamoorthy K, Jeyasubramanian K, Premanathan M, Subbiah G, Shin H S and Kim S J 2014 Carbon 72 328–37
Ma H, Zhang Y, Hu Q-H, Yan D, Yu Z-Z and Maolin Z 2012 Journal of Materials Chemistry. 22 5914–6
Yang S-T, Chang Y, Wang H, Liu G, Chen S, Wang Y, Liu Y and Cao A 2010 Journal of Colloid and Interface Science. 351 122–7
Wang H, Yuan X, Wu Y, Huang H, Zeng G, Liu Y, Wang X, Lin N and Qi Y 2013 Applied Surface Science. 279 432–40
Yao Y, Miao S, Liu S, Ma L P, Sun H and Wang S 2012 Chemical Engineering Journal. 184 326–32
Uheida A, Salazar-Alvarez G, Björkman E, Yu Z and Muhammed M 2006 Journal of Colloid and Interface Science. 298 501–7
Zhou C, Zhu H, Wang Q, Wang J, Cheng J, Guo Y, Zhou X and Bai R 2017 RSC Advances. 7 18466–79
Tran H V, Tran L D and Nguyen T N 2010 Materials Science and Engineering: C 30 304–10
Nguyen T N, Pham H T B, Le H T T, Le A N, Tran H V, Vu H D, Le D H, Nguyen K V and Tran L D 2013 Materials Science and
Engineering: C 33 1214–8
Tran H V, Bui L T, Dinh T T, Le D H, Huynh C D and Trinh A X 2017 Materials Research Express. 4 035701
Sheng Y, Tang X, Peng E and Xue J 2013 Journal of Materials Chemistry B 1 512–21
Yadav M, Rhee K Y, Park S J and Hui D 2014 Composites Part B: Engineering. 66 89–96
Du Y, Pei M, He Y, Yu F, Guo W and Wang L 2014 Plos One. 9 e108647
Aslam M, Kalyar MA and Raza ZA 2016 Materials Research Express. 3 105036
Ge H, Chen H and Huang S 2012 Journal of Applied Polymer Science. 125 2716–23
Ge H and Ma Z 2015 Carbohydrate Polymers. 131 280–7
Attia A A, Khedr S A and Elkholy S A 2010 Brazilian Journal of Chemical Engineering. 27 183 - 193
Lu J, Xu K, Yang J, Hao Y and Cheng F 2017 Carbohydrate Polymers. 173 28–36
Ksakas A, Loqman A, El Bali B, Taleb M and Kherbeche A 2015 Journal of Materials and Environmental Science. 6 2003–12
Selvi K, Pattabhi S and Kadirvelu K 2001 Bioresource technology. 80 87–9
Lu J, Xu K, Yang J, Hao Y and Cheng F 2017 Carbohydrate Polymers. 173 28–36
Zhang L, Luo H, Liu P, Fang W and Geng J 2016 International Journal of Biological Macromolecules. 87 586–96
Chen D, Li W, Wu Y, Zhu Q, Lu Z and Du G 2013 Chemical Engineering Journal. 221 8–15
Bhatti I A, Ahmad N, Iqbal N, Zahid M and Iqbal M 2017 Journal of Environmental Chemical Engineering. 5 2740–51
11