Investigation into the feasibility of using SWAT at the sub basin level for simulating hydrologic conditions in jamaica
Bạn đang xem bản rút gọn của tài liệu. Xem và tải ngay bản đầy đủ của tài liệu tại đây (562.87 KB, 19 trang )
Topic: Integrated Water Resources and Coastal Areas Management
An investigation into the feasibility of using SWAT at the sub-basin level for simulating
hydrologic conditions in Jamaica
Johanna Richards1, Chandra A. Madramootoo2
1,2
Department of Bioresource Engineering, McGill University, 21,111 Lakeshore Road, St. Anne de
Bellevue, QC, H9X 3V9
ABSTRACT
The Soil and Water Assessment Tool (SWAT) was used in order to simulate the
hydrologic characteristics of the Rio-Nuevo sub-basin, located in the parish of St. Mary.
Historical climatic data (precipitation and temperature) was obtained for the watershed, while
streamflow data was obtained for the Rio Nuevo, which drains the watershed. The model was
calibrated over the period 2002-2004, and validated from the period 2005-2007. Nash-Sutcliffe
Efficiency (NSE) coefficients of performance of 0.8 and 0.5 were obtained for calibration and
validation respectively for streamflow. It has been determined that SWAT can effectively be
used to simulate surface water hydrology in this region. This paper outlines the development of
SWAT for the Rio Nuevo watershed, and describes the potential for use in agricultural water
scarcity management.
Keywords: Hydrology, Streamflow, Basin-scale Modelling, SWAT, Distributed Modelling,
Calibration, Validation, Irrigation Planning
1.0
Introduction
Jamaica‟s water resources are under increasing risk of degradation and depletion,
especially in light of increasing population growth and urbanization (Ricketts, 2005). As a result,
the use of hydrologic models in the island is an increasingly important tool for use in agricultural
water planning, as distributed parameter models such as SWAT are key to basin-level assessment
of water resources availability (Jayakrishnan et al., 2005). A pro-active approach to agricultural
water scarcity management needs to take place through planning. The understanding of which
cropping methods can be used in order to save water etc., can lead to decreased demands on
water, thus lessening the stress on water resources during water scarce conditions.
SWAT is a continuous, long-term, physically based, semi-distributed hydrologic model,
developed by the U.S. Department of Agriculture (Neitsch et al., 2005; Zhang et al., 2008). It is
an effective planning tool, in that it can be used in order to gain an improved understanding of
the water balance, while at the same time determining water savings from different management
scenarios (Immerzeel et al., 2008; Santhi et al., 2005). It was specifically with this issue in mind
that the SWAT model was built for the Rio Nuevo watershed, which is the location of the
Caribbean Water Initiative (CARIWIN) Jamaican pilot site.
SWAT is a conceptual model that works on daily time steps (Arnold and Fohrer, 2005).
SWAT can simulate surface and sub-surface flow, soil erosion, nutrient data analysis and
sediment deposition, and has been applied worldwide for hydrologic and water quality
simulation (Zhang et al., 2008). SWAT has also been applied extensively over a wide range of
spatial scales. Gollamudi (2007) applied SWAT to two fields in Southern Quebec, while Zhang
1
et al., (2007), applied SWAT to the 5239 km2 watershed in China for the simulation of daily and
monthly stream flows.
SWAT was initially developed to predict the impact of land management practices on
water, agricultural chemical yields and sediment in large, complex watersheds (Neitsch et al.,
2005). It consequently requires a large amount of specific information such as land use, weather,
soil types etc. This input data is then used to directly model physical processes such as sediment
movement and nutrient cycling (Neitsch et al., 2005). SWAT has been integrated with the
Geographical Information Systems (GIS) (ArcSWAT 2005), simplifying the process of
integrating spatial and temporal datasets into the model. In addition to this, multiple simulations
can be carried out using SWAT due to its high computational efficiency (Arnold and Fohrer,
2005). This is particularly useful in light of the fact that the Rio Nuevo basin consists of a mosaic
of agricultural plots, natural woodland, and urban settlements. For this reason, SWAT was
particularly desirable as it allows for the easy input of spatially variable landuse and soil data.
There are several hydrologic models which could also have been potentially used in this
study, such as ANSWERS-2000 (Bouraoui and Dillaha, 2000) or AGNPS (Young and Onstad,
1990). However, SWAT is a model available to the public domain, and one which has
successfully been used extensively in many countries worldwide, including developing countries
(Zhang et al., 2008). Due to limited resources, it is important that any model used in Jamaica be
as robust as possible, while at the same time cost effective. A few of the many advantages of
SWAT are that it is computationally efficient, uses readily available inputs, and enables users to
study long term impacts (Neitsch et al., 2005). In addition, SWAT can be used in the future for
modelling water quality and sediment characteristics, as well as streamflow.
SWAT is described as a semi-distributed model as Hydrologic Response Units (HRUs)
are used for the organization of simulations and outputs (Salerno and Tartari, 2009). These
HRUs represent areas of homogeneous management, land use, and soil type characteristics. Runoff is calculated for each HRU, and then combined at the sub-basin level. This run-off is then
routed in order to account for total run-off (Salerno and Tartari, 2009). Three methods of
calculating evapotranspiration have been incorporated into SWAT: (i) the Penman-Monteith
method (Allen, 1986; Allen et al., 1989; Monteith, 1965), (ii) the Preistley-Taylor method
(Preistley and Taylor, 1972) and (iii) the Hargreaves Method (Hargreaves and Samani, 1985).
The relevance of each method to the model depends not only on the types of inputs available, but
also on the climatic conditions of the geographic area in question.
The main objectives of this study were to (i) apply the SWAT model to the Rio Nuevo
sub-basin, (ii) calibrate and validate the model to streamflow, using 6 years of measured data,
and lastly (iii) assess the feasibility of the model for further use as a tool in agricultural water
scarcity planning in Jamaica, while providing recommendations as to how this planning can be
done.
2.0
Materials and methods
2.1
Site description
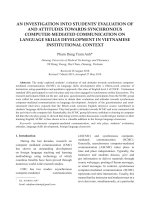
The Rio Nuevo sub-basin is a 110 km2 sub-basin, located in the Blue Mountain North
watershed, which ranges from the Blue Mountains to the northern shore of the island. Figure 1
shows the watershed location. The Rio Nuevo flows northward towards the coast, and originates
in the Blue Mountains, a mountainous ridge that runs throughout the island.
2
The Rio Nuevo watershed is located in the parish of St. Mary, which is in the northeastern section of the island. St. Mary‟s largest industry is agriculture, with crops such as
bananas, citrus, coconuts, coffee and sugar cane being produced (St. Mary Parish Library, n.d.).
St. Mary was formerly a leading contributor to the Jamaican economy through agricultural
production. However, it has suffered significant economic decline over the past two decades.
This is mainly due to the collapse of the coconut and sugar industries, which were the main
agricultural mainstays of the parish (St. Mary Partnership, 2006). Despite the decline which has
occurred in the agricultural sector in St. Mary, agriculture and agro-processing are still thought to
be the main factors in St. Mary‟s journey to economic recovery (St. Mary Partnership, 2006).
Consequently, diversity in agricultural production, both on a small and a large scale, is being
heavily encouraged by the St. Mary Parish Council.
Figure 1: Location of Rio Nuevo watershed
The watershed is rural, with agriculture and woodland occupying most of the basin.
Crops grown in this area include bananas, plantains, papayas, scotch bonnet peppers, red
peppers, cabbages, tomatoes and bok chow (Edwards, 2009), personal communication). Land
use throughout the watershed consists mostly of agricultural lands, as well as forested or
woodland areas. The land use distribution is described in Table 1. Small farmers dominate the
agrarian landscape in Jamaica, and are defined as those with farms of size 2 ha or less (FAO,
2003). There is therefore a mosaic of woodland and small farms throughout the watershed. A
description of the landuses, as how they were defined in SWAT, is shown in Table 2. These
descriptions were obtained from Evelyn (2007), and were developed by the Jamaica Department
of Forestry. Lastly, the area is dominated by soils high in clay content, the distributions of which
are shown in Table 3. The hydrologic soil groups shown in the tables represent the infiltration
capacity and drainage characteristics of the soils, with group A having the highest infiltration and
drainage capacities, and group D having the lowest.
3
Table 1: Watershed distribution of land uses in SWAT
Landuse
Disturbed Broadleaf
Fields and Disturbed Broadleaf
Fields
Disturbed Broadleaf and Fields
Bamboo and Disturbed Broadleaf
Bamboo and Fields
Plantation (Redefined as agricultural row
crops)
Built up
% Watershed Cover
39.19
33.53
17.2
6.74
1.28
1.01
0.69
0.36
4
Table 2: Reclassification of land uses in SWAT (adapted from Evelyn, 2007)
Original Landuse
Definition of land use
SWAT definition
Disturbed Broadleaf
Disturbed broadleaf forest with
broadleaf trees at least 5 m tall and
species indicators of disturbance such
as Cecropia peltata (trumpet tree)
DSBL
Built-up
Urban areas, including low to high
density
ResidentialMedium/low
density (URML)
Fields
Bamboo and broadleaf
Bamboo and fields
Disturbed Broadleaf
and fields
Herbaceous crops, fallow cultivated
grass/ legumes
> 50% bamboo, > 25% disturbed
broadleaf forest
>50% bamboo, >25% fields
> 50% disturbed broadleaf forest, >25
% fields
FIDS
BBDB
BBFD
DBFD
Plantation
Tree crops, shrub crops like sugar cane,
bananas, citrus and coconuts
Cabbages (CABG)
Tomatoes (TOMA)
Hot peppers
(HTPR) Bananas
(BANA)
Fields and disturbed
broadleaf
>50 % fields; >25% disturbed forest
FDDB
Table 3: Soil type distribution for Rio Nuevo watershed
Soil
Killancholly
Carron
Donnington
Bonnygate
Union
Waitabit
Belfield
St. Ann
Bundo
% Watershed
Area
33.89
22.67
15.67
12.48
9.73
3.59
1.18
0.5
0.28
%
Clay
60
48
29
55
53
58
22.5
45
60
% Silt
20
34
45
29
38
17
52.7
54
20
%
Sand
20
18
26
16
9
25
24.8
1
20
Hydrologic
Group
B
B
A
A
C
B
C
A
B
5
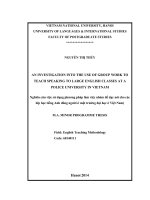
Elevation in the watershed ranges from 3 m above sea level near the coast to 591 m
above sea level in the Blue Mountain range (Figure 2). Approximately 85% of the watershed
consists of aquiclude rock material, thus resulting in low potential for interaction between
surface, or soil water and groundwater throughout the majority of the watershed. The remaining
15% is limestone (karstic) aquifer. A hydrostratigraphic map is shown in Figure 3.
Figure 2: Digital Elevation Model (DEM) of Rio Nuevo watershed
Figure 3: Hydrostratigraphic map of Rio Nuevo watershed
6
2.2
Model Inputs
SWAT requires land use data, soil type data, a digital elevation model (DEM), and
optionally, stream network data (Neitsch et al., 2005). Each of these was used as input into the
model, and Table 4 shows the source of each digital data set. All digital datasets had a Lambert
Conformal Conic Projection, and used a JAD 2001 Jamaica Grid projected coordinate system.
SWAT requires daily precipitation data, as well as daily maximum and minimum temperature
data (Neitsch et al., 2005). In addition, long term (at least 20 years) climatic data is needed in
order for SWAT to simulate rainfall events.
Table 4: Data inputs into SWAT
Data Type
Digital Elevation Model
(DEM)
2001 Land Use
Soils data
Stream network
Source
Digital contours provided by the
Jamaica Water Resources
Authority (250 ft /76.2 m
resolution)
Forestry Department, Jamaica
Rural Physical Planning UnitMinistry of Agriculture
Jamaica Water Resources
Authority
There were two rain gauges within the immediate area (but not within the bounds) of the
watershed from which historical daily rainfall data ranging from a period of 2002 – 2007 was
used. These rain gauges are operated by the Meteorological Service of Jamaica. In addition,
there was one stream gauge on the Rio Nuevo, the location of which is also shown in Figure 4.
Daily streamflow data was obtained from the Water Resources Authority for this stream for the
period 2002 to 2007. Figure 4 also shows the stream network which was used within the model.
Lastly, both minimum and maximum daily temperatures were obtained for the Norman Sangster
International Airport, as well as the Michael Manley International airport, provided courtesy of
the Meteorological Service of Jamaica.
7
Figure 4: Location of monitoring points and precipitation gauge
The landuses did not exist previously in the SWAT database, and so new landuse classes
were created into the SWAT database, using all available information for each landuse. There
were, however, several parameters which were not available by measurement for the landuses.
Hence, these parameters were obtained from other similar landuses previously defined in SWAT.
The “Fields” and “Built-up” land uses were the only ones that were re-classified using
pre-existing SWAT land uses. The Fields land use was redefined as Agricultural Row Crops
(AGRR) in SWAT. However, this landuse was split into 4 sub-landuses: hot peppers, bananas,
cabbages and tomatoes. These crops were chosen as they are grown throughout the entire region.
The SWAT design team was most kind in providing the parameters for the hot peppers and
bananas. The “Built-up” land use was reclassified as the pre-existing SWAT land use termed
Residential medium/ low density (URML). This pre-existing land use was chosen as the
watershed is rural, and any industrial area would be minimal. An HRU threshold of 20% was
chosen for land use. This was done in recognition of the spatial variability of the land use.
Despite the fact that there are 15 soils in the watershed, only 9 were represented in the
model. This is due to the fact that sufficient information was not available for all the soils. A
description of the data available for each of the soils is provided in Section C.1. This data was
provided by the Rural Physical Planning Unit of the Ministry of Agriculture. In addition, a
threshold of 15% of each hydraulic retention unit (HRU) was set for the model for soil types,
meaning that once a soil type did not represent at least 15% of the sub-basin, then it was not
represented in the model. This was done in order to capture the spatial variability of soil types
throughout the watershed.
Before the SWAT model can be run, the methods which the model would use to
determine evapotranspiration, precipitation events, run-off, and stream routing needed to be
determined and defined in SWAT. The Preistley- Taylor method was used in order to determine
evapotranspiration, while precipitation was simulated as a skewed normal distribution. The Soil
Conservation Service (SCS) Curve Number method was used in order to determine run-off,
while the Muskingum method was used for stream routing. These methods were chosen
8
iteratively through the calibration process, in other words, the best results were found when these
methods were used.
Weather generator data
In order for SWAT to simulate relative humidity and wind speed, detailed statistical
information on each of these parameters was required by the model. This information, along with
other statistical information relating to precipitation and temperature, was compiled in an input
table termed the Weather Generator Input table. However, in order for relative humidity and
wind information to be compiled, monthly average wind speeds, average daily solar radiation in
the month, and average dew point temperature in the month, were required (Neitsch et al., 2004).
Ideally this data would be available over a minimum period of 20 years. Unfortunately, this data
could not be obtained by the researchers over any significant period of time for any area of
Jamaica. Therefore, data for the Florida Keys was used instead, as this was the closest location
for which weather generator statistical data was available in the SWAT database. The climatic
data parameters will not be published in this document due to the large amount of information;
however, they are readily available in the SWAT database.
2.3
Simulation
The simulation process was divided into three main steps: setting up and running of the
model, calibration, and validation. Simulation was performed over the years of 2002 to 2007.
Calibration was performed using streamflow data from 2002 to 2004, while validation was
carried out using streamflow data from 2005 to 2007. Once all the inputs were properly defined
and integrated into GIS, the model was then run using the default SWAT parameters for the
model. In order to test the validity of the model, a water balance was performed in order to
ensure that the outputs that the model was giving were reasonable. The water balance was
performed according to the following relationship:
∆SW= PCP- ET- PERC-LATQ-SURQ
(1)
Where:
∆SW is the change in soil water (mm),
PCP is precipitation (mm)
ET is evapotranspiration (mm),
PERC is deep water percolation,
LATQ is the lateral shallow sub-surface flow to the reach
SURQ is the surface runoff
After the model was run, a sensitivity analysis was conducted. The One at a Time (OAT)
Sensitivity Analysis was conducted through a Sensitivity Analysis tool in SWAT. This analysis
was performed in order to assess the quantitative effects of SWAT input parameters on the
output. These parameters were related to different aspects of the water balance, including
movement of soil water to shallow aquifers, base flow to streams, lateral movement of soil water
to streams, evapotranspiration, and stream routing. A 0.05 parameter change for the OAT was set
9
in SWAT, with the 10 intervals within the latin hypercube. All errors which were identified in
the input data were rectified and resolved during the simulation process.
Calibration and Validation
In order to maximize the accuracy of the model, the results were then calibrated. In this
process, the most sensitive model parameters determined from the OAT sensitivity analysis were
identified. The parameters were changed with the assistance of the Manual Calibration tool in
SWAT. The model parameters were changed in pre-determined intervals, and the magnitude of
these intervals was relative to the magnitude of the parameters. Similarly to the sensitivity
analysis, each parameter was adjusted one at a time. After each parameter was adjusted, the
model was re-run, and the model performance quantitatively determined by the Nash-Sutcliffe
efficiency (NSE), the percent bias (PBIAS) and the ratio of the root mean square error to the
standard deviation of measure data (RSR), as developed by Moriasi et al., (2007). The NSE
provides a quantitative indication of how well the plot of simulated data versus observed values
fit a 1:1 line (Moriasi et al., 2007). The PBIAS is a measurement of the tendency of a simulated
value to be smaller or larger than its observed counterpart. Lastly, the RSR gives an indication
of residual variation, and incorporates the benefits of error index statistics (Moriasi et al., 2007).
Stream flow was used in order to compare the simulated to the observed results. It should
be noted that the calibration was performed on a monthly basis. Any month for which 3 or more
days of observed data was missing was not included in the model evaluation. This was done as
missing data most likely represented high stream flows due to storm conditions. The omission of
these stream flows from the determination of the monthly values would have significant effects
on the monthly values, thereby throwing off the reliability of the observed data. Calibration was
performed using stream flow data from 2002 to 2004. The months that were omitted from the
calibration process due to missing data are January and September 2002, December 2003,
January 2004, April to July and September to October 2004.
The validation process was performed using simulated and observed stream flow from
2005 to 2007. After the model was calibrated, the accuracy of the model was determined during
the validation process. For this process, the monthly simulation stream flow results for 2005 to
2007 were compared to the observed monthly stream flow results for the same period. All the
afore-mentioned model evaluation parameters were also used in the validation process.
Performance ratings (unsatisfactory, good, excellent) for each of these statistics are available in
Moriasi et al., (2007). These guidelines were used for both the calibration and validation process
in order to assess the effectiveness of both processes.
3.0
3.1
Results
Calibration
The calibrated parameters, along with their descriptions (obtained from Neitsch et al.,
(2004)) are shown in Table 5 below. The calibrated and uncalibrated values are shown in Table
6.
10
Table 5: Calibrated parameters
Parameter
Units
Threshold water depth
in shallow aquifer for
return flow (GWQMN)
mm
Soil Evaporation
Compensation Factor
(ESCO)
-
Groundwater delay
(GW_DELAY)
days
Deep aquifer percolation
fraction (RCHDP)
-
Baseflow recession
constant (ALPHA_BF)
days
Groundwater „revap‟
coefficient
(GW_REVAP)
-
Threshold water depth
in shallow aquifer for
deep percolation to
occur (REVAPMN)
mm
Description
Groundwater flow to the reach is
allowed only if the depth of water in
the aquifer is equal to or greater than
GWQMN
This coefficient defines the depth of
soil from which water can be taken
from the soil in order to meet
evaporative demand.
The time lag between when water
exits the soil profile and enters the
shallow aquifer
The fraction of percolation from the
root zone which recharges the deep
aquifer
An index that represents the response
of groundwater to changes in recharge
This coefficient defines the
restrictions relating to the movement
of water from the shallow aquifer to
the root zone
A threshold depth, under which
movement of water from the shallow
aquifer to the unsaturated zone is not
allowed
11
Table 6 shows the calibrated parameters, including the original (uncalibrated) parameter
values, as well as the calibrated parameter values.
Table 6: Calibrated and uncalibrated values for calibration parameters
Parameter
GWQMN
ESCO
GW_DELAY
RCHDP
ALPHA_BF
GW_REVAP
REVAPMN
Range
0-5000
0-1
0-500
0-1
0-1
0.02-0.2
0-500
Unit
mm
days
days
mm
Un-calibrated
0
0.95
31
0.05
0.048
0.02
1
Calibrated
1
0.99
35
0.15
0.9
0.12
2
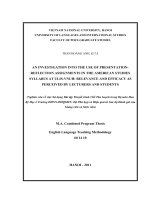
5.3.2 Surface flows
The model output was obtained for the same location along the stream reach as the actual
stream gauge. The observed and simulated stream flows were then compared on a monthly basis
for both the calibration and validation time periods. During the calibration period, SWAT underestimated the two large events that occurred in October 2003 and March 2004. During the
validation period, SWAT over-estimated some of the run-off events that occurred in January and
July 2005, as well as November 2007. Figures 5 and 6 show the calibrated and validated
streamflow hydrographs, showing observed and simulated flows.
12
6
4
2
0
Apr.04
Dec.04
8
Nov.07
10
Oct.04
Observed
Sep.07
12
Aug.04
Validated Hydrograph (2005-2007)
Jul.07
Figure 5: Calibrated hydrograph for Rio Nuevo
Jun.04
Month
May.07
Mar.07
Simulated
Feb.04
Dec.03
Oct.03
Aug.03
Jun.03
Apr.03
Feb.03
Dec.02
Oct.02
Aug.02
Jun.02
Apr.02
Feb.02
Streamflow (cms)
Simulated
Jan.07
Nov.06
Sep.06
Jul.06
May.06
Mar.06
Jan.06
Nov.05
Sep.05
Jul.05
May.05
Mar.05
Jan.05
Streamflow (cms)
Calibrated Hydrograph (2002-2004)
Observed
8
7
6
5
4
3
2
1
0
Month
Figure 6: Validated hydrograph for Rio Nuevo
13
5.3.4 Model Evaluation
The calibration and validation performance ratings are shown in Table 7 below. The NSE
value is right on the verge of being satisfactory, while the RSR is slightly in the unsatisfactory
range. However, the validation performance is generally expected to be less than the calibration
performance (Moriasi et al., 2007). The validated parameters will therefore be treated as
satisfactory for the purposes of this research. The range and ideal values of each of the
performance indicators were obtained from Moriasi et al., (2007).
Table 7: Calibration and validation model performance ratings
Performance
Performance
Performance
Calibrated
Validated
Indicator
Rating
Rating
Range
Ideal
NSE
0.758
Very Good
0.504
Satisfactory
1
PBIAS
9.496
Very Good
12.767
Good
0
RSR
0.492
Very Good
0.704
Satisfactory
0 to a
large
positive
number
0
5.4
Discussion
Overall, the model performed satisfactorily, achieving an NSE of 0.76 for calibration, and
0.50 for validation. This is in keeping with results from other studies, which have reported
successful applications of SWAT in other developing countries. It was applied in Ethiopia by
Mekonnen et al. (2009), resulting in R2 coefficients of 0.88 and 0.83 for calibration and
validation respectively for streamflow. SWAT was also successfully applied in Tunisia, with
NSE coefficients of 0.73 and 0.43 for calibration and validation respectively for streamflow
(Ouessar et al., 2009).
The fact that the rain gauges used in the model were not actually in the watershed would
have negatively impacted the results. In addition, land uses would have changed over time, and
- ∞ to was
1 from 2001.
unfortunately, the most recent landuse data which was available for this research
In addition, weather data from Florida was used in order for SWAT to simulate relative humidity
∞ to ∞ humidity and
and wind conditions. There are orographic effects which would affect the -relative
wind conditions within the Rio Nuevo watershed. However, the Florida Keys are relatively flat,
resulting in different characteristics for these climatic conditions. Overall, the inherent error that
exists in the input data would have resulted in a compounded error throughout the modelling
process.
An attempt was of course made to improve these results through the calibration process.
There are no actual measurements relating to groundwater flow within the watershed, and so all
the calibration results are based simply on which values provide the optimal model response. The
question therefore arises as to whether or not these calibrated values are representative of what
actually happens within the watershed. Unfortunately, due to a lack of published data on
14
groundwater flow, not only within the larger Blue Mountain North watershed, but within the
island, the assumption must be made that the calibrated values are indeed within reasonable
ranges for Jamaican sub-surface systems.
Through calibration, the value for the baseflow recession constant (ALPHA_BF) was
increased. This increase in ALPHA_BF signified an increased sensitivity of groundwater flow to
changes in groundwater recharge. There was a significant increase in this parameter from 0.048
to 0.9. This is especially significant as the range of ALPHA_BF is from 0 to 1, with 1
expressing the highest groundwater flow response. Likewise, the Soil Evaporation Compensation
Factor (ESCO) was increased, resulting in an increased depth from which water could be taken
in order to meet evapotranspiration demand. The groundwater “revap” coefficient
(GW_REVAP) was also significantly increased from 0.02 to 0.12, which allows for easier
movement of water from the shallow aquifer to the root zone. The increases in ALPHA_BF,
ESCO and GW_REVAP all imply that throughout the watershed, surface and groundwater
interactions are actually quite important. This is despite the limited surface and groundwater
interactions that can take place throughout the watershed due to the aquicludal hydrostratigraphy.
GW_DELAY (the time lag between when water exits the soil profile and enters the
shallow aquifer) was also increased from 31 days to 35 days. Any attempts to lower this value
during the calibration process resulted in worse model performance. Considering the fact that the
majority of the watershed is indeed aquiclude, the increase in delay time is indeed justified.
There was a minimal increase (from 0 to 1 mm) in the GWQMN, which is the threshold depth in
the shallow aquifer required for groundwater flow to the reach. Likewise, there was minimal
change (1 to 2 mm) in REVAPMN, which is the threshold depth in the shallow aquifer for deep
percolation to occur. Both of these values imply that flow occurs very easily between the
groundwater systems and surface water systems.
It is important to note that neither the curve numbers, nor the available water capacities of
the soils were calibrated. These parameters tend to be very important calibration parameters, and
many studies involving SWAT have shown that the calibration of these parameters result in
improved model performance (Govender and Everson, 2005; Zhang et al., 2008). However, even
though the sensitivity analysis showed these parameters as highly sensitive, changes that were
made to these parameters showed no improvement in model response. A similar result was seen
in the study performed by Mulungu and Munishi (2007). This result is one more indicator
pointing to the importance of sub-surface interactions within this watershed.
The results of the calibration process might seem counter-intuitive, considering the fact
that the vast majority of the watershed is underlain by either basal, coastal or limestone
aquiclude. However, 15 % of the watershed is karstic, and this karsticity adds a level of
complexity that is difficult to simulate. The possible effects of karsticity on the entire watershed
dynamics are discussed in the following section.
4.1
Model performance and karsticity effects
As mentioned in the results, SWAT underestimated some of the peak flow events with the
largest under-estimation resulting in a standard error of 35.7 % during the calibration period
(2002-2004). During the validation period, SWAT over-estimated some of the peak flow events
(2005-2007), with standard errors as high as 62.8 % during these events. In speaking with the
Meteorological Service of Jamaica, these storm events were caused by tropical storms, resulting
in conditions which would have been difficult for the model to simulate.
15
However, this model is meant to be used in the context of irrigation management during
water scarce conditions. As such, the ability of SWAT to simulate low flows is more relevant to
this context than the ability of SWAT to simulate storm flows. During storm conditions,
evapotranspiration losses will be replaced by rainfall, and irrigation demand is no longer an
issue. However, periods of low flow are a result of low rainfall, and it is during these times that
irrigation demand becomes an issue. Unfortunately, SWAT at times had difficulty simulating
some low flow conditions, with an over-estimation of a period of low flow occurring in March
2003 during calibration, and an over-estimation of 320% occurring during a very dry period in
September 2006. Overall though, the simulation of low flow events was satisfactory (Figure 5
and 6).
It is likely that the geomorphology of the watershed plays a significant role in the inability of
the SWAT to capture all of the low-flow events. The karstic portion of the watershed leads to
complex interactions between surface and groundwater. The fact that the vast majority of the
parameters which were calibrated were in relation to groundwater (baseflow release factors and
groundwater delay factors), signifies that the karstic aquifer affects the entire dynamic of the
watershed. This highlights the fact that the interaction between surface and groundwater plays an
important role in the over-all dynamics of the watershed.
Salerno and Tartari (2009) did some work investigating the use of wavelet analysis
(WA) along with SWAT, in simulating streamflow in a karstic watershed. They highlighted the
disadvantage that deterministic models such as SWAT face when modelling karstic
environments. The use of these kinds of models lead to over or under-estimation of streamflow,
due to their inability to accurately compute contributions to streamflow from sub-surface
circulation. It is especially difficult to simulate riverflows in karst environments, as the
component of flow coming from the karst conduits cannot be directly measured (Salerno and
Tartari, 2009). The authors found that the use of wavelet analysis was able to circumscribe the
problem. Therefore, the coupling of SWAT with a groundwater assessment tool or model can
result in significant reduction of the karstic effects. Therefore, due to the role which this aquifer
is likely to have played in these interactions, it is recommended that future studies in Jamaica
using SWAT in karstic watersheds use tools such as wavelet analysis to improve results, and
circumscribe the karstic effect.
4.2
Use of SWAT in agricultural water scarcity management
The use of a modelling tool such as SWAT can be pivotal in irrigation planning,
especially in light of water scarce conditions. SWAT can be used in order to determine water
savings from different water management scenarios (Santhi et al., 2005). This is especially
important in light of the competing uses for water among different watershed stakeholders. The
irrigation planning process requires a basin wide perspective, as water supplies cross both local
and parish boundaries. What this research sought to do therefore is to introduce SWAT as a tool
for carrying out this type of quantitative analysis on a watershed level in Jamaica.
The aim of this research was not to carry out the actual management scenarios, but to
determine if the potential existed for this tool to be used for that purpose. In light of this, no
management scenarios were carried out with this model, however, in future research, this model
can be used in order to gain an improved understanding of the water balance, as the
determination of irrigation amounts for normal precipitation conditions is just one step in the
process of managing water resources. The model can be used in order to assess water
productivity and crop water use. In addition, it can be used in order to determine which cropping
16
system would result in the most efficient water use, by assessing which cropping system would
minimize evapotranspiration losses. This calibrated model can be used for analyzing different
management scenarios for better crop management practices and irrigation planning.
A significant problem with the use of hydrological models in Jamaica lies not only in a
severe shortage of data (hydrologic, climatic, and agricultural), but also a shortage of human and
financial resources. However, models such as SWAT provide such powerful tools, that further
investment into the future collection of data, and the future development of human resources,
would go a long way in ensuring that Jamaica can adequately plan for the ever-changing climatic
conditions.
5.0
Conclusions
A hydrological model was developed for the Rio Nuevo watershed in St. Mary using
SWAT. This model was examined for its applicability for use in Jamaican agricultural
watersheds. Streamflow was simulated, and the model was calibrated using observed streamflow
from 2002 to 2004, and validated using observed streamflow from 2005 to 2007. An NSE
correlation coefficient of 0.76 was obtained for calibration, while a coefficient of 0.50 was
obtained for validation. Groundwater interactions played a really important part in the hydrologic
dynamics of this watershed, despite the fact that the majority of this watershed is underlain by
basal aquiclude. As a result, the most critical calibration parameters included GWQMN,
RCHDP, ESCO and ALPHA_BF.
SWAT had some difficulties in simulating high-runoff events. Despite this, it has been
determined that SWAT is a suitable model for use in simulating streamflow in this watershed,
and holds much potential for future agricultural water resources planning, not only in this subbasin, but also in other watersheds in Jamaica. It is important that pre-emptive action be taken
towards water scarcity planning, and SWAT provides a very important tool for achieving this, as
it can be used to determine strategies which could be put into place in order to maximize
agricultural water savings. The land use and soil parameters that were used for this model are
published with this paper, with the intention that they be used as a reference in the development
of future hydrologic simulations within the island.
References
Allen, R.G. 1986. A Penman for all seasons. Journal of Irrigation and Drainage Engineering., ASCE
112:348-368.
Allen, R.G., M.E. Jensen, J.L. Wright, and R.D. Burnamn. 1989. Operational estimates of
evapotranspiration. Journal of Agronomy 81:650-662.
Arnold, J.G., and N. Fohrer. 2005. SWAT2000: current capabilities and research opportunities in applied
watershed modelling. Hydrological Processes 19:563-572.
Bouraoui, F., and T.A. Dillaha. 2000. ANSWERS-2000: Non point-source nutrient planning model
Journal of Environmental Engineering 126:1045.
Edwards, V. 2009. Parish Agricultural Manager- Rural Agriculture Development Agency for St. Mary.
FAO. 2003. WTO Agreement on Agriculture- The implementation Experience: Jamaica. Food and
Agriculture Organization of the United Nations, Rome.
Gollamudi, A., C.A. Madramootoo, and P. Enright. 2007. Water quality modeling of two agricultural
fields in southern Quebec using SWAT. Transactions of the Asabe 50:1973-1980.
Govender, M., and C.S. Everson. 2005. Modelling streamflow from two small South African
experimental catchments using the SWAT model. Hydrological Processes 19:683-692.
17
Hargreaves, A.D., and Z.A. Samani. 1985. Reference crop evapotranspiration from temperature. Applied
Engineering in Agriculture 1:96-99.
Immerzeel, W.W., A. Gaur, and S.J. Zwart. 2008. Integrating remote sensing and a process-based
hydrological model to evaluate water use and productivity in a south Indian catchment.
Agricultural Water Management 95:11-24.
Jayakrishnan, R., R. Srinivasan, C. Santhi, and J.G. Arnold. 2005. Advances in the application of the
SWAT model for water resources management. Hydrological Processes 19:749-762.
Mekonnen, M.A., A. Wörman, B. Dargahi, and A. Gebeyehu. 2009. Hydrological modelling of Ethiopian
catchments using limited data. Hydrological Processes 23:3401-3408.
Monteith, J.L. 1965. Evaporation and the Environment. The state and movement of water in living
organisms, XIXth Symposium. Society for Experimental Biology, Swansea, Cambirdge
University Press.
Moriasi, D.N., J.G. Arnold, M.W. Van Liew, R.L. Bingner, R.D. Harmel, and T.L. Veith. 2007. Model
evaluation guidelines for systematic quantification of accuracy in watershed simulations.
Transactions of the Asabe 50:885-900.
Mulungu, D.M.M., and S.E. Munishi. 2007. Simiyu River catchment parameterization using SWAT
model. Physics and Chemistry of the Earth, Parts A/B/C 32:1032-1039.
Neitsch, S.L., J.G. Arnold, J.R. Kiniry, and J.R. Williams. 2005. Soil and Water Assesment Tool:
Theoretical Documentation (Version 2005). Grassland, Soil and Water Research Labarotory of
the U.S. Agricultural Research Service and the Blackland Research Centre, Texas Agricultural
Station.
Neitsch, S.L., J.G. Arnold, J.R. Kiniry, R. Srinivasan, and J.R. Williams. 2004. Soil and Water
Assessment Tool Input/Output File Documemtation : Version 2005. Grassland, Soil and Water
Research Labarotory of the U.S. Agricultural Research Service and the Blackland Research
Centre, Texas Agricultural Station.
Ouessar, M., A. Bruggeman, F. Abdelli, R.H. Mohtar, D. Gabriels, and W.M. Cornelis. 2009. Modelling
water-harvesting systems in the arid south of Tunisia using SWAT. Hydrology and Earth System
Sciences 13:2003-2021.
Preistley, C.H.B., and R.J. Taylor. 1972. On the assessment of surface heat flux and evaporation using
large-scale parameters. Mon. Weather. Rev. 100:81-92.
Ricketts, D.D. 2005. Critical Review of Beacon Irrigation System in Jamaica, University of Guelph,
Guelph.
Salerno, F., and G. Tartari. 2009. A coupled approach of surface hydrological modelling and Wavelet
Analysis for understanding the baseflow components of river discharge in karst environments.
Journal of Hydrology 376:295-306.
Santhi, C., R.S. Muttiah, J.G. Arnold, and R. Srinivasan. 2005. A GIS-based regional planning tool for
irrigation demand assessment and savings using SWAT. Transactions of the Asae 48:137-147.
St. Mary Parish Library. n.d. Parish Information [Online] www.jamlib.org.jm/stmary_history.htm
(verified October 2008).
St. Mary Partnership. 2006. St. Mary Strategic Development Plan: Towards a Vision for the Parish of St.
Mary for 2025. [Online]. Available by St. Mary Parish Council <
(verified October 2008).
Young, R.A., and C.A. Onstad. 1990. AGNPS - a Tool for Watershed Planning. Watershed Planning and
Analysis in Action: 453-462
Zhang, X., R. Srinivasan, and F. Hao. 2007. Predicting hydrologic response to climate change in the
Luohe River basin using the SWAT model. Transactions of the ASAE 50:901-910.
Zhang, X., R. Srinivisan, and M. Van Liew. 2008. Multi-Site Calibration of the SWAT Model for
Hydrologic Modeling. Transactions of the ASAE 51:2039-2049.
18
19