IT training always bee tracing slides khotailieu
Bạn đang xem bản rút gọn của tài liệu. Xem và tải ngay bản đầy đủ của tài liệu tại đây (4.37 MB, 45 trang )
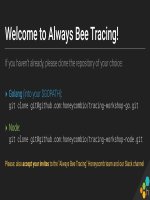
Welcome to Always Bee Tracing!
If you haven’t already, please clone the repository of your choice:
▸ Golang (into your $GOPATH):
git clone :honeycombio/tracing-workshop-go.git
▸ Node:
git clone :honeycombio/tracing-workshop-node.git
Please: also accept your invites to the "Always Bee Tracing" Honeycomb team and our Slack channel
Always Bee Tracing
A Honeycomb Tracing workshop
A bit of history
▸ We used to have "one thing" (monolithic application)
▸ Then we started to have "more things" (splitting monoliths into services)
▸ Now we have "yet more things", or even "Death Star" architectures
(microservices, containers, serverless)
A bit of history
2
Now
we
have
N
problems (one slow service bogs down everything, etc.)
▸
▸ 2010 - Google releases the Dapper paper describing how they improve on
existing tracing systems
▸ Key innovations: use of sampling, common client libraries decoupling app
code from tracing logic
Why should GOOG have all the fun?
▸ 2012 - Zipkin was developed at Twitter for use with Thrift RPC
▸ 2015 - Uber releases Jaeger (also OpenTracing)
▸ Better sampling story, better client libraries, no Scribe/Kafka
▸ Various proprietary systems abound
▸ 2019 - Honeycomb is the best available due to best-in-class queries ;)
A word on standards
▸ Standards for tracing exist: OpenTracing, OpenCensus, etc.
▸ Pros: Collaboration, preventing vendor lock-in
▸ Cons: Slower innovation, political battles/drama
▸ Honeycomb has integrations to bridge standard formats with the
Honeycomb event model
How Honeycomb fits in
Understand how your production systems
are behaving, right now
QUERY
BUILDER
INTERACTIVE
VISUALS
RAW DATA
TRACES
DATA STORE
High Cardinality Data | High Dimensionality Data | Efficient storage
BEELINES (AUTOMATIC INSTRUMENTATION + TRACING APIS)
BUBBLEUP +
OUTLIERS
Tracing is…
▸ For software engineers who need to understand their code
▸ Better when visualized (preferably first in aggregate)
▸ Best when layered on top of existing data streams (rather than adding
another data silo to your toolkit)
Instrumentation (and tracing)
should evolve alongside your code
Our path today
▸ Establish a baseline: send simple events
▸ Customize: enrich with custom fields and extend into traces
▸ Explore: learn to query a collection of traces, to find the most interesting
one
ANALYSIS
USER
WALL
our
(second)
service
TWITTER.COM
a third-party
dependency
(LAMBDA FN:
PERSIST)
a black-box
service
EXERCISE: Run the wall service
Go: go run ./wall.go
Node: node ./wall.js
‣ Open up http://localhost:8080 in your browser and post some messages
to your wall.
‣ Try writing messages like these:
‣ "hello #test #hashtag"
‣ "seems @twitteradmin isn’t a valid username but @honeycombio is"
→ let’s see what we’ve got
Go
Node
→ let’s see what we’ve got
Custom Instrumentation
▸ Identify metadata that will help you isolate unexpected behavior in
custom logic:
▸ Bits about your infrastructure (e.g. which host)
▸ Bits about your deploy (e.g. which version/build, which feature flags)
▸ Bits about your business (e.g. which customer, which shopping cart)
▸ Bits about your execution (e.g. payload characteristics, sub-timers)
EXERCISE: Find Checkpoint 1
Go
Node
→ let’s see what we’ve got
trace.trace_id
The ID of the trace this span belongs to
TRACE 1
trace.span_id
A unique ID for each span
EVENT ID: A
EVENT ID: B, PARENTID: A
EVENT ID: C, PARENTID: B
trace.parent_id
The ID of this span’s parent span, the call location
the current span was called from
service_name
The name of the service that generated this span
name
The specific call location (like a function or method
name)
duration_ms
How much time the span took, in milliseconds
TRACE 1
EVENT ID: A
EVENT ID: B, PARENTID: A
EVENT ID: C, PARENTID: B
EXERCISE: Find Checkpoint 2
‣ Try writing messages like these:
‣ "seems @twitteradmin isn’t a valid username but @honeycombio is"
‣ "have you tried @honeycombio for @mysql #observability?"
→ let’s see what we’ve got
Our first, simple trace
→ let’s see what we’ve got