Nghiên cứu xử lý nước rỉ rác bằng phương pháp keo tụ điện hóa kết hợp lọc sinh học tt tiếng anh
Bạn đang xem bản rút gọn của tài liệu. Xem và tải ngay bản đầy đủ của tài liệu tại đây (5.73 MB, 27 trang )
MINISTRY
OF EDUCATION AND TRAINING
VIETNAM ACADEMY OF SCIENCE AND
TECHNOLOGY
GRADUATE UNIVERSITY OF SCIENCE AND TECHNOLOGY
-----------------------------
Le Cao Khai
RESEARCH ON THE LEACHATE TREATMENT BY
ELECTROCOAGULATION METHOD COMBINED WITH
BIOLOGICAL FILTRATION
Major: Environmental Engineering
Code: 9.52.03.20
SUMMARY OF ENVIRONMENTAL ENGINEERING
DOCTORAL THESIS
Hanoi - 2019
This thesis was done at:
-
Institute of Environmental Technology, Vietnam Academy of Science and Technology
Graduate University of Science and Technology - Vietnam Academy of Science and
Technology.
Supervisor 1: Assoc.Prof., Dr. Trinh Van Tuyen
Supervisor 2:
Dr. Le Thanh Sơn
The dissertation will be defended at Graduate University of Science and Technology
- Vietnam Academy of Science and Technology, 18 Hoang Quoc Viet street, Hanoi.
Time: .............,.............., 2019
This thesis could be found at:
-
National Library of Vietnam
Library of Graduate University of Science and Technology.
1
INTTRODUCTION
Rationale of the study:
Currently, along with the development of society, people lives are
gradually improved and consume demand is increasing, leading to an increasing
amount of waste, especially domestic waste (DW). The average annual increase
is approximately 12%. The regular increase in domestic waste causes an
increasing amount of leachate. Leachate is generated from both landfills and
transfer stations containing high polluted levels with Chemical Oxygen
Demand (COD) up to 70000 mg/l, Dissolved Solids (DS) up to 50000 mg/l,
Total Suspended Solids (TSS) to 2000 mg/l and nitrogen content up to 3000
mg/l,… Leachate with badly stink affects to surrounding areas and contaminate
the groundwater as well as pollute surface water sources. Therefore,
environmental pollution by leachate has always been a serious problem which
get special attention in environmental protection.
Although, according to regulations, each landfill must have a leachate
treatment system, most of the current leachate treatment techniques in our
country still reveals many weaknesses neither the quality of treated water often
does not meet the effluent standards, especially the COD and nitrogen
parameters (VN standards 25: 2009/MONRE column B), nor difficult operation
and expensive cost. The reason comes from the leachate characteristics with the
complex composition and the continuous change by the landfill operating time.
The selection of inappropriate treatment technologies has resulted in nonresponding to discharge standards, while the leachate in landfills increases
continuously. Hence, it is necessary to find some appropriate technologies
which are able to handle all the daily leachate, improve current leachate
treatment systems and equip for the new landfills.
The option of combining electro-coagulation (EC) with biological filtration
(BF) is one of the promising solutions to increase the effectiveness of leachate
treatment. Unlike chemical coagulation, a large amount of coagulants must be
used, thus consuming a lot of chemicals as well as creating a great amount of
generated sludge, the EC process has the ability to remove effectively heavy
metals, phosphorus compounds, phenol compounds, hydrocarbons and several
pathogenic microorganisms, which are difficult to decompose by biological
methods. In addition, this process is also easy to automate and minimize the use
of chemicals thus reducing the amount of generated sludge. Meanwhile, the BF
process has the high treatment performance of suspended compounds (TSS),
total nitrogen (TN) and BOD5. In particular, the BF process on inexpensive
organic substrates such as peat, wood bark, and plastic have a higher treatment
efficiency than conventional BF processes. The reason is that the porous
organic substrates have a large specific surface area which is possible to absorb
a large amount of microorganisms, together with other physicochemical
processes, leading to very strong nitrate reduction. Combining two above
1.
2
technologies allows optimization of leachate treatment process and posttreatment water can reach VN standards 25: 2009/MONRE column B2.
Facing this situation, successful research and application of EC technology
combined with bio-filter is essential for leachate treatment. Because of this
reason, the topic “Research on the leachate treatment by electrocoagulation
method combined with biological filtration” is chosen.
2.
Study object:
This thesis aims to investigate advance techniques for leachate treatment,
especially electrocoagulation, biological filtration, and their combination.
Through research, the thesis wishes to achieve the following objectives:
1/ Determine suitable conditions for COD, ammonium, TSS and color
treatment in leachate by EC.
2/ Determine suitable conditions for COD, ammonium, TSS and color
treatment in leachate after EC treatment by BF.
The task of the thesis is to study the EC process in combination with BF
process to increase the effectiveness of leachate treatment, ensuring
environmental standards VN standards 25: 2009/MONRE column B2.
3.
Study content:
Leachate treatment by EC
1/ Experiments to study the effect of several parameters namely current
density, electrolysis time, pH, electrode distance on COD, ammonium, TSS and
color treatment in leachate by iron and aluminum electrodes.
Leachate treatment by BF after EC process
2/ Experiments to study the effect of aeration modes and input loads on
COD, ammonium, TSS and color treatment in leachate after EC treatment by BF.
CHAPTER 1. OVERVIEW
1.1 Leachate
1.1.1. Leachate characteristics and composition
Leachate is defined as any type of polluted liquid in the rubbish that
permeates through the garbage layers in landfills and entitles suspended solids,
dissolved colloids from solid wastes discharged into or outside the landfills.
The composition of the leachate varies widely depending on the composition
of the landfill waste and the landfill time. The pollutant content in leachate of the
new solid waste landfill is much higher than the old solid waste landfill. Because
in the old landfills, the content of easily biodegradable organic matter has been
mostly decomposed. Meanwhile, the leachate in the new landfills usually has a
low pH but very high content of COD, BOD5, nutrients, TDS and heavy metals. In
contrast to the new landfills, leachate in long-term landfills often has high pH (due
to increased methaneization) and the content of COD, BOD5, nutrients, TDS and
heavy metals decreases because most of the metals transfer to precipitate state as
pH increases. In particular, leachate in long-term landfills contains many high-
3
molecular compounds with many toxic chemicals that both cause dark color and
unpleasant odor, which are difficult to decompose by biological methods.
1.1.2. Impact of leachate on the environment and people
Leachate has high concentrations of pollutants such as: COD = 2000 70000 mg/l, BOD = 1200 - 27000 mg/l and many other toxics which can
permeate through the soil and contaminate the underground water sources as
well as surface water system. Bad odor in leachate can pollute the air
environment. Therefore, when leachate is discharged into the environment, it
will cause severe environmental pollution and affect public health.
1.2. Electrocoagulation overview
Mechanism of electrocoagulation process
“Electrocoagulation is an electrolysis method to treat contaminated water,
using direct current (DC) to corrode anode (usually aluminum or iron) and then
release coagulants (usually aluminum or iron ions) into the solution”.
When metal electrolysis occurs, the following processes occur:
M → Mn+ + neThese metal cations combine with the OH- ions (present in the water) to
form metal hydroxides according to the following reaction equations:
Mn+ + nOH- → M(OH)n
1.3. Bio-filter overview
1.3.1. Mechanism of bio-filter process
BF is a technique that uses biofilms formed on a solid carrier. The carrier
may have a fixed position in a reaction device and the fluid flow forms a thin
film that flows over the surface of the microbiological membrane in trickling
filtration technology; microbiological membranes alternately intermittently
contact with the gas and liquid phases through a rotating shaft such as in a
biological rotating disc. The carrier has a fixed position in a submerged layer and
water containing impurities flows through the material layer in the BF column.
1.3.2. Theoretical basis of nitrogen treatment in wastewater by biological processes
Nitrogen treatment in wastewater is usually carried out in two stages. Stage
1 is the process of converting ammonium to nitrate (nitrification). The second
stage is the process of nitrate denitrifying to evaporate (de-nitrification).
1.3.3. Combining methods in leachate treatment
Wiszniowski et al. (2006) have shown that in order to treat the leachate to
meet the effluent standards, several methods are needed to combine to treat
effectively the leachate. The primary is a combination of 3 methods: physics,
chemistry and biology. There have been many studies showing the effectiveness
of a combination of methods in leachate treatment. The following is just a
combination of EC and BF in leachate treatment.
Currently, there are only 2 studies combining EC with BF in leachate treatment.
One is to combine BF first, then magnesium - electrode EC. Other is the combination
of aluminum electrodes EC before BF process. Both of these results show the
4
effectiveness of EC and BF combination in leachate treatment. However, further
studies with other electrodes are needed to find the optimum conditions for leachate
treatment with high efficiency and low operating costs. Therefore, the new direction
that the thesis focuses on is study on leachate treatment by the combination of iron
electrode EC and BF. The dissertation also compares the effectiveness of leachate
treatment by iron electrode EC process with aluminum electrode EC process.
Therefore, the study of leachate treatment by EC with BF is the direction
chosen in this thesis.
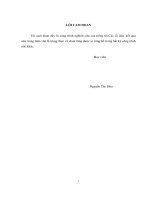
CHAPTER 2. STUDY OBJECT, SCOPE AND METHODS
Figure 2.1. Diagram of leachate treatment by EC combined with BF
2.1. Study object and scope
2.1.1. Study object
The pollutants in leachate (evaluated thoroughly several parameters
namely COD, ammonium, TSS, color).
Leachate used in the study was taken at the biological lake of the Nam
Son solid waste treatment complex - Soc Son - Hanoi and stored at 4oC.
2.1.2. Study scope
Study on contaminants treatment in leachate by EC method combined
with BF at laboratory scale.
The block diagram of the research system for leachate treatment in the
laboratory is shown in Figure 2.1.
2.2. Study Methods
5
2.2.2. Experimental method of electrocoagulation.
Experiments were conducted to find suitable conditions of current
density, electrolysis time, pH, electrode distance for leachate treatment.
2.2.3. Experimental methods of bio-filter
The experiments were conducted to find suitable conditions for aeration
mode, input load for leachate treatment after EC treatment (assessed through
COD, ammonium, nitrate, TSS, color).
CHAPTER 3. RESULTS AND DISCUSSIONS
3.1. Study on leachate treatment by electrocoagulation
Currently, EC is used to treat wastewater. With leachate having high
concentration of COD, BOD, ammonium, TSS and color, EC is a new and
effective method.
- For COD, TSS and pigments are basically treated according to the
electrocoagulation mechanism that flocculants are generated from electrolysis.
- For ammonium treated basically by the mechanism of electrochemical,
adsorption...
In order to increase the of EC treatment efficiency, such as current
density, electrolysis time, electrode distance, electrode material and pH of
leachate need to be investigated and found the optimal condition.
3.1.1. Effect of current density and electrolysis time to COD, ammonium, TSS
and color treatment efficiency with iron electrodes.
Figure 3.1. Effect of current density and
electrolysis time on COD treatment
efficiency
Figure 3.2. Effect of current
density and electrolysis time on
ammonium treatment efficiency
6
Figure 3.3. Effect of current density and
Figure 3.4. Effect of current
electrolysis time on TSS treatment
density and electrolysis time on
efficiency
color treatment efficiency
The variation of pH during EC process is shown in Figure 3.5:
Thoi
Figure 3.5. The variation of pH in leachate during EC process by electrolysis time
Table 3.1. Impact of electrolysis time on COD, ammonium, TSS and color
treatment efficiency. (J= 3,896 mA/cm2)
Reaction
Treatment efficiency (%)
time (mins)
COD
Ammonium
TSS
Color
10
42,86
8,75
9,83
27,90
20
58,93
12,29
15,95
46,75
30
69,64
17,50
23,98
54,56
40
73,21
19,36
30,46
59,10
60
76,79
23,64
38,61
71,67
80
79,29
24,38
38,97
79,39
Impact of electrolysis time from 10 - 80 míns to pollutants treatment
efficiency with J= 3,896 mA/cm2 was shown in Table 3.1.
When J = 3,896 mA/cm2, according to Table 3.1 we can choose 60 minutes of
electrolysis time for the next studies although the efficiency is not the highest at
his time, treatment efficiency does not change much after 60 minutes.
7
From Table 3.2 shows, as the current density increases, the power
consumption increases. At current density J = 1,298 mA/cm 2 (I = 1A), the
electrical energy consumption is 1.05 KWh/m 3 leachate. As increasing to J =
5,194 mA/cm2 (I = 4A), the power consumption increases to 24,67 KWh/m 3
leachate. At current density J = 3,896 mA/cm2 (I = 3A), power consumption is
12,83 KWh/m3 leachate, when increasing current density to 4,545 and 5,194
mA/cm2, power consumption increases considerably, respectively to 18.08 and
24.67 KWh/m3 leachate. The results from Table 3.2 also show that COD,
ammonium, TSS and color performance at current density of J = 3,896 mA/cm 2
does not change significantly compared to J = 4,545 and 5,194 mA/cm 2. The
energy consumed to treat 1 m3 of leachate at J = 5,194 mA/cm 2 is almost double
that of J = 3,896 mA/cm2. Therefore, selecting the current density of J = 3,896
mA/cm2 is energy-efficient while the COD, ammonium, TSS and color
performance are not much lower than J = 4,545 and 5,194 mA/cm 2. Table 3.2
show that if the current density is smaller than 3,896 mA/cm 2, neither the power
consumption is low nor COD, ammonium, TSS and color treatment efficiencies
are small. Therefore, current density of J = 3,896 mA/cm2 is applied to the next
studies.
Table 3.2. Power consumption and COD, ammonium, TSS and color
Current
intensity
(A)
1,0
2,0
2,5
3,0
3,5
4,0
Current
density
(mA/cm2)
Potential
(V)
treatment efficiencies.
COD
Ammonium
Power
treatment
treatment
consumption
efficiency
efficiency
3
(KWh/m )
(%)
(%)
TSS
treatment
efficiency
(%)
Color
treatment
efficiency
(%)
1,298
1,9
1,05
53,33
14,03
6,85
42,2
2,597
4,4
4,89
62,50
15,03
20,79
56,5
3,246
5,5
7,64
69,64
18,32
26,57
59,6
3,896
7,7
12,83
76,79
23,64
38,61
71,67
4,545
9,3
18,08
78,71
24,32
39,04
74,27
5,194
11,1
24,67
80,36
24,99
40,16
74,91
Combining the treatment efficiencies in Table 3.1 and the power
consumption in Table 3.2, it is convincing to choose electrolysis time of 60
minutes for further studies.
3.1.2. Effects of initial pH in leachate on COD, ammonium, TSS and color
treatment efficiencies with iron electrodes.
The pH value is one of the main factors affecting the treatment efficiency
of the EC process.
The results also show that, in neutral environment (pH = 7-8), COD,
ammonium, TSS and color removal efficiency are highest (specifically in Table 3.3).
8
Figure 3.6. Effect of initial pH on
COD treatment efficiency
Figure 3.7. Effect of initial pH on
ammonium treatment efficiency
Figure 3.8. Effect of initial pH on
Figure 3.9. Effect of initial pH on
TSS treatment efficiency
color treatment efficiency
Table 3.3. The COD, ammonium, TSS and color
treatment efficiencies at different pH
(J = 3,896 mA/cm2, 60 mins electrolysis, electrodes distance of 1 cm)
Treatment efficiency (%)
pH
COD
Ammonium
TSS
Color
5
50,00
14,33
16,65
24,11
6
69,62
22,02
18,95
40,99
7
73,91
22,63
30,55
67,1
8
72,00
24,88
39,93
72,2
9
62,90
19,22
19,26
50,71
Form Table 3.3, it can be seen that the treatment efficiency reaches the
highest at pH from 7 to 8. Studying the effect of the input pH also shows that
when pH is larger than 8, COD, ammonium, TSS and color treatment efficiencies
decrease. The more the electrolysis time increases, the more the pH increases
(according to Figure 3.5), resulting in a reduction in treatment efficiency. This is
also the basis to explain when the electrolysis time is greater than 60 minutes, the
9
treatment efficiency increases lightly or no increase. On the other hand, the input
pH of Nam Son landfill leachate is around 8, then the input pH (about 7-8) is
chosen for the further studies to save pH adjustment chemicals and cost.
3.1.3. Effects of iron electrodes distance to COD, ammonium, TSS and color
treatment efficiencies
Figure 3.10. Effect of electrodes
Figure 3.11. Effect of electrodes distance
distance on COD treatment efficiency
on ammonium treatment efficiency
Figure 3.12. Effect of electrodes
Figure 3.13. Effect of electrodes distance
distance on TSS treatment efficiency
on color treatment efficiency
Table 3.4. COD, ammonium, TSS and color treatment efficiencies at different
electrodes distances (J = 3,896 mA/cm2, electrolysis time of 60 mins)
Electrodes
Treatment efficiency (%)
distance (cm)
COD
Ammonium
TSS
Color
1
76,79
23,64
38,61
71,67
3
63,71
20,38
27,21
64,2
5
50,00
14,85
21,1
44,1
7
45,65
10,54
8,02
28,5
Table 3.4 shows that at the electrode distance of 1 cm, the highest
treatment efficiency is achieved with COD, ammonium, TSS and color
efficiency respectively: 76.79; 23.64; 38.61 and 71.67%. When the distance
between the plates increases, the pollutants removal performance decreases. In
this study, it is not possible to reduce the electrode distance to less than 1 cm
because the characteristics of Nam Son landfill leachate has high TSS content
10
causing instability in the electrolysis process. Therefore, the electrode gap of 1
cm is selected to apply for the study.
The results of the study showed that in the current density of J = 3,896
mA/ cm2, the input pH from 7 - 8 and the electrode gap of 1 cm are an optimum
condition for EC process.
3.1.4. Comparison the COD, ammonium, TSS and color treatment
efficiencies between iron and aluminum electrodes.
Comparison the COD, ammonium, TSS and color treatment efficiencies
between iron and aluminum electrodes at different electrolysis times.
Figure 3.14. Effect of electrolysis time
on COD treatment efficiency by iron
electrodes in comparison with
aluminum electrodes
Figure 3.15. Effect of electrolysis time
on ammonium treatment efficiency by
iron electrodes in comparison with
aluminum electrodes
Figure 3.16. Effect of electrolysis time Figure 3.17. Effect of electrolysis time
on TSS treatment efficiency by iron
on color treatment efficiency by iron
electrodes in comparison with
electrodes in comparison with
aluminum electrodes
aluminum electrodes
Electrode material is one of the parameters that directly affects the
electrolysis reactions taking place inside the solution. In each EC reaction, dissolved
anodes and flocculants play an important role to assess the method effectiveness.
11
The effect of electrolysis time on COD, ammonium, TSS and color
treatment efficiencies of iron and aluminum electrodes are shown in Table 3.5.
Table 3.5 shows that the COD, TSS and color treatment efficiencies of
iron electrodes are much higher than aluminum electrodes at all electrolysis
time. Whereas the ammonium removal efficiency of iron and aluminum
electrodes depends on the electrolysis time. Thus, it is clearly to choose the iron
electrodes for research on leachate treatment by EC.
Table 3.5. COD, ammonium, TSS and color treatment efficiencies with iron and
aluminum electrodes at different electrolysis time.
(J = 3,896 mA/cm2, electrodes distance of 1 cm)
Treaatment efficiency (%)
Electrolysis
time (mins)
COD
Amoni
TSS
Color
Fe
Al
Fe
Al
Fe
Al
Fe
Al
10
42,86
6,90
6,64
5,46
9,83
6,71
27,90
19,90
20
58,93 17,24
11,71
8,19
15,95
9,12
46,75
32,91
30
69,64 22,41
14,06
11,34
23,98
14,2
54,56
41,24
40
73,21 37,93 17,770 18,48
30,46
23,4
59,10
45,85
60
76,79 44,83
23,64
26,46
38,61
27,1
71,67
58,98
80
79,29 44,83
24,79
30,24
38,97
29,1
79,39
66,64
Comparison the COD, ammonium, TSS and color treatment efficiencies
between iron and aluminum electrodes at different input pH of leachate.
Figure 3.18. Effect of pH on COD
treatment efficiency with iron and
aluminum electrodes
Figure 3.19. Effect of pH on
ammonium treatment efficiency with
iron and aluminum electrodes
12
Figure 3.20. Effect of pH on TSS
Figure 3.21. Effect of pH on color
treatment efficiency with iron and
treatment efficiency with iron and
aluminum electrodes
aluminum electrodes
Table 3.6. COD, ammonium, TSS and color treatment efficiencies with iron and
aluminum electrodes at different input pH.
(electrolysis time of 60 mins, electrodes distance of 1 cm)
Treatment efficiency (%)
COD
Amoni
TSS
Color
pH
Fe
Al
Fe
Al
Fe
Al
Fe
Al
5
50,00 18.72 14.33 15.87 16.65 13.8 24.11 22.5
6
69.62 35.9 22.02 23.57 18.95 15.24 40.99 35.7
7
73.92 44.83 22.63 25,56 30.55 22.97 67.04 60.2
8
72,00 43.58 24.88 26.46 39.93 35.83 72.19 65.13
9
62.90 30.76 19.22 22.48 19.26 13.05 50.70 45.63
10
43.75 14.2 11.23 15.76 15.74 11.38 34.58 30.32
Table 3.6 shows that the COD, TSS and color treatment performance
using iron electrode treatment efficiency are much higher than the aluminum
electrode at all pH values. Meanwhile, the ammonium removal efficiency of
aluminum electrode is higher than iron electrode. In acidic (pH < 7) and
alkaline (pH > 8) environments, COD, ammonium, TSS and color treatment
efficiency of both aluminum and iron electrodes are low. This phenomenon was
explained by Park et al. (2002): each type of metal ion in solution can create
different coagulants leading to different performance of pollutant treatment. For
example, the high alkali conditions in aluminum hydroxide and iron hydroxide
solutions exist in the form of Al(OH) 4and Fe(OH)4 respectively. These
hydroxides have poor flocculation activity, then, usually (except for some
polyaluminum products) the coagulant process is difficult to perform in an
acidic environment (Fe: pH = 4 - 5 and Al: pH = 5 - 6).
This result is the basis for selecting the input pH value of the leachate and
the appropriate electrode type. The initial pH 7 - 8 is chosen for both types of
13
electrodes because this is the pH range for the highest COD, ammonium, TSS
and color performance.
Comparison the COD, ammonium, TSS and color treatment efficiencies
between iron and aluminum electrodes at different electrodes distances
Figure 3.22. Effect of electrodes
distance on COD treatment efficiency
in comparison iron with aluminum
electrodes
Figure 3.23. Effect of electrodes
distance on ammonium treatment
efficiency in comparison iron with
aluminum electrodes
Figure 3.24. Effect of electrodes
Figure 3.25. Effect of electrodes
distance on TSS treatment efficiency distance on color treatment efficiency
in comparison iron with aluminum
in comparison iron with aluminum
electrodes
electrodes
Table 3.7 shows that the COD, TSS and color treatment performance using iron
electrodes are much higher than aluminum electrodes at all electrode distances.
Meanwhile, the ammonium removal efficiency of aluminum electrode is higher
than iron electrode but not much. This result is the basis for selecting suitable
electrode distances and electrode types.
The results from the research on leachate treatment performance between
aluminum and iron electrodes in the same conditions showed that iron
electrodes are proved to be superior in COD, TSS and color removal
14
performance. Although the ammonium removal efficiency of the aluminum
electrode is higher than the iron electrode, it is not considerable. With the same
amount of removed pollutants, the consumed energy using iron electrodes can
be calculated to be smaller than that of aluminum electrode. The cost of the
electrodes is also an issue, as the iron electrodes is lower than the aluminum
electrodes. Therefore, iron electrodes were chosen for this study.
Comparing the results of study on COD, ammonium, TSS and color treatment
performance in leachate at appropriate conditions with previous studies is
shown in Table 3.8:
Comparing the results of the thesis with other studies shows that some leachate
indicators in this study have higher treatment efficiency and lower energy consumption.
Table 3.7. COD, ammonium, TSS and color treatment efficiencies between iron
and aluminum electrodes in different electrodes distances
(J = 3,896 mA/cm2, electrolysis time of 60 mins)
Treatment efficiency (%)
Electrodes
distance
COD
Amoni
TSS
Color
(cm)
Fe
Al
Fe
Al
Fe
Al
Fe
Al
1
76,79 44,83 23,64 26,46 38,61 27,1 71,67 67,32
3
63,71 30,00 20,38 20,80 27,21 25,71 64,25 55,46
5
50,00 26,70 14,85 15,60 21,10 18,93 44,42 37,29
7
45,65 22,60 10,54 11,24 8,02
6,95 28,44 20,87
Some comments on the leachate treatment by EC
The study results show that COD, TSS and color treatment efficiencies by
EC process using aluminum electrodes are lower than iron electrodes whereas
the ammonium removal performance of aluminum electrodes is higher than iron
electrodes after more than 40 minutes reaction. This is the basic for selecting
electrode types in further application.
Most of the previous studies have demonstrated that the COD removal
efficiency of iron electrodes is higher than that of aluminum electrodes, but
Ilhan et al. (2008) showed the opposite results of COD removal efficiency of
electrodes. Aluminum is higher than iron electrode.
The research results also show that the EC process is effective for COD
and color treatment because COD and color can be basically removed by the
electrolytic flocculation processes combined with the electrolytic processes
such as oxidation, adsorption. . The EC process is ineffective in the treatment of
ammonium because, unlike the COD, TSS and color processes, ammonium is
treated primarily by electrolysis and chemical processes.
When studying the EC process in the leachate treatment, the suitable
conditions for the treatment are found: iron electrodes, J = 3,896 mA/cm 2, initial
pH = 7 - 8, the electrode distance of 1 cm, electrolysis time of 60 minutes.
15
Study results show that the EC process is a promising method for to treat
leachate. However, if only EC process is used, some parameters of the effluent
discharges have not met the discharge requirements. Further processing is required.
In this thesis, after EC process, treated water continues to be studied by BF treatment.
After the EC process, some of the pollutants remaining in leachate were: COD
< 30%, ammonium > 75%, TSS > 60% and color < 30% compared to the original.
Thus, ammonium and TSS are subject to treatment in the next biological process.
Table 3.8. Comparison the COD, ammonium, TSS and color treatment efficiencies in
different studies at selected conditions
COD
Amonium
TSS
Color
Thesis
71 - 77
24 - 25
38 - 40
71 - 72
Enery/m3
leachate
(KWh)
12,83
Bouhezila F. et al (2011)
68
15 (TN)
-
28
19
Ilhan F. et al (2008)
59
14
-
-
12,5 – 19,6
Li X. et al (2011)
49,8
38,6
-
-
-
Catherine R. et al (2014)
-
-
-
80*
-
Top S. et al (2011)
45
-
-
60
-
Orkun M. O.et al. (2012)
Shivayogimath C.B. et al.
(2014)
65,85
-
-
-
-
53,3
-
-
65
-
Study
Treatment efficiency (%)
1.2 Study on leachate treatment by bio-filter method
Table 3.9. Some characteristics of NRR after EC process
used for input of BF process
No.
Parameters
Unit
After EC
1
pH
8,7 – 9,1
2
COD
mg/l
717 - 870
3
BOD5
mg/l
312 - 337
+
4
NH4 -N
mg/l
410 - 484
5
NO3 -N
mg/l
<1
6
TSS
mg/l
471 - 578
7
Color
Pt-Co
316 - 402
In order to treat thoroughly COD, ammonium, TSS and color, the thesis has
combined two methods namely EC method and followed by BF system. Similar
to the EC method, the biological treatment need to optimize the treatment
conditions such as aerobic and anerobic treatment processes, aeration rates,
dissolved oxygen, input loads to find the optimal conditions.
3.2.1. Effect of aeration modes on COD, ammonium, TSS and color
treatment efficiencies by bio-filter process
16
To evaluate the effect of aeration modes on COD, ammonium, nitrate, TSS and color
performance, a series of experiments is performed with an inlet flow of 3 liters/day in
4 other aeration modes from 1 to 4. The volume of this bio-filter is always fixed.
3.2.1.1. Effect of aeration modes on COD treatment efficiency
Mode 1:
60/60
Mode 2:
45/75
Mode 3:
30/90
Mode 4:
15/105
Figure 3.26. Effect of aeration modes on COD treatment efficiency
3.2.1.2. Effect of aeration modes on ammonium treatment efficiency
Mode 1:
60/60
Mode 2:
45/75
Mode 3:
30/90
Mode 4:
15/105
Figure 3.27. Effect of aeration modes on ammonium treatment efficiency
3.2.1.3. Effect of aeration modes on nitrate treatment efficiency
17
Mode 3:
30/90
Mode 4:
15/105
Mode 1:
60/60
Mode 2:
45/75
Figure 3.28. Effect of aeration modes on nitrate treatment efficiency
3.2.1.4. Effect of aeration modes on TSS treatment efficiency
Mode 1:
60/60
Mode 2:
45/75
Mode 3:
30/90
Mode 4:
15/105
Figure 3.29. Effect of aeration modes on TSS treatment efficiency
3.2.1.5. Effect of aeration modes on color treatment efficiency
18
Mode 4:
15/105
Mode 1:
30/90
Mode 2:
45/75
Mode 3:
30/90
Figure 3.30. Effect of aeration modes on color treatment efficiency
Table 3.10 shows that, when reducing aeration time, COD, ammonium and
color treatment efficiencies decrease, however, TSS treatment efficiency
increases. Thus, mode 1 aeration/non-aeration time = 60/60 minutes has the
highest treatment efficiency for COD, ammonium and color, but the output
nitrate concentration is too large compared to the prescribed standards. Whereas
at mode 4 aeration/non-aeration time = 15/105 minutes, the nitrate concentration
is around 44 mg/l. If aeration time continues to reduce in one cycle, it is a rule
that the system's ability to handle nitrogen is better but the COD, ammonium and
color removal performance are low. The operating cost of anaerobic - aerobic BF
system mostly comes from the cost of aeration. Therefore, the shorter aeration
time in a cycle, the lower energy cost. In terms of treatment efficiency in modes
(especially with nitrogen treatment) and aeration cost, aeration/non-aeration
mode = 15/105 minutes is chosen for further studies.
Table 3.10. COD, ammonium, nitrate, TSS and color treatment efficiencies under
different aeration modes
Aeration/nonaeration mode
(mins)
Mode 1 (60/60)
Mode 2 (45/75)
Mode 3 (30/90)
Mode 4 (15/105)
Treatment efficiency
COD (%)
90,64 ±
0,88
84,91 ±
1,17
79,54 ±
1,00
77,45 ±
1,31
Amonium
(%)
99,88 ± 0,04
99,62 ± 0,03
99,52 ± 0,03
99,21 ± 0,03
Outlet
nitrate
(mg/l)
371,87 ±
9,13
254,5 ±
14,70
160,32 ±
8,44
43,64 ± 1,16
TSS (%)
Color (%)
84,36 ±
0,66
87,39 ±
0,52
89,20 ±
0,57
91,07 ±
0,52
55,13 ±
1,81
46,03 ±
1,14
39,09 ±
1,61
34,75 ±
1,30
19
With the aeration/non-aeration mode = 15/105 minutes, if the total
nitrogen is the sum of ammonium, nitrate and nitrite, the total output nitrogen
reaches VN standards 25: 2009/MONRE column B2.
3.2.2. Effect of input loads on COD, ammonium, nitrate, TSS and color
treatment efficiencies by biological filtration process
The amount of pollutants load has a great influence on the performance of
the BF method. Wijeyekoon et al. (2004) proved that pollutants load also affects
biomass growth. Specifically, the internal microorganism structure is affected
by the increase in load, increasing the concentration of internal sludge,
consequently, the porosity of the microbiological membrane is reduced.
Therefore, the input load is an important factor to assess the processing
threshold of the BF system.
A series of experiments investigating the effect of the input loads on
COD, ammonium, nitrate, TSS and color removal performance are carried out
according to modes 4-8, with the following conditions: aeration/non-aeration:
15/105 minutes gas; the pH of the leachate solution after EC treatment is about
8.7 - 9.1; the inlet flow varies from 3 to 7 liters/day, DO as aeration is 6-7 mg/l,
room temperature (25 - 32oC).
3.2.2.1. Effect of input loads on COD treatment efficiency.
Mode
4: 3 lít
Mode
5: 4 lít
Mode
6: 5 lít
Mode
7: 6 lít
Mode
8: 7 lít
Figure 3.31. Effect of input loads on COD treatment efficiency
(aeration/non-aeration mode: 15/105 mins)
3.2.2.2. Effect of input loads on ammonium treatment efficiency
20
Mode
4: 3 lít
Mode
5: 4 lít
Mode
6: 5 lít
Mode
7: 6 lít
Mode
8: 7 lít
Figure 3.32. Effect of input loads on ammonium treatment efficiency
(aeration/ non-aeration mode: 15/105 mins)
3.2.2.3. Effect of input loads on nitrate treatment efficiency
Mode
4: 3 lít
Mode
5: 4 lít
Mode
6: 5 lít
Mode
7: 6 lít
Mode
8: 7 lít
Figure 3.33. Effect of input loads on nitrate treatment efficiency
(aeration/ non-aeration mode: 15/105 mins)
3.2.2.4. Effect of input loads on TSS treatment efficiency
21
Mode
4: 3 lít
Mode
5: 4 lít
Mode
6: 5 lít
Mode
7: 6 lít
Mode
8: 7 lít
Figure 3.34. Effect of input loads on TSS treatment efficiency
(aeration/ non-aeration mode: 15/105 mins)
3.2.2.5. Effect of input loads on color treatment efficiency
Mode 4:
3 lít
Mode 5:
4 lít
Mode 6:
5 lít
Mode 7:
6 lít
Mode 8:
7 lít
Figure 3.35. Effect of the input loads on the color treatment efficiency
(aeration/ non-aeration mode: 15/105 mins)
Table 3.11 shows that, when the input load increases, the treatment
efficiencies of COD, ammonium, TSS, color all decrease. Mode 4 shows the lowest
output nitrate concentration, when the load increase, the total concentration of
output nitrogen increases to near the allowed level. If the load continues to increase,
the nitrogen treatment capacity of the system does not reach VN standards 25:
2009/MONRE column B2 but the COD and ammonium performance is still
reached. Therefore, it is no longer possible to increase the load. Therefore, the
conditions being suitable for the further study are mode 4: 15 minutes aeration/105
minutes non-aeration and an input ammonium load does not exceed 0.16 kg/m3/day.
22
Table 3.11. COD, ammonium, nitrate, TSS and color treatment efficiencies
under different loading modes
Input
volume
(l/day)
CĐ 4
(3)
CĐ 5
(4)
CĐ 6
(5)
CĐ 7
(6)
CĐ 8
(7)
COD
Amoni
Load
kg/m3
day
Treatment
efficiency
(%)
Load
kg/m3
ngày
Amonium
treatment
efficiency
(%)
0,120 ±
0,004
77,46 ±
1,22
0,066 ±
0,0013
99,21 ±
0,03
0,162 ±
0,004
76,32 ±
0,59
0,089 ±
0,0013
99,12 ±
0,02
0,202 ±
0,0048
75,51 ±
0,86
0,112 ±
0,0022
99,01 ±
0,03
0,242 ±
0,0053
74,61 ±
0,74
0,136 ±
0,0022
0,280 ±
0,0061
73,77 ±
0,65
0,157 ±
0,0011
Nitrate
Inlet
TSS
Color
Load
kg/m3
ngày
Treatment
efficiency
(%)
Treatment
efficiency
(%)
43,64
± 1,16
0,077 ±
0,0017
91,07 ±
0,52
34,75 ±
1,30
44,84
± 0,74
0,103 ±
0,0023
88,46 ±
0,36
31,00 ±
0,58
46,92
± 0,63
0,129 ±
0,0025
86,46 ±
0,48
28,32 ±
0,60
98,94 ±
0,02
48,17
± 0,46
0,153 ±
0,032
85,01 ±
0,45
24,03 ±
0,44
98,88 ±
0,01
49,55
± 0,70
0,179 ±
0,0033
83,34 ±
0,53
16,70 ±
0,75
(mg/
l)
<1
Outlet
(mg/l)
Comparing the results of the thesis with other studies applying the same
techniques was shown in Table 3.12:
Table 3.12. Comparison of the COD, ammonium, TSS and color treatment efficiencies
between the thesis and other studies by EC and BF processes under selected
conditions.
Treatment efficiency (%)
Pollutants in
leachate
Drogui Patrick et. Drogui Patrick et. al
al (2016)
(2018)
Thesis
EC (Fe)
BF
BF
EC (Mg)
EC (Al)
BF
COD
71 - 77
73,77 ± 0,65
-
53
37 ± 2
42 ± 7
BOD
-
> 90 (BOD5)
94
-
-
97
Amonium
TSS
24 - 25
38 - 40
98,88 ± 0.01
83,34 ± 0,53
94
-
-
-
> 99
-
Color
71 - 72
16,7 ± 0,75
85
60 ± 13
-
Energy/m3
NRR (KWh)
12,83
-
-
1,23 US$
-
-
Figure 3.36 shows the total treatment efficiencies of COD, ammonium,
TSS and color are about 91.7; 97.77; 87.65 and 75.89% respectively. Thus,
COD, ammonium, TSS and color treatment efficiencies of bio-filter system are
relatively high and there is a close combination of treatment efficiency between
EC and BF process.
23
Figure 3.36. COD, ammonium, TSS, color treatment efficiencies in
leachate by EC combined with BF
(EC: J = 3,896 mA/cm2; time = 60 mins; electrodes distance = 1 cm. BF:
A/N-A= 15/105 mins; DO aeration = 6 -7 mg/l; the load = 7 l/d)
Output parameters after EC and BF process under selection conditions are
shown in table 3.13.
Table 3.13. Output parameters after EC and BF process under selected condition
After BF (A/N-A: 15/105
Parameters Unit Before EC After EC
mins; input load: 7l/d)
COD
mg/l 2930 - 3065 717 - 870
182 - 245
BOD5
mg/l 958 - 1106 312 - 337
15 - 32
+
NH4 -N
mg/l
556 - 635 410 - 484
4,8 – 5,2
NO3 -N
mg/l
1,3 – 2,1
<1
47 - 51
NO2 -N
mg/l
<1
<1
2,4 – 5,1
TSS
mg/l
822 - 895 471 - 578
76 - 90
Color
Pt-Co 1178 - 1329 316 - 402
285 - 317
Comments on the research process of leachate treatment by BF method
The BF process gives high ammonium and TSS treatment efficiencies in the
study range. Although COD and color treatment efficiencies are not high, the
output parameters reach VN standards 25: 2009/MONRE column B2. Hence,
BF method can be an good option to treat leachate after EC treatment.
Research results show that in order to remove COD and ammonium, we
can choose an aeration/non-aeration mode is 60/60 minutes, however, under this
mode the output concentration of high nitrate, total nitrogen exceeds the norm.
To nitrogen concentration after BF process meets VN standards 25:
2009/MONRE column B2, the aeration/non-aeration mode must be 15/105
minutes and the input ammonium load can not exceeding 0.16 kg/m3.day.
Comments on the research process of leachate treatment by EC method in
combination with BF