Điều khiển công bằng luồng trong mạng chuyển mạch chùm quang tt tiếng anh
Bạn đang xem bản rút gọn của tài liệu. Xem và tải ngay bản đầy đủ của tài liệu tại đây (1.02 MB, 27 trang )
HUE UNIVERSITY
UNIVERSITY OF SCIENCES
LE VAN HOA
RESEARCH OF THE FAIRNESS CONTROL
IN OPTICAL BURST SWITCHING NETWORKS
MAJOR: COMPUTER SCIENCE
CODE: 9480101
SUMMARY OF PHD THESIS
Supervisors:
1. Assoc. Prof. Dr. Vo Viet Minh Nhat
2. Dr. Nguyen Hoang Son
HUE, YEAR 2019
The thesis has been completed at:
University of Sciences, Hue University
Supervisor:
1. Assoc. Prof. Dr. Vo Viet Minh Nhat, Hue University
2. Dr. Nguyen Hoang Son, University of Sciences, Hue University
Reviewer 1: Assoc. Prof. Dr. Dang Van Duc
Institute of Information Technology,
VietNam Academy of Science and Techonology
Reviewer 2: Assoc. Prof. Dr. Truong Thi Dieu Linh
Hanoi University of Science & Technology
Reviewer 3: Assoc. Prof. Dr. Huynh Xuan Hiep
Can Tho University
The thesis will be presented at the Committee of Hue University, to be held
by Hue University at .......................................................................................
The thesis can be found at the follow libraries:
National Library of VietNam
Library Information Center University of Science, Hue University
PREFACE
1. The urgency of the topic
The continuous development of Internet in recent decades, along with the
explosion of communication services, has increased demands for bandwidth.
This poses a major challenge in finding suitable communication technologies
to enhance the communication capabilities of new generation networks.
Optical networks, together with the technology of wavelength division
multiplexing (WDM), have provided an effective solution to meet these
requirements [24], [36].
Optical communication, from its inception in early 1990s to the present, has
undergone many generations of development: from the initial model of
wavelength routing with end-to-end dedicated lightpaths to the model of
optical packet switching [36], which has been proposed recently, with the idea
taken from electronic packet switching networks. However, with some
technological limitations, such as not being able to produce optical buffers
(similar to RAM in electronical networks) or the optical packet switches in
nanosecond speed, optical packet switching has not yet been come true. A
compromise solution is the optical burst switching (OBS) model.
A typical feature of the communication in optical burst switching (OBS)
networks is that the burst control packet (BCP) is separated from its data burst.
In other words, to transmit an optical burst, a BCP is formed and sent ahead an
offset time that is sufficient to reserve resources and configure switches at
intermediate nodes along the path that its burst will pass from source to
destination. In addition, the OBS network reserves some channels
(wavelengths) for BCPs, while the remaining channels are used for burst
transmission. Thus, the BCP transmission is completely separate from its burst
in terms of space (on separated transmission channels) and also in time (sent
ahead an offset time) [65].
With the transmission mode, it is clear that OBS networks do not need
optical buffers to temporarily store optical burst while waiting for the
switching at core nodes, nor do it require the switches in nanosecond.
However, this way of communication also places a pressure on how a control
1
packet can promptly reserve resources and successfully configure switches at
the core nodes for its following burst. That is the task of operations such as
resource reservation, scheduling, contention resolution ... In addition, another
issue that is also interested by many researchers in the field of OBS networks
is how to ensure the fairness of the different flows which share the same links
within OBS networks.
In OBS networks, fairness is studied in three main directions: delay fairness
[69], througphut fairness [53] and distance fairness [10]. Ensuring the fairness
of flows which share resources in OBS networks is very significate, on the one
hand to ensure the commitment of service quality, and other hand to optimize
the communication performance per flow and/or entire network (based on data
loss rate, bandwidth utilization rate, end-to-end delay rate, etc.).
2. Research motivation
There have been a number of studies on fairness issues in OBS networks
that can be classified into two main approaches which based on the location of
implementation:
- The fairness solutions at edge nodes and
- The fairness solutions at core nodes.
With the first group, there are two main research directions: (1) delay
fairness and (2) throughput fairness; while in the second group, the fairness
problem is known mainly as distance fairness.
In OBS networks, the ingress node plays an important role in controlling
fairly flows, because:
1. The ingress node controls the traffic of flows (end-to-end connections)
fairly before transfers them into the core network;
2. Only the ingress nodes have buffers, so the fair control of delay,
throughput ... is made easier; and
3. The core node does not have buffer, so fair handling at the core node
almost depends on the control operations of its ingress node.
Based on these characteristics, the thesis focuses on the study of fairness
control at the ingress node, with two main activities: delay control and
throughput control.
2
3. Research objectives
Studying and proposing some improvements in the burst assembly
with delay reduction to reduce the communication delay over OBS
networks;
Studying and proposing a solution of the burst assembly with delay
fairness for delay-based QoS difference, delay reduction and delay
fairness of different priority flows.
Studying and proposing a solution with throughput fairness, which can
be applied to different types of incoming flows with Poisson and nonPoisson distribution.
Studying and proposing a solution of burst padding to improve
bandwidth utilization and throughput fairness.
4. Contribution of thesis
The main contributions of the thesis include:
Proposing two burst assembly models with delay fairness, named
iBADR [CT2] and OBADR [CT3], in order to reduce the burst
assembly delay.
Proposing a burst assembly model with delay fairness, named BADF
[CT5], that results in delay-based QoS difference, delay reduction and
delay fairness of different priority flows.
Proposing a bandwidth allocation model with throughput fairness,
named TFBA [CT6], that is applicable to different types of incoming
traffics.
Proposing a burst padding solution, named QDBAP [CT7], in order to
improve bandwidth utilization and throughput fairness.
3
CHAPTER 1: AN OVERVIEW OF THE FAIRNESS
IN OPTICAL BURST SWITCHING NETWORKS
1.1 Switching models in optical communication
Optical switches are divided into 3 types: optical channel switching (OSC),
optical packet switching (OPS) and optical burst switching (OBS), in which
OBS has inherited the advantages from the two others, where no optical buffer
and high-speed optical switche are needed.
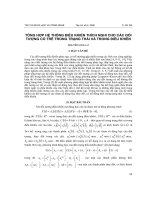
1.2 Communication principle of OBS networks
In OBS networks, different types of incoming data are aggregated into data
bursts before being sent (Figure 1.2a). At egress nodes, the bursts will be
disassembled into original packets which are then delivered to their destination
(Figure 1.2b).
Figure 1.1 The process of assembling and disassembling at the edge OBS nodes
1.3 Operations within OBS networks
1.3.1 Assembling
Burst assembling is a method of aggregating packets (such as IP packets,
ATMs, etc.) from different access networks into larger burst at ingress nodes
of the OBS network.
1.3.2 Signaling
There are two main types of signaling protocols in OBS networks: JIT and
JET, in which JET is the signaling protocol implemented for most OBS
networks because it makes better use of the bandwidth.
4
1.3.3 Scheduling
When a control packet arrives at a core node, a scheduling algorithm is
called to schedule its following burst on an output link. There are three main
scheduling mechanisms: (1) scheduling without void filling; (2) scheduling
with void filling and (3) group scheduling.
1.3.4 Contention resolution
As with any packet-switched network, contention also appears in OBS
networks. That is when two burst simultaneously dispute the same resource at
the same link (wavelength). Possible solutions to contentions in OBS networks
include: wavelength conversion, using FDL, deflection routing and
combination of the above solutions.
1.4 Fairness issues in OBS networks
1.4.1 The fairness concept in OBS networks
According to Denda et al. [38], fairness is known as the satisfaction of
individuals in the process of resource allocation. In the OBS network, fairness
issues are distinguished by: delay fairness, throughput fairness and distance
fairness, which are considered at edge and core nodes (Figure 1.7).
FAIRNESS IN OBS NETWORKS
EDGE NODES
DELAY FAIRNESS
CORE NODES
THROUGHPUT
FAIRNESS
DISTANCE FAIRNESS
Figure 1.7 Fairness classification based on consideration location
1.4.2 Delay fairness
Fairness delay refers to establishing fairly a buffering delay (including
assembling delay and offset time) for bursts of different QoS classes.
5
1.4.3
Throughput fairness
Throughput fairness refers to the fair allocation of bandwidth between flows which
share the same link.
1.5 Summary chapter 1
This chapter has introduced an overview of OBS networks and its
operations, in which the burst assembly at the ingress node is focused on
analysis because it plays an important role in the fairness of entire network.
This chapter has also analyzed and evaluated the methods of fairness control
that have been published so far. That is the basis for the thesis to identify the
research objectives, as well as propose the improved architecture of ingress
node with additional functional modules to ensure the implementation of the
fairness solutions proposed by the thesis.
1.5.1 Distance fairness
Distance fairness refers to dealing with contentions fairly (as measured by
the data loss rate) based on the path length (number of hops) from source to
destination.
1.6 Research objectives
The thesis focuses on the fairness issues at the ingress node to improve the
efficiency of delay and throughput fairness, with four main objectives:
1. Improving and proposing new solution of burst assembly for delay
reduction that applies to each individual queue.
2. Improving and proposing new solution of delay fairness control that
applies to multiple queues with different QoS levels.
3. Improving and proposing new solution of throughput fairness control
that applies to flows of Poisson and Non-Poisson distribution.
4. Proposing new solutions of burst padding to improve communication
performance.
6
CHAPTER 2: BURTS ASSEMBLY FOR DELAY REDUCTION
AND DELAY FAIRNESS
2.1 Model of burst assembly for delay reduction
2.1.1 Issue of the burst assembly delay
The end-to-end delay of a burst transmitted over an OBS network is mainly
caused by four components: (1) the assembly delay at ingress node, (2) the
offset time for resource reservation of the control packet, (3) burst switching
delay at core nodes and (4) propagation delay over core network. Two first
delays are collectively formed a common element which há the name the
buffering delay; two latters usually do not change corresponding to a given
implemented protocol. Therefore, the proposals usually focus on reducing the
buffering delay.
2.1.2 Related works
2.1.2.1 Analysis of the published methodes of burst assembly for delay
reduction
There are 6 published methodes of burst assembly for delay reduction as
shown in Table 2.1.
Table 2.1 Comparison of the published methodes of burst assembly for delay reduction
IE-BADR
POQA
JK-BADR
BADR-EAT
MTBA-TP
BASTP
Timer-based
Timer-
Timer-
Timer-based
Hybrid
Hybrid
based
based
fixed
fixed
fixed
fixed
fixed
addaptivei
Estimation
Based on the
Based on
Based on
Based on the
Based on the
Based on
method
average speed
the
the
density of
arrival speed
M last
Burst
assembly
method
Assembly
threshold
of packets
length of
estimated
the last M
of the last
burst
arriving in the
the last
error of the
packets
packet
assemblies
estimated
M bursts
previous
To
t1 + To – Ta
To
time period
assembly
Reduced
delay
To
To
To
7
2.1.2.2 Comparison and analysis of simulation results
Simulation is done with the following objectives:
Comparing the average estimattion error rate (Formula 2.8) between
the methodes of burst assembly for delay reduction.
L
M
RE
j 1
j
Lej / L j
M
(2.8)
where M is the number of assembly times, Lej and Lj are the
estimation size and the completed size of burst j.
Comparing the number of redundant packets transferred for the next
burst of 100 consecutive assembly times between the methodes of
burst assembly for delay reduction.
Analyzing the way to select the thresholds for BASTP, the best
methode of burst assembly for delay reduction.
The simulations are installed on a PC with 2.4 GHz Intel Core 2 CPU, 2G
RAM. Packets arriving at the ingress node have a Poisson distribution with
exponentially random size in the range of [500, 1000] bytes. Traffic loads
ariving at the queues varies from 0.1 to 0.9. Simulations are performed in 1
second). Data were extracted from NS2 [71] with support package obs-0.9a.
Other parameters include Ta = 6 ms, To = 2 ms
a. Comparison of the average estimation rate
Figure 2.3 shows a comparison of the average estimation error between the
methods of burst assembly for delay reduction. The simulation results show
that the estimation error of the statistical-based methods such as BASTP,
BADR-EAT and POQA being lower than that of other methods.
Figure 2.3 Comparison of the average estimation error rate of IE-BADR, JK-BADR, POQA,
BADR-EAT, MTBA-TP and BASTP with normalized load to 0.5
8
b. Comparison of the number of redundant packets transferred for the
next burst
Figure 2.6 Comparison of the number of redundant packets in 100 consecutive assembly times.
c. Analizing the way to select the thresholds for BASTP
As described in Figures 2.3 and 2.6, BASTP always gives the best
simulation results. However, these results is often accompanied by a pairs of
suitable selected threshold value (Lmin, Lmax).
2.1.2.3 Comments
The above analysis, comparisons and evaluations (published in [CT1]) are
the basis for proposing the improvements of burst assembly for delay reduction
which are presented in the following sections.
2.1.3 Method of burst assembly for delay reduction iBADR
2.1.3.1 Introduction to the incoming traffic estimation method TW-EWMA
To estimate the incoming traffic at a queue, Salad et al. [23] proposed the
TW-EWMA method. Unlike other estimation methods that often count
incoming packets at continuous observation intervals (estimation cycles), TWEWMA only counts in a smaller estimation time window (Tw) to reduce the
calculation cost (Figure 2.7).
TW2
TW1
a estimated cycle
TW3
a estimated cycle
TWn
Times
Figure 2.1 The estimation time windows in TW-EWMA
2.1.3.2 Method of burst assembly for delay reduction iBADR
The iBADR (improved Burst Assembly for Delay Reduction) method is
also based on the idea of sending the control packet early at the time
t1 Ta To (Ta > To) and the corresponding burst is sent at the time t2 Ta
9
; As a result, the delay of packets carried in the current burst is reduced a period
To. The thesis uses TW-EWMA [23] to estimate the arriving packet rate,
thereby estimating the completed burst size.
The authors in [23] set α to a fixed value (equal to 0.3), which does not in
fact reflect the abnormal changing nature of the incoming traffic; The result is
a significant estimation error. The thesis proposes to change α in a flexible way
according to the ratio of current rate (cur) and average rate (λavg) of incoming
packets as Formula 2.12.
cur
cur
(2.12)
1 avg
avg cur
In order to increase the accuracy of the estimation, the thesis flexibly adjusts
the time threshold based on the average estimation error of the previous burst
assembly times according to Equation 2.13.
( L Le )
(2.13)
L
2.1.3.4 Comparison and analysis of simulation results
The simulation parameters for this part are similar to Section 2.1.2.2.
a. Comparison of the average estimation error rate
The results in Figure 2.8 show that iBADR has the smallest estimation error
rate.
R (1 ) RE
Figure 2.8 Comparison of the average estimation error rate between iBADR and previous
methods
b. Comparison of the number of redundant packets in 100 consecutive
assembly times
Figure 2.10 shows a comparison on the number of redundant packets
10
between iBADR and previous methods, where the number of redundant bursts
of iBADR is significant.
Figure 2.10 Comparison of the number of redundant packets in 100 consecutive assembly
times.
2.1.3.5 Comments
Based on simulation results, iBADR achieved a estimation error rate lower
than that of BASTP, but it generates relatively many redundant packets as
shown in Figure 2.10. The method of burst asembly for delay reduction iBADR
has been published in [CT2].
2.1.4 Method of burst assembly for delay reduction OBADR
2.1.4.1 Description
The OBADR (Optimal Burst Assembly for Delay Reduction) method is an
improvement of iBADR, in addition to applying the burst length estimation
method TW-EWMA with flexibly adjusted , the burst assembly process is a
combination of the 2 assembly stages:
Stages 1: When the first packet arrives at a queue, the timer of the
queue is triggered. The control packet is only sent to the core network
when the timer reaches the threshold Tw, which is the size of the time
window. The estimated length ( Le ) is also calculated based on TWEWMA with flexibly adjusted .
Stages 2: The burst assembly process continues, but now based on the
estimated length threshold. The burst is only completed when the
number of packets arriving in the queue reaches the threshold Le .
2.1.4.3 Comparison and analysis of simulation results
The simulation parameters for this part are similar to Section 2.1.2.2.
11
a. Comparison of the average estimation error rate
Figure 2.11 shows that the average estimation error rate ( RE ) of OBADR
is lower than that of all previous methods.
Figure 2.11 Comparison of the average estimation error rate between OBADR and previous
methods
b. Comparison of the number of redundant packets in 100 consecutive
assembly times
Figure 2.13 Comparison of the number of redundant packets in 100 consecutive assembly
times.
As shown in Figure 2.13, OBADR does not generate redundant packets.
This is due to the estimated lengths used as the length threshold in burst
assembly.
2.1.5 Effect of the factor α on OBADR
2.1.5.1 Investigating the variation of α depending on the load changes
With the normalized load changing from 0.1 to 0.9 and α changing from 0.1
to 0.9, the simulation results show that the estimation error is minimum when
α has a distribution in the range of (0.4, 0.6). Thus, the fixed α setting is clearly
not suitable when arriving load is varied.
12
2.1.5.2 Comparing the burst assembly efficiency when α is fixed and varied
Simulation results show that dynamic α results in a better average
estimation error than fixed α (α = 0.5) when the assembly time is small (from
2.5 ms to 5.5 ms).
2.1.5.3 Comments
Based on the simulation results, flexible adjustment of α values (such as
Equation 2.12) depending on the incoming traffic rate has increased the
efficiency of estimating the complete burst length. This result also confirms
the effect of flexible adjustment of α according to the incoming traffic rate.
The results of this study were published in [CT4].
2.1.6 Effect of OBADR on scheduling
2.1.6.1 Analyze the effect of OBADR on scheduling based on Engset method
2.1.6.2 Comparison of the analysis model and simulation result
As shown in Figure 2.19, OBADR achieves a lower probability of burst
loss compared to the traditional model in theory and simulation.
Figure 2.2 Comparison on the probability of burst loss between OBADR and traditional
model
2.1.6.3 Comments
Based on the analysis and simulation results, OBADR has proven to be the
most efficient burst assembly method in term of low estimation error, reduced
delay and minimized burst loss rate. The method of burst assembly for delay
reduction OBADR was published in [CT3].
2.2 Model of burst assembly for delay fairness
2.2.1 Related works
The models of burst assembly for delay reduction share a common idea of
sending the control packet early before the burst is completed. Among these
13
models, only POQA [69] is associated with service differentiation.
Specifically, the authors in [69] have set different offset times for bursts with
different priority classes and adjusted the assembly times so that the higher
priority burst is, the shorter the buffering time. As the example shown in Figure
2.21, the burst with the highest priority class class0 has the smallest assembly
time Ta(0) and the largest offset time To(0), while the lowest priority class
class2 has the longest assembly time Ta(2) and the smallest offset time To(2).
class0
To(0)
Ta(0)
class1
To(1)
Ta(1)
class2
To(2)
Ta(2)
Figure 2.3 An example of time thresholds and offset times for 3 classes
2.2.2 Method of burst assembly for delay fairness BADF
2.2.2.1 Introduction to the delay fairness in OBS networks
With the concept of delay fairness proposed in [69], higher priority burst
will have a shorter buffering time. However, this interpretation has not yet
shown the nature of the fair response to individuals in the notion of fairness.
Therefore, the thesis supplements the concept of delay fairness as follows:
Delay fairness is the satisfaction on delay between different priority bursts,
such that the average ratio of the end-to-end delay to their limited delay is
approximative. In addition, in order to meet the requirement for prioritizing
delays in OBS networks, the following two constraints were added.
1. The higher the priority is, the lower the end-to-end delay is; and
2. The end-to-end delay of a burst is not greater than its limited delay
(Example: RTT of IP packets carried in a burst).
Thus, the concept of "delay fairness" added by the thesis implies the
concept of delay fairness proposed in [69].
2.2.2.2 Index of delay fairness
Let D(i) be the average delay that packets must wait in queue i before being
aggregated into a burst and Ta(i) is the assembly time of queue i, xi = D(i)/Ta(i)
will reflect the delay of the packets in queue i. The thesis proposes a formula
to calculate the DFI delay fairness index for different priority bursts based on
14
Jain's formula in [39] as follows:
x
i 1 i i
n
DFI
2
n i 1 ( i xi ) 2
n
(2.22)
Fairness will increase as DFI approaches 1, and equals 1 when
1 x1 2 x2 ... n xn , where i is the weight of xi, 0 < i < 1 and
n
i 1
i 1.
2.2.2.3 Method of 2-stage burst assemly
The Burst Assembly for Delay Fairness (BADF) method is also based on
the idea of sending control packets early (see Section 2.1.3 and 2.1.4), but
adding new points in the 2-stage assembly model. Stage 1 is a estimated time
threshold-based burst assembly and Stage 2 is a estimated length thresholdbased burst assembly. The 2-stage assembly model is in detail as follows:
Stage 1: when the first packet arrives at queue i, the timer is triggered. The
control packet is only sent when the timer reaches the estimated time threshold
Te(i) = Ta(i) – To(i). The estimated burst length is calculated based on the TWEWMA method [23]:
(2.25)
Le (i) Ta (i) (1 (i)) avg (i) (i) cur (i)
During this period, the value of α(i) is adjusted to increase/decrease
depending on the rate of packet arrival at queue i, calculated by α(i) =
cur(i)/(avg(i) + cur(i)), instead of being fixed as in [23]
Stage 2: the burst assemly algorithm continues until either the length
threshold Le (i ) or time threshold Ta(i) is reached.
2.2.2.5 Comparison and analysis of simulation results
Assuming that incoming packets belong to three priority classes (K = 3),
have Poisson distribution and have exponential distribution sizes in the range
[500, 1000] bytes; three priority queues 1, 2 and 3 are therefore used with the
offset times set to 0.3, 0.2 and 0.1 (ms), respectively.
Simulation objectives include:
Comparing the DFI index between BADF and POQA;
Analyzing the impact of the delay fairness on the assembly time
Ta(i) and the buffering delay;
15
Comparing the estimation error (Formula 2.8) between BADF and
POQA.
a. Comparison of the DFI index between BADF and POQA
Figure 2.4 Comparison of the DFI index between BADF and POQA
b. Analyzing the impact of the delay fairness on the assembly time Ta(i)
and the buffering delay
As shown in Figure 2.25, the assembly time Ta(i) decreases as the incoming
traffic of packets increases, with class0 during the simulation period [0.4, 0.6]
and with class2 during the simulation period [0.7 , 0.9].
Figure 2.5 Comparison of Ta(i) between 3 priority classes with BADF
c. Comparison of the estimation error between BADF and POQA.
Figure 2.60 Comparison of the estimation error between BADF and POQA
16
Figure 2.30 shows a comparison of the estimation error rate (Formula 2.8)
between BADF and POQA, where the estimation error of BADF is much
smaller than that of POQA.
Figure 2.7 Comparison of the bandwidth wasting rate between BADF and POQA
Figure 2.8 Comparison of re-send rate between BADF and POQA
2.2.2.6 Comments
The BADF algorithm has been proven to effectively control the delay
fairness between different QoS queues, based on DFI index, estimation error,
and re-send rate. One drawback of BADF, however, is the high bandwidth
wastage rate about 12% on average (Figure 2.31). However, if compared with
the re-send rate of POQA (about 30% on average), BADF is better. The BADF
algorithm and the above results have been published in [CT5].
2.3 Summary chapter 2
This chapter presents two proposed models of delay reduction iBADR
[CT2] and OBADR [CT3], and a model of delay fairness BADF [CT5]. Based
on simulation results, iBADR and OBADR achieve lower delay than previous
proposals. BADF also achieves the delay fairness which is almost optimal,
while reducing the delay and minimizing the estimation error on the queues.
17
CHAPTER 3: THROUGHPUT FAIRNESS
BASED ON BANDWIDTH ALLOCATION AND BURST PADDING
3.1 Model of bandwidth allocation with throughput fairness
3.1.1 Introduction to fair bandwidth allocation
Fair bandwidth allocation, also known as rate fairness, refers to allocating
bandwidth for connections proportional to the provided bandwidth to the
available bandwidth [53].
3.1.2 Related works
So far, the models of fair bandwidth allocation in OBS networks are based
on the max-min fair bandwidth allocation model in IP networks [16], such as
MMFP and RFP.
3.1.3 Bandwidth allocation with throughput fairness TFBA
3.1.3.1 Architecture of the ingress node supporting QoS
Consider an ingress node with an architecture as shown in Figure 3.3.
Figure 3.1 Architecture of the ingress node supporting QoS
3.1.3.2 Maximum bandwidth ratio for each link in OBS networks
Table 3.1 Maximum throughput rate per link with different normalized loads
Normalized load
0.5
0.6
0.7
0.8
0.9
1.0
Maximum throughput
0.48616
0.572186
0.67152
0.72123
0.7213
0.71945
3.1.3.3 Description of TFBA
The idea of TFBA is to adjust actual throughput close to the fair allocation
bandwidth to ensure fair bandwidth allocation between flows.
The process of allocating bandwidth with fairness throughput includes 4
steps:
Step 1: Determine the fairness rate Fi for each connection
18
If the incoming traffic of flow i varies significantly, the bandwidth is first
divided among the connections, the ratio Fi of each connection is determined
as the minimum of the actual throughput (Ai) and the fairly allocated
bandwidth. Connections with actual throughput less than the allocated
bandwidth will not participate in the redundant bandwidth sharing process in
the next time. The allocation is continued until the allocated bandwidth (m)
does not change from the previous time (m = mprev) or all connections are
satisfied (m = 0).
Step 2: Determine the fairly allocated bandwidth ABi for each connection
Let Bw be the maximum output bandwidth, the fair allocation bandwidth for
connection i is determined by Equation 3.4
(3.4)
ABi Fi Bw
where Fi is the fairness ratio determined in Step 1.
Step 3: Measure the actual throughput ATi of each connection
Actual throughput is determined by Formula 3.5
ATi p w (i ) / Tw (i )
(3.5)
where pw(i) is the number of packets arriving in the time window Tw(i).
Step 4: Handling burst contention
The burst contention problem is resolved based on a comparison between
ATi and ABi to determine whether the incoming burst is in an overrate
(overloaded) flow. If ATi > ABi, the incoming burst is in an overrate flow and
will be dropped to reserve resources for the bursts in an underrate
(unoverloaded) flow. Conversely, if ATi < ABi, the arrival burst is in underrate
flow and the ratio ATi /ABi will be considered. If the value of ATi /ABi is smaller
than that of ATj/ABj, the scheduled burst will be dropped. Conversely, if the
value of ATi /ABi is greater than ATj/ABj, the incoming burst will be dropped.
3.1.3.4 Index of throughput fairness
The fair bandwidth allocation approach proposed by the thesis also comes
from the idea of max-min fairness, but based on the ratio between actual
throughput and provided bandwidth, instead of probability of loss. as in [67],
[53]. Specifically, set yi = ATi / ABi is the ratio between the actual throughput
(ATi) and the fair allocation bandwidth (ABi) of flow i. Based on Jain's formula
in [39], the thesis proposes the throughput fairness index (TFI) as follows:
19
TFI
y
i 1 i i
n
2
(3.6)
ni 1 ( i y i ) 2
n
where σi is the weight that represents the actual used bandwidth compared to
the provided bandwidth between the flows, 0 < σi < 1 and
n
i 1
i 1.
3.1.3.6 Comparison and analysis of simulation results
Simulation objectives include:
- Comparing the byte loss rate between connections and the average byte
loss rate among TFBA, MMFP and RFP
- Comparing the fairness based on TFI among TFBA, MMFP and RFP.
Because the simulation objective only considers the byte loss rate of the
connections which share the same (or group of) output link(s), the Dumbbell
simulation network as shown in Figure 3.5 is sufficient to evaluate the
effectiveness of the proposed algorithm.
Figure 3.2 Simulation network topology
a. Comparison of the byte loss rate between connections
Figure 3.3: Comparison of the byte loss rate between 3 connections with TBFA in 2 cases: (1)
The total load does not exceed the link capacity and (2) the load of connection 3 spikes
beyond the link capacity
20
Figure 3.4 Comparison of the average byte loss rate on 3 connections of TFBA, RFP and
MMFP
b. Comparison of the fairness based on TFI
Figure 3.5 Comparison of the fairness based on TFI among TFBA, MMFP and RFP
3.1.4 Analyzing the impact of TFBA on scheduling at output link
3.1.4.1 Analytical model
The Markov model [11] is used to analyze the impact of TFBA on
scheduling at output link.
3.1.4.2 Comparison of the effectiveness between analytical model and
simulation results
The simulation results in Figure 3.15 show that the probability of burst loss
of the analysis model is similar to the simulation results (Figure 3.7).
Figure 3.6 Comparison of the effectiveness between analytical model and simulation results
with TFBA
3.1.5 Comments
Based on analysis and simulation results, the TFBA method has proven to
21
be more efficient than previous methods, especially applicable to many types
of incoming flows, instead of only Poisson flow as in [67], [53]. The TFBA
method has been published in [CT6].
3.2 Padding model for effective bandwidth utilisation and throughput
fairness
3.2.1 Related works
3.2.2 Padding method
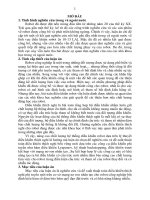
3.2.2.1 Introduction to burst padding
The burst padding model QDBAP (QoS Differentiation Burst Assembly
with Padding) proposed in the thesis is described as shown in Figure 3.17, in
which the burst padding is done by picking packets from low QoS queues to
add into higher QoS burst.
Figure 3.7 An example of a burst padding model with three layers:
(a) before the burst padding and (b) after the burst padding
3.2.2.2 Padding policy
The proposed padding policy is as follows:
1. Only take packets from the low QoS queue to pad in the higher QoS burst
2. Selecting a packet from a low QoS queue is on a first-come, first-served
basis.
3. Low QoS packets are padded to the tail of the higher QoS burst.
4. Only take packets from the low QoS queue that its control packet has not
yet been sent.
3.2.2.4 Comparison and analysis of simulation results
Simulation objectives include:
Comparing wasted bandwidth when using padded bytes and
Compare the throughput fairness based on TFI (Formula 3.8).
a. Comparison of wasted bandwidth
22
Figure 3.8 Comparison of the number of padding bytes between QDBAP and POQA
b. Comparison of the throughput fairness
Figure 3.9 Comparison of the throughput fairness based on TFI between QDBAP and POQA
Figure 3.10 Comparison of the throughput fairness (based on the ratio of the actual load and
the bandwidth capacity) between POQA and QDBAP
3.2.3 Comments
Based on the analysis and simulation results, the QDBAP method has
proven to be effective in increasing bandwidth usage and throughput fairness
for different QoS flows. The results of this study were published in [CT7].
3.3 Summary chapter 3
This chapter introduced a method of bandwidth allocation for throughput
fairness TFBA, which can be applied to many types of incoming flows, greatly
increasing the network performance and assuring throughput fairness (this
result has been published in [CT6]). In addition, this chapter also presents a
proposed burst padding method that increases the efficiency of bandwidth
23