Giới thiệu tổng quan về điện tâm đồ ECG
Bạn đang xem bản rút gọn của tài liệu. Xem và tải ngay bản đầy đủ của tài liệu tại đây (864.43 KB, 13 trang )
Electrocardiography
1
Electrocardiography
Electrocardiography (ECG or EKG)
is a transthoracic interpretation of the
electrical activity of the heart over time
captured and externally recorded by
skin electrodes.[1] It is a noninvasive
recording
produced
by
an
electrocardiographic
device.
The
etymology of the word is derived from
the Greek electro, because it is related
to electrical activity, cardio, Greek for
heart, and graph, a Greek root meaning
"to write" .
12 Lead ECG of a 26-year-old male.
The ECG works by detecting and
amplifying the tiny electrical changes
on the skin that are caused when the
heart muscle "depolarises" during each
heart beat. At rest, each heart muscle
cell has a charge across its outer wall,
or cell membrane. Reducing this
charge towards zero is called
de-polarisation, which activates the
mechanisms in the cell that cause it to
contract. During each heartbeat a
healthy heart will have an orderly
progression of a wave of depolarisation
that is triggered by the cells in the
sinoatrial node, spreads out through the
Image showing a patient connected to the 10
atrium, passes through "intrinsic
electrodes necessary for a 12-lead ECG
conduction pathways" and then spreads
all over the ventricles. This is detected as tiny rises and falls in the voltage between two electrodes placed either side
of the heart which is displayed as a wavy line either on a screen or on paper. This display indicates the overall
rhythm of the heart and weaknesses in different parts of the heart muscle.
Usually more than 2 electrodes are used and they can be combined into a number of pairs. (For example: Left arm
(LA),right arm (RA) and left leg (LL) electrodes form the pairs: LA+RA, LA+LL, RA+LL) The output from each
pair is known as a lead. Each lead is said to look at the heart from a different angle. Different types of ECGs can be
referred to by the number of leads that are recorded, for example 3-lead, 5-lead or 12-lead ECGs (sometimes simply
"a 12-lead"). A 12-lead ECG is one in which 12 different electrical signals are recorded at approximately the same
time and will often be used as a one-off recording of an ECG, typically printed out as a paper copy. 3- and 5-lead
ECGs tend to be monitored continuously and viewed only on the screen of an appropriate monitoring device, for
example during an operation or whilst being transported in an ambulance. There may, or may not be any permanent
record of a 3- or 5-lead ECG depending on the equipment used.
It is the best way to measure and diagnose abnormal rhythms of the heart,[2] particularly abnormal rhythms caused
by damage to the conductive tissue that carries electrical signals, or abnormal rhythms caused by electrolyte
Electrocardiography
2
imbalances.[3] In a myocardial infarction (MI), the ECG can identify if the heart muscle has been damaged in
specific areas, though not all areas of the heart are covered.[4] The ECG cannot reliably measure the pumping ability
of the heart, for which ultrasound-based (echocardiography) or nuclear medicine tests are used. It is possible to be in
cardiac arrest with a normal ECG signal (a condition known as pulseless electrical activity).
History
Alexander Muirhead is reported to have attached wires to a feverish patient's wrist to obtain a record of the patient's
heartbeat while studying for his Doctor of Science (in electricity) in 1872 at St Bartholomew's Hospital.[5] This
activity was directly recorded and visualized using a Lippmann capillary electrometer by the British physiologist
John Burdon Sanderson.[6] The first to systematically approach the heart from an electrical point-of-view was
Augustus Waller, working in St Mary's Hospital in Paddington, London.[7] His electrocardiograph machine consisted
of a Lippmann capillary electrometer fixed to a projector. The trace from the heartbeat was projected onto a
photographic plate which was itself fixed to a toy train. This allowed a heartbeat to be recorded in real time. In 1911
he still saw little clinical application for his work.
An initial breakthrough came when Willem Einthoven, working in
Leiden, Netherlands, used the string galvanometer that he invented in
1903.[8] This device was much more sensitive than both the capillary
electrometer that Waller used and the string galvanometer that had
been invented separately in 1897 by the French engineer Clément
Ader.[9] . Rather than using today's self-adhesive electrodes
Einthoven's subjects would immerse each of their limbs into containers
of salt solutions from which the ECG was recorded.
Einthoven's ECG device
Einthoven assigned the letters P, Q, R, S and T to the various
deflections, and described the electrocardiographic features of a
number of cardiovascular disorders. In 1924, he was awarded the
Nobel Prize in Medicine for his discovery.[10]
Though the basic principles of that era are still in use today, there have been many advances in electrocardiography
over the years. The instrumentation, for example, has evolved from a cumbersome laboratory apparatus to compact
electronic systems that often include computerized interpretation of the electrocardiogram.[11]
ECG graph paper
The output of an ECG recorder is a graph (or sometimes several
graphs, representing each of the leads) with time represented on the
x-axis and voltage represented on the y-axis. A dedicated ECG
machine would usually print onto graph paper which has a background
pattern of 1mm squares (often in red or green), with bold divisions
every 5mm in both vertical and horizontal directions. It is possible to
change the output of most ECG devices but it is standard to represent
each mV on the y axis as 1cm and each second as 25mm on the x-axis
(that is a paper speed of 25mm/s). Faster paper speeds can be used - for
One second of ECG graph paper
example to resolve finer detail in the ECG. At a paper speed of
25 mm/s, one small block of ECG paper translates into 40 ms. Five
small blocks make up one large block, which translates into 200 ms. Hence, there are five large blocks per second. A
calibration signal may be included with a record. A standard signal of 1 mV must move the stylus vertically 1 cm,
that is two large squares on ECG paper.
Electrocardiography
3
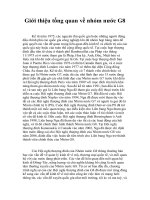
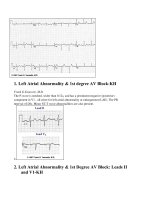
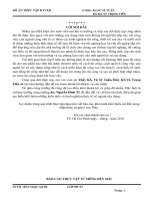
Layout
By definition a 12-lead ECG will show a short segment of the recording of each of the 12-leads. This is often
arranged in a grid of 4 colums by three rows, the first columns being the limb leads (I,II and III), the second column
the augmented limb leads (aVR, aVL and aVF) and the last two columns being the chest leads (V1-V6). It is usually
possible to change this layout so it is vital to check the labels to see which lead is represented. Each column will
usually record the same moment in time for the three leads and then the recording will switch to the next column
which will record the heart beats after that point. It is possible for the heart rhythm to change between the columns of
leads. Each of these segments is short, perhaps 1-3 heart beats only, depending on the heart rate and it can be
difficult to analyse any heart rhythm that shows changes between heart beats. To help with the analysis it is common
to print one or two "rhythm strips" as well. This will usually be lead II (which shows the electrical signal from the
atrium, the P-wave, well) and shows the rhythm for the whole time the ECG was recorded (usually 5-6 seconds). The
term "rhythm strip" may also refer to the whole printout from a continuous monitoring system which may show only
one lead and is either initiated by a clinician or in response to an alarm or event.
Leads
The term "lead" in electrocardiography causes much confusion because it is used to refer to two different things. In
accordance with common parlance the word lead may be used to refer to the electrical cable attaching the electrodes
to the ECG recorder. As such it may be acceptable to refer to the "left arm lead" as the electrode (and its cable) that
should be attached at or near the left arm. There are usually ten of these electrodes in a standard "12-lead" ECG.
Alternatively (and some would say properly, in the context of electrocardiography) the word lead may refer to the
tracing of the voltage difference between two of the electrodes and is what is actually produced by the ECG recorder.
Each will have a specific name. For example "Lead I" (lead one) is the voltage between the right arm electrode and
the left arm electrode, whereas "Lead II" (lead two) is the voltage between the right limb and the feet. (This rapidly
becomes more complex as one of the "electrodes" may in fact be a composite of the electrical signal from a
combination of the other electrodes. (See later.) Twelve of this type of lead form a "12-lead" ECG
To cause additional confusion the term "limb leads" usually refers to the tracings from leads I, II and III rather than
the electrodes attached to the limbs.
Placement of electrodes
Ten electrodes are used for a 12-lead ECG. The electrodes usually consist of a conducting gel, embedded in the
middle of a self-adhesive pad onto which cables clip. Sometimes the gel also forms the adhesive. [12] They are
labeled and placed on the patient's body as follows:[13] [14]
Proper placement of the limb electrodes, color
coded as recommended by the American Health
Association (a different colour scheme is used in
Europe). Note that the limb electrodes can be far
down on the limbs or close to the hips/shoulders,
[15]
but they must be even (left vs right).
12 leads
Electrocardiography
4
Electrode label
(in the USA)
Electrode placement
RA
On the right arm, avoiding bony prominences.
LA
In the same location that RA was placed, but on the left arm this time.
RL
On the right leg, avoiding bony prominences.
LL
In the same location that RL was placed, but on the left leg this time.
V1
In the fourth intercostal space (between ribs 4 & 5) just to the right of the sternum (breastbone).
V2
In the fourth intercostal space (between ribs 4 & 5) just to the left of the sternum.
V3
Between leads V2 and V4.
V4
In the fifth intercostal space (between ribs 5 & 6) in the mid-clavicular line (the imaginary line that extends down from the
midpoint of the clavicle (collarbone).
V5
Horizontally even with V4, but in the anterior axillary line. (The anterior axillary line is the imaginary line that runs down from
the point midway between the middle of the clavicle and the lateral end of the clavicle; the lateral end of the collarbone is the
end closer to the arm.)
V6
Horizontally even with V4 and V5 in the midaxillary line. (The midaxillary line is the imaginary line that extends down from
the middle of the patient's armpit.)
Additional electrodes
The classical 12-lead ECG can be extended in a number of ways in an attempt to improve its sensitivity in detecting
myocardial infarction involving territories not normally "seen" well. This includes an rV4 lead which uses the
equivalent landmarks to the V4 but on the right side of the chest wall and extending the chest leads onto the back
with a V7, V8 and V9
Limb leads
In both the 5- and 12-lead configuration, leads I, II and III are called limb leads. The electrodes that form these
signals are located on the limbs—one on each arm and one on the left leg.[16] [17] [18] The limb leads form the points
of what is known as Einthoven's triangle.[19]
• Lead I is the voltage between the (positive) left arm (LA) electrode and right arm (RA) electrode:
• Lead II is the voltage between the (positive) left leg (LL) electrode and the right arm (RA) electrode:
• Lead III is the voltage between the (positive) left leg (LL) electrode and the left arm (LA) electrode:
Simplified electrocardiograph sensors designed for teaching purposes at e.g. high school level are generally limited
to three arm electrodes serving similar purposes. [20]
Unipolar vs. bipolar leads
There are two types of leads: unipolar and bipolar. Bipolar leads have one positive and one negative pole.[21] In a
12-lead ECG, the limb leads (I, II and III) are bipolar leads. Unipolar leads also have two poles, as a voltage is
measured; however, the negative pole is a composite pole (Wilson's central terminal) made up of signals from lots of
other electrodes.[22] In a 12-lead ECG, all leads besides the limb leads are unipolar (aVR, aVL, aVF, V1, V2, V3, V4,
V5, and V6).
Electrocardiography
Wilson's central terminal VW is produced by connecting the electrodes, RA; LA; and LL, together, via a simple
resistive network, to give an average potential across the body, which approximates the potential at infinity (i.e.
zero):
Augmented limb leads
Leads aVR, aVL, and aVF are augmented limb leads. They are derived from the same three electrodes as leads I, II,
and III. However, they view the heart from different angles (or vectors) because the negative electrode for these
leads is a modification of Wilson's central terminal. This zeroes out the negative electrode and allows the positive
electrode to become the "exploring electrode". This is possible because Einthoven's Law states that I + (−II) + III =
0. The equation can also be written I + III = II. It is written this way (instead of I − II + III = 0) because Einthoven
reversed the polarity of lead II in Einthoven's triangle, possibly because he liked to view upright QRS complexes.
Wilson's central terminal paved the way for the development of the augmented limb leads aVR, aVL, aVF and the
precordial leads V1, V2, V3, V4, V5 and V6.
• Lead augmented vector right (aVR) has the positive electrode (white) on the right arm. The negative electrode is
a combination of the left arm (black) electrode and the left leg (red) electrode, which "augments" the signal
strength of the positive electrode on the right arm:
• Lead augmented vector left (aVL) has the positive (black) electrode on the left arm. The negative electrode is a
combination of the right arm (white) electrode and the left leg (red) electrode, which "augments" the signal
strength of the positive electrode on the left arm:
• Lead augmented vector foot (aVF) has the positive (red) electrode on the left leg. The negative electrode is a
combination of the right arm (white) electrode and the left arm (black) electrode, which "augments" the signal of
the positive electrode on the left leg:
The augmented limb leads aVR, aVL, and aVF are amplified in this way because the signal is too small to be useful
when the negative electrode is Wilson's central terminal. Together with leads I, II, and III, augmented limb leads
aVR, aVL, and aVF form the basis of the hexaxial reference system, which is used to calculate the heart's electrical
axis in the frontal plane. The aVR, aVL, and aVF leads can also be represented using the I and II limb leads:
5
Electrocardiography
6
Precordial leads
The electrodes for the precordial leads (V1, V2, V3, V4, V5 and V6) are placed directly on the chest. Because of their
close proximity to the heart, they do not require augmentation. Wilson's central terminal is used for the negative
electrode, and these leads are considered to be unipolar (recall that Wilson's central terminal is the average of the
three limb leads. This approximates common, or average, potential over the body). The precordial leads view the
heart's electrical activity in the so-called horizontal plane. The heart's electrical axis in the horizontal plane is
referred to as the Z axis.
Waves and intervals
A typical ECG tracing of the cardiac cycle (heartbeat) consists of a P
wave, a QRS complex, a T wave, and a U wave which is normally
visible in 50 to 75% of ECGs.[23] The baseline voltage of the
electrocardiogram is known as the isoelectric line. Typically the
isoelectric line is measured as the portion of the tracing following the T
wave and preceding the next P wave.
Schematic representation of normal ECG
Animation of a normal ECG wave.
Electrocardiography
7
Detail of the QRS complex, showing ventricular
activation time (VAT) and amplitude.
Feature
Description
Duration
RR
interval
The interval between an R wave and the next R wave is the inverse of the heart rate. Normal resting heart rate is between
50 and 100 bpm
0.6 to 1.2s
P wave
During normal atrial depolarization, the main electrical vector is directed from the SA node towards the AV node, and
spreads from the right atrium to the left atrium. This turns into the P wave on the ECG.
80ms
PR
interval
The PR interval is measured from the beginning of the P wave to the beginning of the QRS complex. The PR interval
reflects the time the electrical impulse takes to travel from the sinus node through the AV node and entering the ventricles.
The PR interval is therefore a good estimate of AV node function.
120 to
200ms
PR
segment
The PR segment connects the P wave and the QRS complex. This coincides with the electrical conduction from the AV
50 to
node to the bundle of His to the bundle branches and then to the Purkinje Fibers. This electrical activity does not produce a 120ms
contraction directly and is merely traveling down towards the ventricles and this shows up flat on the ECG. The PR interval
is more clinically relevant.
QRS
complex
The QRS complex reflects the rapid depolarization of the right and left ventricles. They have a large muscle mass
compared to the atria and so the QRS complex usually has a much larger amplitude than the P-wave.
80 to
120ms
J-point
The point at which the QRS complex finishes and the ST segment begins. Used to measure the degree of ST elevation or
depression present.
N/A
ST
segment
The ST segment connects the QRS complex and the T wave. The ST segment represents the period when the ventricles are
depolarized. It is isoelectric.
80 to
120ms
T wave
The T wave represents the repolarization (or recovery) of the ventricles. The interval from the beginning of the QRS
complex to the apex of the T wave is referred to as the absolute refractory period. The last half of the T wave is referred to
as the relative refractory period (or vulnerable period).
160ms
ST
interval
The ST interval is measured from the J point to the end of the T wave.
320ms
Electrocardiography
QT
interval
The QT interval is measured from the beginning of the QRS complex to the end of the T wave. A prolonged QT interval is 300 to
a risk factor for ventricular tachyarrhythmias and sudden death. It varies with heart rate and for clinical relevance requires a 430ms
correction for this, giving the QTc.
U wave
The U wave is not always seen. It is typically low amplitude, and, by definition, follows the T wave.
There were originally four deflections, but after the mathematical correction for artifacts introduced by early
amplifiers, five deflections were discovered. Einthoven chose the letters P, Q, R, S, and T to identify the tracing
which was superimposed over the uncorrected labeled A, B, C, and D.[24]
Vectors and views
Interpretation of the ECG relies on the idea that different leads (by
which we mean the ECG leads I,II,III, aVR, aVL, aVF and the chest
leads) "view" the heart from different angles. This has two benefits.
Firstly, leads which are showing problems (for example ST segment
elevation) can be used to infer which region of the heart is affected.
Secondly, the overall direction of travel of the wave of depolarisation
can also be inferred which can reveal other problems. This is termed
the cardiac axis . Determination of the cardiac axis relies on the
concept of a vector which describes the motion of the depolarisation
wave. This vector can then be described in terms of its components in
relation to the direction of the lead considered. One component will be
in the direction of the lead and this will be revealed in the behaviour of
Graphic showing the relationship between
the QRS complex and one component will be at 90 degrees to this
positive electrodes, depolarization wavefronts (or
mean electrical vectors), and complexes
(which will not). Any net positive deflection of the QRS complex (i.e.
displayed on the ECG.
height of the R-wave minus depth of the S-wave) suggests that the
wave of depolarisation is spreading through the heart in a direction that
has some component (of the vector) in the same direction as the lead in question.
Axis
The heart's electrical axis refers to the general direction of the heart's
depolarization wavefront (or mean electrical vector) in the frontal
plane. With a healthy conducting system the cardiac axis is related to
where the major muscle bulk of the heart lies. Normally this is the left
ventricle with some contribution from the right ventricle. It is usually
Diagram showing how the polarity of the QRS
oriented in a right shoulder to left leg direction, which corresponds to
complex in leads I, II, and III can be used to
the left inferior quadrant of the hexaxial reference system, although
estimate the heart's electrical axis in the frontal
−30° to +90° is considered to be normal. If the left ventricle increases
plane.
its activity or bulk then there is said to be "left axis deviation" as the
axis swings round to the left beyond -30°, alternatively in conditions where the right ventricle is strained or
hypertrophied then the axis swings round beyond +90° and "right axis deviation" is said to exist. Disorders of the
conduction system of the heart can disturb the electrical axis without neccesarily reflecting changes in muscle bulk.
8
Electrocardiography
Normal
9
−30° to
90°
Normal
Normal
Left axis deviation −30° to
−90°
May indicate left anterior fascicular block or Q waves from
inferior MI.
Left axis deviation is considered normal in
pregnant women and those with emphysema.
Right axis
deviation
+90° to
+180°
May indicate left posterior fascicular block, Q waves from
high lateral MI, or a right ventricular strain pattern.
Right deviation is considered normal in children
and is a standard effect of dextrocardia.
Extreme right axis
deviation
+180° to
−90°
Is rare, and considered an 'electrical no-man's land'.
In the setting of right bundle branch block, right or left axis deviation may indicate bifascicular block.
Clinical lead groups
There are twelve leads in total, each recording the electrical activity of the heart from a different perspective, which
also correlate to different anatomical areas of the heart for the purpose of identifying acute coronary ischemia or
injury. Two leads that look at neighbouring anatomical areas of the heart are said to be contiguous (see color coded
chart). The relevance of this is in determining whether an abnormality on the ECG is likely to represent true disease
or a spurious finding.
Diagram showing the contiguous leads in the
same color
Category
Color on
chart
Leads
Activity
Inferior
leads
Yellow
Leads II, III
and aVF
Look at electrical activity from the vantage point of the inferior surface (diaphragmatic surface of heart).
Lateral
leads
Green
I, aVL, V5
and V6
Look at the electrical activity from the vantage point of the lateral wall of left ventricle.
•
•
The positive electrode for leads I and aVL should be located distally on the left arm and because of
which, leads I and aVL are sometimes referred to as the high lateral leads.
Because the positive electrodes for leads V5 and V6 are on the patient's chest, they are sometimes
referred to as the low lateral leads.
Septal leads Orange
V1 and V2
Look at electrical activity from the vantage point of the septal wall of the ventricles (interventricular
septum).
Anterior
leads
V3 and V4
Look at electrical activity from the vantage point of the anterior surface of the heart (sternocostal
surface of heart).
Blue
In addition, any two precordial leads that are next to one another are considered to be contiguous. For example, even
though V4 is an anterior lead and V5 is a lateral lead, they are contiguous because they are next to one another.
Lead aVR offers no specific view of the left ventricle. Rather, it views the inside of the endocardial wall to the
surface of the right atrium, from its perspective on the right shoulder.
Electrocardiography
10
Filter selection
Modern ECG monitors offer multiple filters for signal processing. The most common settings are monitor mode and
diagnostic mode. In monitor mode, the low frequency filter (also called the high-pass filter because signals above the
threshold are allowed to pass) is set at either 0.5 Hz or 1 Hz and the high frequency filter (also called the low-pass
filter because signals below the threshold are allowed to pass) is set at 40 Hz. This limits artifact for routine cardiac
rhythm monitoring. The high-pass filter helps reduce wandering baseline and the low-pass filter helps reduce 50 or
60 Hz power line noise (the power line network frequency differs between 50 and 60 Hz in different countries). In
diagnostic mode, the high-pass filter is set at 0.05 Hz, which allows accurate ST segments to be recorded. The
low-pass filter is set to 40, 100, or 150 Hz. Consequently, the monitor mode ECG display is more filtered than
diagnostic mode, because its passband is narrower.[25]
Some pathological entities which can be seen on the ECG
Shortened QT interval
Hypercalcemia, some drugs, certain genetic abnormalities.
Prolonged QT interval
Hypocalcemia, some drugs, certain genetic abnormalities.
Flattened or inverted T waves Coronary ischemia, left ventricular hypertrophy, digoxin effect, some drugs.
Hyperacute T waves
Possibly the first manifestation of acute myocardial infarction.
Prominent U waves
Hypokalemia.
Electrocardiogram heterogeneity
Electrocardiogram (ECG) heterogeneity is a measurement of the amount of variance between one ECG waveform
and the next. This heterogeneity can be measured by placing multiple ECG electrodes on the chest and by then
computing the variance in waveform morphology across the signals obtained from these electrodes. Recent research
suggests that ECG heterogeneity often precedes dangerous cardiac arrhythmias.
Future applications
In the future, implantable devices may be programmed to measure and track heterogeneity. These devices could
potentially help ward off arrhythmias by stimulating nerves such as the vagus nerve, by delivering drugs such as
beta-blockers, and if necessary, by defibrillating the heart.[26]
Equipment
Electrocardiogram machines have been reduced in size and cost over the years. Hand held versions are sold for $800
each. [27]
See also
•
•
•
•
•
•
•
•
•
Advanced cardiac life support (ACLS)
Angiogram
HEART scan
Ballistocardiograph
Bundle branch block
Cardiac cycle
Echocardiogram
Electrical conduction system of the heart
Electrocardiogram technician
Electrocardiography
•
•
•
•
•
•
•
•
•
•
•
•
Electroencephalography
Electrogastrogram
Electropalatograph
Electroretinography
Heart rate monitor
Holter monitor
Intrinsicoid deflection
Magnetic field imaging
Magnetocardiography
Myocardial infarction
Open ECG project
Treacherous technician syndrome
External links
• Electrocardiogram, EKG, or ECG [28] – Explanation of what an ECG is, who needs one, what to expect during
one, etc. Written by the National Heart Lung and Blood Institute (a division of the NIH)
• University of Maryland School of Medicine Emergency Medicine Interest Group [29] – Introduction to EKGs as
written by a medical student and a cardiologist
• ECG in 100 steps: Slideshow [30]
• ECG Lead Placement [31] – A teaching guide "designed for student nurses who know nothing at all about
Cardiology"
• ECGpedia: Course for interpretation of ECG [32]
• 12-lead ECG library [33]
• Simulation tool to demonstrate and study the relation between the electric activity of the heart and the ECG [34]
• Minnesota ECG Code [35]
• openECGproject - help develop an open ECG solution [36]
• EKG Review: Arrhythmias [37] – A guide to reading ECGs not written for a university biology (anatomy and
physiology) course.
References
[1] "ECG- simplified. Aswini Kumar M.D" (http:/ / pn. lifehugger. com/ doc/ 120/ ecg-100-steps). LifeHugger. . Retrieved 2010-02-11.
[2] Braunwald E. (Editor), Heart Disease: A Textbook of Cardiovascular Medicine, Fifth Edition, p. 108, Philadelphia, W.B. Saunders Co., 1997.
ISBN 0-7216-5666-8.
[3] "The clinical value of the ECG in noncardiac conditions." Chest 2004; 125(4): 1561-76. PMID 15078775
[4] "2005 American Heart Association Guidelines for Cardiopulmonary Resuscitation and Emergency Cardiovascular Care - Part 8: Stabilization
of the Patient With Acute Coronary Syndromes." Circulation 2005; 112: IV-89 - IV-110.
[5] Ronald M. Birse, rev. Patricia E. Knowlden (http:/ / 0-www. oxforddnb. com. innopac. up. ac. za:80/ view/ article/ 37794) Oxford Dictionary
of National Biography 2004 (Subscription required) - (original source is his biography written by his wife - Elizabeth Muirhead. Alexander
Muirhead 1848 - 1920. Oxford, Blackwell: privately printed 1926.)
[6] Burdon Sanderson J (1878). "Experimental results relating to the rhythmical and excitatory motions of the ventricle of the frog heart". Proc
Roy Soc Lond 27: 410–14. doi:10.1098/rspl.1878.0068.
[7] Waller AD (1887). "A demonstration on man of electromotive changes accompanying the heart's beat". J Physiol (Lond) 8: 229–34.
[8] "Einthoven's String Electrovanometer" (http:/ / www. pubmedcentral. nih. gov/ articlerender. fcgi?artid=2435435). Pubmedcentral.nih.gov.
1927-09-29. . Retrieved 2009-08-15.
[9] Einthoven W. Un nouveau galvanometre. Arch Neerl Sc Ex Nat 1901; 6:625
[10] Cooper J (1986). "Electrocardiography 100 years ago. Origins, pioneers, and contributors". N Engl J Med 315 (7): 461–4. PMID 3526152.
[11] Mark, Jonathan B. (1998). Atlas of cardiovascular monitoring. New York: Churchill Livingstone. ISBN 0443088918.
[12] See images of ECG electrodes here: http:/ / www. superboverseas. com/ show_product. asp?id=104 or here: http:/ / images. google. com/
images?q=ecg+ electrode& oe=UTF-8& rls=org. mozilla:en-US:official& client=firefox-a& um=1& ie=UTF-8& sa=N& tab=wi&
ei=IOEHSqCELp3ItgeY8_2HBw& oi=property_suggestions& resnum=0& ct=property-revision& cd=1)
11
Electrocardiography
[13] "lead_dia" (http:/ / library. med. utah. edu/ kw/ ecg/ ecg_outline/ Lesson1/ lead_dia. html). Library.med.utah.edu. . Retrieved 2009-08-15.
[14] http:/ / www. welchallyn. com/ documents/ Cardiopulmonary/ Electrocardiographs/ PC-Based%20Exercise%20Stress%20ECG/
poster_110807_pcexerecg. pdf
[15] (http:/ / www. scst. org. uk/ coleman/ resting. htm)
[16] "Univ. of Maryland School of Medicine Emergency Medicine Interest Group" (http:/ / davidge2. umaryland. edu/ ~emig/ ekgtu03. html).
Davidge2.umaryland.edu. . Retrieved 2009-08-15.
[17] "Limb Leads - ECG Lead Placement - Normal Function of the Heart - Cardiology Teaching Package - Practice Learning - Division of
Nursing - The University of Nottingham" (http:/ / www. nottingham. ac. uk/ nursing/ practice/ resources/ cardiology/ function/ limb_leads.
php). Nottingham.ac.uk. . Retrieved 2009-08-15.
[18] "Lesson 1: The Standard 12 Lead ECG" (http:/ / library. med. utah. edu/ kw/ ecg/ ecg_outline/ Lesson1/ index. html#orientation).
Library.med.utah.edu. . Retrieved 2009-08-15.
[19] http:/ / nobelprize. org/ medicine/ educational/ ecg/ images/ triangle. gif
[20] e.g. Pasco Pasport EKG Sensor PS-2111, Sciencescope ECG Sensor, etc.
[21] http:/ / academic. cuesta. edu/ fjohnson/ PowerPoint_PDF/ 12leadecg. pdf
[22] "Electrocardiogram Leads" (http:/ / www. cvphysiology. com/ Arrhythmias/ A013. htm). CV Physiology. 2007-03-26. . Retrieved
2009-08-15.
[23] Watch a movie by the National Heart Lung and Blood Institute explaining the connection between an ECG and the electricity in your heart
at this site http:/ / www. nhlbi. nih. gov/ health/ dci/ Diseases/ hhw/ hhw_electrical. html
[24] Hurst JW. Current Perspective: Naming of the Waves in the ECG, With a Brief Account of Their Genesis. Circulation. 1998;98:1937-1942.
http:/ / www. circ. ahajournals. org/ cgi/ content/ full/ 98/ 18/ 1937
[25] Mark JB "Atlas of Cardiovascular Monitoring." p. 130. New York: Churchill Livingstone, 1998. ISBN 0-443-08891-8.
[26] Verrier, Richard L. "Dynamic Tracking of ECG Heterogeneity to Estimate Risk of Life-threatening Arrhythmias." CIMIT Forum.
September 25, 2007.
[27] http:/ / www. economist. com/ specialreports/ displaystory. cfm?story_id=15879359
[28] http:/ / www. nhlbi. nih. gov/ health/ dci/ Diseases/ ekg/ ekg_what. html
[29] http:/ / davidge2. umaryland. edu/ ~emig/ ekgtu01. html
[30] http:/ / pn. lifehugger. com/ sites/ default/ files/ filefieldppts/ ECG_in_100_steps. ppt
[31] https:/ / www. nottingham. ac. uk/ nursing/ practice/ resources/ cardiology/ function/ placement_of_leads. php
[32] http:/ / en. ecgpedia. org
[33] http:/ / www. ecglibrary. com
[34] http:/ / www. ecgsim. org
[35] http:/ / www. epi. umn. edu/ ecg/
[36] http:/ / www. open-ecg-project. org/
[37] http:/ / www. gwc. maricopa. edu/ class/ bio202/ cyberheart/ ekgqzr0. htm
12
Article Sources and Contributors
Article Sources and Contributors
Electrocardiography Source: Contributors: 00110001, 168..., 5-HT8, 74s181, A bit iffy, A059970, ALargeElk, Acdx, Agateller,
Alansohn, Alejo2083, Alex.tan, Alison.philp, Amitrajpalanand, Anazem, Andre Engels, AndrewTJ31, Andthu, Appraiser, Arcadian, Arfgab, Armeria, Arx Fortis, Ashnard, Atom cz, BarryH,
Bensaccount, Biophysiscool, BladeRunner99, BlueAg09, Bobo192, Bogwhistle, Borgx, Brainiak4431, Brighterorange, Briséis, Bryan Derksen, CKlunck, Can't sleep, clown will eat me,
Canderson7, Capricorn42, Cardcop05, Cardsteam, Carlossuarez46, Cburnett, Celique, Chaldor, Chantoke, Chirality, Chwats, Cimiteducation, CliffC, Cmcnicoll, CubicStar, Curap, DHN, DJ1AM,
DRosenbach, Dabomb87, Damato, Dancter, Danielhanlon, Danjeffers, Dapeda, David Henderson, Dclapp, Dddeoliveira, Dean.jenkins, Debbe, Dger, Diberri, Dietzel65, Dnvrfantj,
DrMacrophage, Dream out loud, Drjnk, ERcheck, Edgar181, EdithStarling, Electrophys, Epbr123, Ephebi, Epinheiro, Ernstl, Espoo, Facts707, Fdixon, Fieldday-sunday, Flashpoint145, Fleester,
FrancoGG, Fvasconcellos, Gaius Cornelius, Gary King, Garybrimley, Gene Omission, Ghaly, Gidonb, Giftlite, Glenlarson, GoingThroughTheMotions, Grade4, Graham87, Grandia01,
GreatWhiteNortherner, GregorB, GunnarK, Guoshun2172, Guystout, Gwilz, HNE3, Haakon, Harland1, Hashar, Hede2000, HendrixEesti, Hongooi, Hu12, Hyjl, Iannigb, Imasleepviking,
Intercontinental, Ironiridis, Ixfd64, J Raghu, J-Kama-Ka-C, J. Spencer, J.delanoy, Jackryan, Jakeallenseo, Jeffq, Jeronimo, Jerry, Jfdwolff, JimVC3, Jkanters, Jkokavec, Jmarchn, Jmh649, Jmr30,
Jon.j.henry, JonSangster, Jpark4, Junglecat, KC Panchal, Karada, Karelj, Karen Johnson, Kcallen78, Kchishol1970, Kd4ttc, Kenkku, King Toadsworth, Kingishere, Kitb, Knutux, Kosebamse,
Koska98, Kpjas, Ksheka, Kyoko, Lbeben, LeaveSleaves, Lenborje, Lennert B, Leuko, Lilac Soul, Lisatwo, Lou Sander, Lošmi, Lugnuts, Luna Santin, M0rt, MER-C, MPD01605, MZMcBride,
Macaddct1984, Madhero88, Madskile, MarcoTolo, Marek69, Marinov84, Markus Kuhn, Mauler90, Mauvila, Maxis ftw, Medicellis, Mentifisto, Michael Devore, Mikael Häggström, Mike2vil,
Mikr18, Miss Pippa, MithrandirMage, Mmxx, Monobi, MoodyGroove, Mortice, Mr Apple89, Mr Bungle, MrDolomite, Mysid, Nathan Cole, Nawagaththegama, Nbauman, Ndkartik,
Nehrams2020, Nephlet, Nirvelli, Nk.sheridan, Nunh-huh, Oatmeal batman, Odje, OldakQuill, Omegatron, OnixWP, Owain.davies, Oysterguitarist, Ozaru, PRINCE 1983, Paolo.dL, Patxi lurra,
Peiter, Petersam, Ph.eyes, Philip Trueman, Piano non troppo, Pjacobi, Pmuean, Poli, Prakashvankina, Prodego, Rainwarrior, Ranveig, Razorflame, RelentlessRecusant, Remember the dot, Rich
Farmbrough, Richdiesal, Rjwilmsi, Roybb95, SM, Sadm88, Saintswithin, Sampo, SanderB, Sbmehta, Sceptre, Scottalter, Seth Ilys, Sh111496, Shai-kun, Shaun1045, Shawnc, Simpsons
contributor, SineWave, Sirkad, Ske, Snaxe920, Sonett72, Srvora, Stannered, Statkit1, Stevenfruitsmaak, Strait, Symane, Syvanen, TaintedMustard, The Anome, TheEgyptian, Theodore Kloba,
Thomas.Hedden, ThomasPusch, Tide rolls, Tmarkopolo, Toddst1, Tootenplop21, Toozdaygirl, Tresiden, Tri400, Twisp, Uruiamme, Vijaypinu9, Vipinhari, Visium, Vogey2002,
VolatileChemical, Vwozone, WLU, WWC, Walking Softly, Wavelength, Who123, WikHead, Wikquid, Wimt, Work permit, Wouterstomp, Xdaedalus, Yerpo, Yhevhe, Youdiil, Z0OMD, فشاک
لیقع, 548 anonymous edits
Image Sources, Licenses and Contributors
Image:12leadECG.jpg Source: License: Public Domain Contributors: Original uploader was MoodyGroove at en.wikipedia
Image:ECGcolor.svg Source: License: Public Domain Contributors: User:Madhero88
Image:Willem Einthoven ECG.jpg Source: License: Public Domain Contributors: Kychot, Patho
Image:ECG Paper v2.svg Source: License: Public Domain Contributors: User:Markus Kuhn, User:MoodyGroove,
User:Stannered
Image:Limb leads.svg Source: License: Public Domain Contributors: User:Twisp
Image:ECG 12derivations.png Source: License: GNU Free Documentation License Contributors: Ske at fr.wikipedia
Image:SinusRhythmLabels.svg Source: License: unknown Contributors: Created by Agateller (Anthony Atkielski),
converted to svg by atom.
Image:ECG principle slow.gif Source: License: GNU Free Documentation License Contributors: User:Kalumet
File:QRS complex.png Source: License: Public Domain Contributors: User:Mikael Häggström
Image:ECG Vector.svg Source: License: Creative Commons Attribution-Sharealike 2.5 Contributors: Rick Manning
Image:Rapid Axis Vector.svg Source: License: GNU Free Documentation License Contributors: User:Ironiridis
Image:Contiguous leads.svg Source: License: GNU Free Documentation License Contributors: Cburnett
License
Creative Commons Attribution-Share Alike 3.0 Unported
http:/ / creativecommons. org/ licenses/ by-sa/ 3. 0/
13