Summary of Doctoral thesis: Capital structure of tourism service enterprises in Hue City in the economic market
Bạn đang xem bản rút gọn của tài liệu. Xem và tải ngay bản đầy đủ của tài liệu tại đây (524.04 KB, 29 trang )
INTRODUTION
1. SIGNIFICANCE OF THE RESERCH
Tourism is an indispensable demand in the cultural and social life of the
world; is a hobby and an active leisure activity] of man. In economic terms, the
tourism sector is prioritized by the world's developing countries because of the
rapid growth of the sector, as well as the increasing contribution to GDP of each
country. According to the World Tourism and Travel Council's (WTTC) 2015
report, tourism and travel generated 284 million jobs, revenue of $ 7.2 trillion,
contributing nearly 9.8% to the GDP of global. In Vietnam in 2015, the tourism
and travel industry directly attracts 2.78 million jobs (accounting for 5.2% of
total employment), including indirect employment of 6.03 million, contributing
to direct and indirect GDP, respectively, 6.6% and 13.9% of GDP.
For Hue City, tourism is the most important economic sector, contributing
more than 50% of GDP in the past few years, as a key sector of the local
economic development strategy to become the "Tourism City" and having
competition with the" tourist spots "in the region and the world. Hue is a rare
tourist destination which has abundant natural and historical tourism resources
which are recognized by UNESCO. Over the past few years, the leaders of the
provincial and municipal levels have come up with many solutions to promote
domestic and foreign tourists, reflected in the number of tourists and tourism
revenue have increased steadily over the years. However, businesses involved in
tourism services are still quite young, expressed in numbers, but small
capitalization, business efficiency of enterprises in the industry is low, even
many enterprises lost many years continuously.
A number of studies on the capital structure of the tourism industry and
tourism business in the world have shown the relationship between financial
performance and capital structure such as: Li Peijie, Wang Xinsheng, said that
the Chinese travel industry is using equity, which limits the use of debt, resulting
in poor capital efficiency and the development of the tourism industry; Hotels in
Thailand use high debt ratio leading to very low financial efficiency
1
(Pattweekongka, 2014); Research on Sri Lankan hotels and restaurants found
evidence that low debt-to-equity ratios generated higher returns than firms with
high debt ratios (Ajanthan,2013).
Domestic capital structure studies also provide evidence that the irrational
capital structure negatively affects financial performance. As a result, does the
tourism business in Hue operate inefficiently resulting from the unreasonable
capital structure? For that reason, the author chose the subject "Capital structure
of tourism service enterprises in Hue City in the economic market" as a research
thesis.
1.1.
Objectives of the study
The overall objective is based on the fundamental theories of capital structure
and empirical research on capital structure and financial performance of the firm,
whereby the author develops and analyzes the relationship between capital structure
and financial performance. It then determines the optimal debt threshold for the
Tourism and travel companies (TTCs) of Hue City.
Specific goals include:
Measure the impact of capital structure on the financial performance.
Determine the optimal debt threshold to maximize corporate financial
performance.
Analysis of other factors affecting financial performance of TTCs Hue;
Proposing to build a reasonable capital structure for TTCs Hue,
contributing to improve the financial efficiency of enterprises.
Questions to answer:
TTCs Hue managers are interested in how capital structure is structured?
Does the capital structure affect the financial performance of the Hue
Tourism and Training Department? and in what direction?
Is there an optimal capital structure for TTCs Hue?
What policy implications are needed to restructure to improve the
financial performance of the business?
2
1.1.
Object and scope of the study
Research subjects include capital structure components, financial
efficiency, optimal capital structure and the relationship between capital structure
and financial efficiency of TTCs Hue
The study area is TTCs Hue for the period 2013-2016.
1.2.
Research data
Firstly, the primary data was collected in 2015 through a survey of 80
TTCs representatives in Hue to provide a basis for assessing and analyzing the
current situation of capital structure management. Participants are representatives
of enterprises including: director, deputy director, chief accountant, business
owner.
Secondly, the secondary data extracted from the financial statements of
144 TTCs Hue from 2013 to 2016 is taken from the Tax Office of Thua Thien
Hue Province.
1.3.
Research Methods
Qualitative research using questionnaire interviewing. The questionnaire
was based on the theory of capital structure, then interviewed and adjusted to
complete the questionnaire in line with the research objectives. The research
process is divided into two phases. The first phase was a survey on TTCs Hue.
The second stage, from the survey results, authorizes descriptive statistics to
reflect the structure of capital management, the manager's views on the capital
structure, the relationship between capital structure and financial efficiency.
Quantitative research methodology: Using a regression model to quantify
the correlation between capital structure and financial efficiency, determine the
optimal capital structure for TTCs Hue. In detail:
The use of regression data for the table includes: Pooled OLS regression,
FEM based regression approach, and regression based randomization (REM).
After choosing the regression method appropriate to the model, the author
conducts the model selection test and defect assessment test of the selected
model. In cases where the pattern of defects is violated by the regression
3
hypothesis, the author will proceed with the general linear regression (GLS) and
the GMM regression. The methods are implemented under the support of Stata
software 12.0.
1.4. New contributions of the thesis
After studying the empirical research at home and abroad about the capital
structure related to the topic. According to the author, the subject has the
following new points:
Firstly, through the survey and quantitative study of the factors affecting
the financial effectiveness, the thesis presents the current situation of
management of capital structure of Hue tourism business enterprises, the
relationship between the structure capital and financial efficiency.
Secondly, the quantitative study of the impact of debt ranges on the
financial performance of enterprises, which can determine the optimal capital
structure for TTCs Hue.
Thirdly, through the survey and verification results, the authors have come
up with specific solutions in line with the orientation of sustainable development
of the Hue tourism industry in the direction of improving financial efficiency and
improving service quality. travel of business and local.
1.5. The meaning of the thesis
Scientific significance: The results of the thesis provide empirical
evidence on the relationship between capital structure and financial efficiency, as
well as other factors affecting the financial effectiveness of TTCs Hue
stakeholders. In addition, the thesis also determines the optimal debt level at
which the financial performance of enterprises is highest.
Practical implication: The results of the study are useful for providing
solutions for TTCs Hue developers to better manage their capital structure to
improve financial efficiency. In addition, relevant stakeholders such as banks and
policy makers can refer to supporting Hue enterprises in raising capital as well as
improving the quality of tourism services.
1.6. The structure of the thesis
4
Apart from the introduction, the list of tables, the list of figures, the list of
abbreviations, conclusions, appendices, reference documents, the subject consists
of 3 chapters as follows:
CHAPTER 1: THEORY OF CORPORATE STRUCTURE AND
BUSINESS ECONOMY
CHAPTER 2. CAPITAL STRUCTURE OF THE ENTERPRISES OF
TOURISM SERVICES IN HUE
CHAPTER 3. CAPITAL RESTRICTION SOLUTIONS FOR HUE
TOURIST SERVICES IN THE ECONOMIC MARKET.
CHAPTER 1: THEORY OF CORPORATE STRUCTURE AND
BUSINESS ECONOMY
1.1. Theoretical foundation on corporate capital structure, financial
efficiency
Chapter 1 presents an overview of the basic theories of capital structure
and the relationship of capital structure to corporate financial performance.
Background theory is designed to explain the relationship between capital
structure and financial performance.
1.2. The relationship between capital structure and financial performance,
optimal capital structure and empirical research.
The goal of a manager is to build a capital structure to maximize the value
of the business, or achieve the highest financial performance. Consequently,
executives are always looking for an optimal capital structure that minimizes
financial costs and increases the value of the business.
Domestic and foreign empirical research on the relationship between
structure and financial performance has shown that there is a link between capital
structure and financial performance depending on the sample but for other
impacts. together. The study of optimal capital structure also provides an optimal
level of debt for businesses. But no research is done in the tourism industry.
5
Empirical research is used primarily and applies specific quantitative
methods such as correlational analysis, multivariate linear regression analysis
with panel data in combination with appropriate tests. Financial reporting is the
main source of data for identifying financial indicators in the empirical model of
previous empirical studies. Local studies have included empirical analysis of
quantitative factors affecting financial performance that have little association
with simultaneous analysis of qualitative factors. Quantitative analyzes can
produce very specific and detailed results in terms of impact and impact on
corporate financial performance, but focusing on that will not clearly identify the
nature and This causes the effect
1.3. Discussion and evaluation
Thus, based on previous models of financial performance and capital
structure, the author proposes a research model that inherits some of the earlier
ideas, while complementing and perfecting the causal analysis. The relationship
between financial efficiency and capital structure, the optimal capital structure of
TTCs Hue.
CHAPTER 2. CAPITAL STRUCTURE OF THE ENTERPRISES OF
TOURISM SERVICES IN HUE
2.1. Concept of tourism and travel services
Tran Nhan defines tourism as the process of human activity leaving the
homeland to another place with the main purpose being the recognition of
material values, unique spirituality, unique, different from the homeland, not for
profit purposes. (Nguyen Ba Lan, 2007)
Under Chapter V of the Tourism Act 2017, the tourism business line
covers the following 4 industries:
+ Business travel
+ Trading in tourist accommodation establishments
+ Business travel tourists
+ Trading in other tourist services
2.2. Situation of tourism development in Vietnam and Hue city.
6
In the period from 2005 to 2016, the Party and State have oriented to
develop tourism into a spearhead economic growth. Since then, the tourism
sector has seen strong development in the number of domestic and foreign
visitors; the role of tourism in the GDP structure is high; and the quality of
tourism is improving and improving. The role of the tourism industry is reflected
in the increasing contribution of GDP, in 2005 this figure is 6.74%, from 2009 to
2016 on average contributes to the GDP of the country is 10%.
Hue's tourism industry has grown rapidly in recent years, showing the
great potential. In 2016, tourism contribution accounted for 50% of GDP of the
whole province has shown the importance of the sector for the common
economic development.
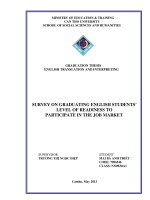
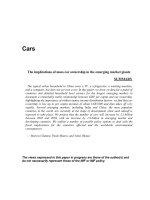
2.3. The financial efficiency of TTCs Hue.
Figure 2.1. ROA and ROE ratios of TTCs Hue
Source: calculated by the author
In the period 2013-2016, the average ROA and ROE of the 144 TTCs in
Hue are 2.71% and 1.74%, respectively. This figure tells us that for every 100
dongs of corporate assets, the company has collected 2.71 dong of after tax
profit, 100 dong of which it collected 1.74 dong. This shows that the financial
7
performance of Hue enterprises is relatively low compared to the tourism
industry listed on the stock market (ROA is 5.11% in 2009-2015 period, Le
Thanh Ngoc et al. , 2017). Figure 2.1 shows that the number of enterprises with
ROA and ROE> 0 is 73.61% of businesses in the year, the number of negative
financial performance decreases by 2014 but starts to increase in 2015 and 2016.
Figure 2.1 ROA and ROE have been decreasing over the years, from ROA and
ROE of 3.09% and 1.77%, respectively, to 2.98% and 1.62% in 2016
respectively.
The reasons for the financial effects of tourism in Hue and Viet Nam are
low:
First, the competition between tourism enterprises is becoming more
fierce so the situation "dumping" to attract customers. Therefore, the profit
margin of enterprises decreased, so although the turnover has increased, but
profit is not recovered (Dao Loan, 2016), Mai Phuong (2013). for enterprises in
hue, the enterprises devalue tours and hotel room rates to attract customers,
especially for small businesses making large-scale businesses more difficult.
Customers of Hue market are popular objects, spending per client is not high so
the strategy of reducing the price achieved the effect of attracting customers, but
reducing the profit margin of the business.
Second, traditional tourism enterprises are suffering from fierce
competition, without any breakthrough in quality of service or products.
Meanwhile, businesses with financial potential and large scale investment in
diversifying products and services such as hotels, restaurants, events; Real estate
investment will generate higher profit margin (Kieu Linh, 2017). The situation
shows that the characteristics of Hue small and medium enterprises are low level
of management, therefore, they face many difficulties in capital and strategy of
expanding services or investment. In addition, travel companies and Hue hotel
must do satellite service for large enterprises should share profits. For example,
the tour operator cannot afford to organize a package tour but only accept a part
of the tour.
8
2.4. The existing capital structure of the TTCs Hue.
Through the survey of the TTCs Hue enterprises, some problems exist
capital structure as follows:
Firstly, the owner is the principal decision maker in the capital structure
because most of the medium and small sized enterprises are also the owners of
the enterprise. 49% of enterprises use equity and 33% use debt, indicating that
the business does not follow the classification theory. The situation shows that
the average financial performance of Hue Enterprises is very low so the retained
earnings are not enough to finance new investment, so the enterprise must use
other resources. For financing options as equity, management believes that the
advantage is that the enterprise guarantees financial autonomy and is not under
pressure to repay. The advantage of using a loan is the low cost of capital, the
benefit of the tax shield, the sharing of control over the business and the increase
in return on equity. Thus, managers can understand the advantages and
disadvantages of each source of funding so the rate of using equity is much
higher than debt.
Second, for the optimal capital structure or capital structure, the business
owner is based on actual experience to decide. In practice and empirical research
in Vietnam, there are few works on optimal capital structure. Therefore, it is
difficult for enterprise owners to set reasonable debt levels for enterprises. The
debt-to-equity ratio was less than 50%, equivalent to 33.33% of total debt. The
management also believes that the target capital structure needs to be developed
because of the advantages of financial risk mitigation and low cost of capital.
Third, the correlation between capital structure and financial performance
is very clear when 76.81% of business executives think that the financial
efficiency factor has an impact on capital structure and factors. The executive's
capacity is only 36.23% of the choice.
2.5. Analyzing the impact of factors affecting the financial efficiency of Hue
Enterprises.
2.5.1. Research data.
9
The research data includes 170 enterprises in the field of tourism services
with clear financial data from 2013 to 2016. The classification of enterprises in
the tourism sector is carried out by the Taxation Department of Thua Thien Hue
Province. The author examines the field of activity. After eliminating enterprises
with different data and failing to meet the research data standards, the number of
enterprises selected for the study was 144.
2.5.2.
Model estimation methods.
Topics used data analysis techniques table data with the model as follows:
Yit = C +
With i, t
X1it + β2X2it + …+ βnXnit + uit
N*
In which:
Yit is dependent variable with i: entity (ENTERPRISE), and t is the time
(year)
X1it,…, Xnit is the value of the independent variable representing the
factors that affect the capital structure of the firm i at period t.
Uit is the remainder.
The dissertation uses methods of running OLS, FEM, REM, GLS, and
GMM models, and then compares the results of the models to the most
appropriate model.
2.5.3. Mô hình kiểm định.
The thesis gives a general model of the impact of capital structure and
other factors on financial performance as follows:
The dissertation uses the ROA and ROE variables as a measure of
financial performance. The six independent variables are: Total Debt to Total
Assets (DA), Long-Term Asset (TSDH), Enterprise Size (SIZE), growth rate
(GROW), UNI (corporate property) and GDP (GDP).
Model 1: ROEit = C0 + β1DAit +β2TSDHit + β3SIZEit + β4GROWit +
β5UNIit + β6GDP it + uit.
(2.1)
10
Model 2: ROAit = C0 + β1DAit +β2TSDHit + β3SIZEit + β4GROWit +
β5UNIit + β6GDP it + uit.
(2.2)
Nonlinear model of debt threshold test:
To determine the optimal capital structure, the proposed nonlinear model
of capital structure has the following effect on financial performance::
Model 3: ROEit = C0 + β1DAit β2DA2 it +β3TSDHit + β4SIZEit + β5GROWit
+ β6UNIit + β7GDP it + uit.
(2.3)
Model 4: ROAit = C0 + β1DAit β2DA2 it +β3TSDHit + β4SIZE it + β5 GROWit
+ β6UNIit + β7GDP it + uit.
(2.4)
Study hypothesis:
H1: Capital structure is related to financial efficiency.
H2: Asset structure has a negative relationship with financial
performance.
H3: The size of the business has a positive relationship with financial
performance.
H4: Growth opportunities have a positive relationship with financial
performance.
H5: Business characteristics have a negative relationship with financial
performance.
H6: GDP growth has a positive impact on the financial performance of
enterprises.
Table 2.1. A combination of factors affecting the financial
performance of the enterprise.
Independent
variables
Effect
Author
Humphrey Motanya; Divya Aggarwal; Padhan;
Total debt
+
Tran Hung Son and Tran Viet Hoang; Maryam
Ahani ; Nguyen Thanh Cuong
-
Youn và Gu; Zeitun & Tian; Ahmad; Abdullah và
11
Roslan; Mwangi, Makau & Kosimbei; Luís Pacheco
và Fernando Tavares; Woo Gon Kim; A.Ajanthan;
Simona; Chu Thi Thuy Thuy and et;
NA
Nguyen Van Thang, Le Van Thach
Divya Aggarwal; Purna Chandra Padhanm; Yoon
+
và Jang; Zeitun & Tian; Ahmad; Abdullah và
Roslan; Master Thesis; Doan Ngoc Phi Anh
Size
NA
+
Grow
Tran Hung Son and Tran Viet Hoang; Ahmad;
Abdullah và Roslan; Mwangi, Makau & Kosimbei.
Ahmad; Abdullah và Roslan
NA
+
Liquidation
Simona; Chu Thi Thu Thuy and et
-
Divya Aggarwal; Purna Chandra Padhan; Trần
Hùng Sơn và Trần Viết Hoàng; Master Thesis
Divya Aggarwal; Purna Chandra Padhan; Mwangi,
Makau & Kosimbei
Simona; Chu Thị Thuy Thủy và cộng sự
NA
+
Risks
Tax
NA
Zeitun & Tian
+
Zeitun & Tian
NA
Tangibility
Divya Agarwal, Purna Chandra Padhan
Hyewon Youn và Zheng Gu
+
Master Thesis
-
Humphrey Motanya; Zeitun & Tian
NA
Long term
+
debt
-
Divya Aggarwal, Purna Chandra Padhan; Simona
Ahmad; Abdullah và Roslan
12
NA
Short term
debt
+
Zeitun & Tian
-
Ahmad; Abdullah và Roslan
NA
+
-
Time
NA
+
Master Thesis
Divya Aggarwal; Purna Chandra Padhan; Mwangi,
Makau & Kosimbei
GDP
NA
+
Unique
NA
Zeitun & Tian
Table 2.2. A combination of factors affecting the financial performance
of the enterprise
Independent Variables
Calculation
Effect
DA
Total debt/Total asset
+/-
TSDH
Long term asset/ Total asset
-
SIZE
Logarithm Total asset
+
GROW
(Asset year t – Asset year t-1)/ Asset
year t-1
+
UNI
Cost of goods sold / Net sales
-
GDP
Growth of GDP
+
2.6. Results of the research model analysis
2.6.1. Statistics describe the variables in the model
Table 2.3 presents the descriptive statistics of the TTCs Hue collected
from the balance sheet and the business results report from 2013 to 2016, the
total observation is 576, the results show.
13
Bảng 2.3. Statistics describe the variables
Variables Obs
Mean
Standard deviation
Min
Max
DA
576
0.1726
0.2482
0.0000
0.9789
ROA
576
0.0281
0.0732
-0.1686
0.5923
ROE
576
0.0174
0.1164
-0.9724
0.6400
UNI
576
0.8067
0.2618
0.0000
2.3198
TSDH
576
0.4668
0.3807
0.0000
0.9981
GROW
576
0.0802
0.3123
-0.9132
3.7435
SIZE
576
6.4411
0.7374
4.8444
9.6358
GDP
576
0.0607
0.0045
0.0542
0.0668
Source: Thua Thien Hue Provincial Taxation Department, and author's
calculations
2.6.2. Correlation analysis
To test multi-collinearity between variables, the study used a correlation
matrix between the explanatory variables in the model.
Table 2.4: Self-correlation matrix between model variables
Variables ROE
ROE
ROA
DA
UNI
TSDH
SIZE
GROW
GDP
ROA
DA
UNI
TSDH
SIZE
1
0.7809
1
-0.4719 -0.2600
1
-0.0634 -0.0813
0.11
1
-0.4066 -0.4402 0.3587 0.0601
1
-0.4115 -0.3407 0.5278 0.1314 0.5586
1
0.1463 0.1861 0.0956 -0.0552 -0.092 -0.0127
0.0544 0.0812 0.0384 -0.0339 -0.0106 0.0218
Source: Author's calculations by software Stata 12.0
GROW GDP
1
0.0085
From Table 2.4, all variables have a correlation less than 0.7, so there is
no hyperbolic multiplication in the model.
Consider the correlation between ROA and ROE dependent variables with
independent variables:
The coefficients with the highest correlation coefficient reflecting the
correlation with the financial performance are DA (-0.4719), SIZE (-0.4115) and
TSDH (-0.4066). The rest of the correlation coefficients are less clear, but
generally the coefficients of the independent and dependent variables are
different, indicating that these factors affect financial performance.
14
1
The positive correlation coefficient r shows the positive relationship between
the dependent variable and the independent variable. In contrast, if negative, it implies
the opposite relationship between the dependent variable and the independent
variable.
Positive relationship with ROA and ROE: asset growth and GDP.
Reverse-ROA and ROE: Debt ratio, asset structure, enterprise size, and
business characteristics.
Check the multi-collinear phenomenon
In order to detect multi-collinearity in the model, the author uses the
Variance Inflation Factor (VIF). There are many different proposals for the value
of VIF, but the most common is 5, whereby the maximum level of VIF that
exceeds that value can cause multi-collinearity (Rogerson, 2001). Looking at the
regression coefficient of the model, the VIF of the variables <5 should not have
the phenomenon of multi-collinearity occurring between the variables in the
model.
Table 2.9. Multi-collinear phenomenon test results
Variables
ROE
ROA
VIF
1/VIF
VIF
1/VIF
DA
1.43
0.560437
1.43
0.699964
GROW
1.03
0.968525
1.03
0.968525
TSDH
1.49
0.672138
1.49
0.672138
SIZE
1.78
0.560437
1.78
0.560437
UNI
1.03
0.974610
1.03
0.974610
GDP
1.00
0.996045
1.00
0.996045
Mean
1.29
1.29
(*, **, ***: significant at 10%, 5%, 1%)
Source: calculation results of authors under STATA 12.0 program
The results show that the VIF coefficients of the variables are less than 5, so
there is no hyperbolicity between variables in the model..
2.6.3. Regression results
15
In this section, the subject will in turn approach the verification model
and analyze the table data. The first is a combined regression model with the
assumption that all regression coefficients do not change over time and the
crossovers (ENTERPRISE). The regression results are shown in the table below.
Table 2.10. Results of regression model depend on ROE
Model
Variables
DA
OLS
FEM
REM
GLS
GMM
-0.1694
-0.2890
-0.1694
-0.2692
-0.2029
(0.001)*** (0.000)***
(0.000)*** (0.000)*** (0.000)***
0.0062
-0.0087
0.0062
-0.0646
-0.0400
UNI
(0.686)
(0.688) (0.002)***
(0.021)**
(0.334)
-0.0614
-0.0587
-0.0614
-0.0702
-0.0685
TSDH
(0.0000)***
(0.027)**
(0.000)*** (0.000)*** (0.000)***
-0.0173
0.0046
-0.0173
0.1430
0.0023
SIZE
(0.016)**
(0.570)
(0.017)** (0.000)***
(0.837)
0.0600
0.0465
0.0600
0.0167
0.0356
GROW
(0.000)***
(0.085)* (0.0000)*** (0.0000)*** (0.0000)***
1.7353
1.4842
1.7353
1.2554
1.6531
(0.049)** (0.001)***
GDP
(0.051)*
(0.020)**
(0.020)**
-0.0015
0.0717
-0.0221
0.0717
-0.8504
CONS
(0.984)
(0.297)
(0.705)
(0.300) (0.000)***
576
576
N
576
576
576
R-Square
0.3238
0.1780
0.1344
Prob>F
0.0000
0.0000
0.0000
MODEL SELECTION CHOICE
F-test
0.0000
Hausman test
0.0079
CHECKS FOR DISABILITY MODELS
Prob>chi2=0.0000: There is variation in the
Variability
phenomenon of variance
Prob>F=0.0000: There is a self-correlation
Self-correlation
phenomenon
GMM Test
0.712
AR2
0.072
Hansen test
(*, **, ***: significant at 10%, 5%, 1%)
Source: calculation results of authors under STATA 12.0 program
Table 2.11. Endogenous test results with dependent variable ROE
16
Variables
P_Value
Endogenous phenomena
DA
0.0047
There are endogenous phenomena
UNI
0.1318
There is no endogenous phenomenon
TSDH
0.3111
There is no endogenous phenomenon
GROW
0.2981
There is no endogenous phenomenon
SIZE
0.0453
There are endogenous phenomena
GDP
0.7433
There is no endogenous phenomenon
Note: Verify Durbin - Wu - Hausman (P_value), significance level to
reject or accept hypothesis Ho: variable tool is exogenous is 5%
Bảng 2.12. Kết quả hồi quy mô hình biến phụ thuộc ROA
Mô hình
Biến
DA
GLS
GMM
OLS
FEM
REM
-0.0314
-0.1937
-0.0314
-0.1501
-0.0899
(0.014)**
(0.000)***
(0.015)** (0.000)***
(0.000)***
-0.0070
-0.0102
-0.0070
-0.0345
-0.0297
UNI
(0.498)
(0.492) (0.004)***
(0.006)***
(0.067)*
-0.0636
-0.0540
-0.0636
-0.0325
-0.0534
TSDH
(0.000)***
(0.000)***
(0.0000)***
(0.077)** (0.000)***
-0.0095
0.0169
-0.0095
0.0981
0.0075
SIZE
(0.047)**
(0.001)***
(0.049)** (0.000)***
(0.325)
0.0380
0.0334
0.0380
0.0099
0.0210
GROW
(0.000)***
(0.080)* (0.0000)*** (0.0000)*** (0.0000)***
1.3168
1.4046
GDP
1.3168
1.1754
1.3544
(0.024)**
(0.000)***
(0.026)**
(0.000)** (0.000)***
-0.0397
0.0472
-0.1019
0.0472
-0.6073
CONS
(0.424)
(0.300)
(0.005)***
(0.304) (0.000)***
576
576
N
576
576
576
R-Square
0.2451
0.1948
0.1360
Prob>F
0.0000
0.0000
0.0000
MODEL SELECTION CHOICE
F-test
0.0000
Hausman test
0.0000
KIỂM ĐỊNH KHUYẾT TẬT MÔ HÌNH
Phương sai thay đổi
Prob>chi2=0.0000: Có hiện tượng phương sai thay đổi
Tự tương quan
Prob>F=0.0006: Có hiện tượng tự tương quan
GMM TEST
0.222
AR2
17
0.750
Hansen test
(*, **, ***: significant at 10%, 5%, 1%)
Source: calculation results of authors under STATA 12.0 program
Table 2.13. Endogenous test results with ROA dependent variables
Variables
P_Value
Endogenous phenomena
DA
0.0000
There are endogenous phenomena
UNI
0.5972
There is no endogenous phenomenon
TSDH
0.8908
There is no endogenous phenomenon
GROW
0.0556
There is no endogenous phenomenon
SIZE
0.0482
There are endogenous phenomena
GDP
0.5463
There is no endogenous phenomenon
Note: Verify Durbin - Wu - Hausman (P_value), significance level to
reject or accept hypothesis Ho: variable tool is exogenous is 5%
From Table 2.10, 2.11, 2.12 and 2.13, OLS, FEM, REM, GLS, GMM and
model selection tests. The following results:
- Based on the results of F test, there are: For both models give value
Prob> F = 0.0000 <α (α = 5%): Hypothesis H0 is rejected: FEM will be more
suitable than Pooled OLS.
Based on Hausman test results, there are: Model with dependent variable
ROE: Prob> F = 0.0079 <α (α = 5%): Hypothesis H0 rejected: FEM will be more
suitable than REM.
Model with dependent variable ROA: Prob> chi2 = 0.0000 <α (α = 5%):
Hypothesis H0 rejected: FEM model is more suitable than REM.
- Based on the results of the defect verification of the model: The model
has the variance of the variance and self-correlation phenomena and the thesis
will be regressed by the GLS method to overcome these defects. However,
according to the author, the models in this thesis show signs of endogenous
phenomena with some independent variables having two-way relations with
dependent variables.
18
Based on the results of empirical research on endogenous phenomena for
variables in both ROE and ROA models: With a significance level of 5%: DA
and SIZE variables: endogenous phenomena (Table 2.11). and Table 2.13).
Therefore, the final results of the thesis depend on the results by the GMM
method. A summary of the factors influencing financial performance was
synthesized under the GMM method for both models with the ROE and ROA
variables as follows:
Table 2.14. Synthesis of regression results of GMM method
Variables
Hypothesis
DA
Dependent variable
ROA
ROE
+/-
-0.1937***
-0.2890***
TSDH
-
-0.0540***
-0.0587***
SIZE
+
0.0169***
GROW
+
0.0334***
UNI
-
-0.0102*
GDP
+
1.4046***
1.4842***
AR2
0.222
0.712
Hansen test
0.750
0.072
0.0465***
Source: Author's summary
The GMM test results in Table 2.14 show that:
The AR2 and Hansen tests can conclude that the regression results of the
GMM model are valid. As follows:
Hypothesis: "Capital structure has an impact on financial performance".
The regression coefficients for ROE and ROA were -0.2890 and -0.1937,
respectively. It points out that: The debt ratio has the opposite effect on financial
performance. This means: If other factors are constant and the debt ratio
increases by 1%, the financial performance will decrease by -0.2890% with ROE
and -0.1937% ROA and vice versa. In addition, the coefficient of the DA for all
19
regression methods yields the same result: DA negatively impacts financial
performance and is highly reliable.
The resulting capital structure has the opposite effect on financial
performance in line with previous studies in the tourism industry such as: Youn
and Gu (2010); Woo Gon Kim (1997); Luis Pacheco (2015); Ajanthan (2013).
This is consistent with the medium and small tourism business as the more
efficient the financial enterprise will prioritize the use of retained earnings as per
the classification theory. In contrast, Woo Gon Kim believes that low-performing
businesses will not have enough financing resources, so it is imperative to
borrow more, which is true for large scale tourism enterprises, must invest in
assets. many fixed.
Assumption: "Asset structure has the opposite effect on financial
efficiency".
The regression coefficient of the TSDH variable yielded -0.0587 with
ROE and -0.0540 with ROA. It shows that: The share of assets has the opposite
effect on financial performance and has a significance level of 1%. This means
that if the other factors are constant and when the proportion of tangible fixed
assets increases by 1%, the financial performance will decrease -0.0587% with
ROE and -0.0540% with ROA and vice versa. In addition, the regression
coefficient of the TSDH variable for all methods yields the same result: TSDH
has the opposite effect of financial efficiency and is highly reliable.
This result is consistent with the study by Motanya (2016) that the
tourism business investment in fixed assets is large, the financial efficiency
decreased. The status of traditional customers in Hue is low visitor spending, and
the lack of high-income customers with leisure and entertainment needs. Hence,
large hotel-owned hotels and restaurants have difficulty in doing business
because of lack of suitable customers.
Hypothesis: "Asset growth has a positive impact on financial
performance."
20
The regression coefficient of the GROW variable has an effect on ROE
and ROA of 0.0465 and 0.0334. It shows that asset growth has the same impact
on financial performance and a significant 1%. What this means is: If other
factors are constant and the total assets increase by 1%, the financial performance
will increase by 0.0465% (ROE) and 0.0334% (ROA) and vice versa. In addition,
the regression coefficient of the GROW variable for all methods gives the same
result: GROW works in the same direction as financial performance and is highly
reliable.
The current status of tourism business mentioned in Chapter 2 is
consistent with the results of the growth of the enterprise to increase financial
efficiency. Businesses expanding their products and services will increase profit
margins and financial performance.
Hypothesis: "GDP growth has a positive impact on financial
performance."
The regression coefficients of GDP variances are 1.4842 (ROE) and
1.4046 (ROA). It shows that GDP has the same impact on financial performance
and has a 1% significance level. What this means is: If the other factors are
constant and when the GPD increases by 1%, the financial performance will
increase by 1.4842% (ROE) and 1.4046% (ROA) and vice versa. In addition, the
regression coefficients of GDP for all methods give the same result: GDP has the
same effect on financial performance and is highly reliable. Conclusion is in line
with Diyya Aggarwal (2016), in the context of stable economic development,
people's income improved, so the demand for entertainment and convalescence
increased. Hence, revenue and financial performance of tourism enterprises
increased.
Hypothesis: "Business characteristics have the opposite effect on financial
performance".
The regression coefficient of the UNI variable is not statistically
significant with respect to ROE, but results in a ROA of -0.0102. It shows that
the ratio of COGS to revenue has the opposite effect on financial efficiency and
21
significance of 10%. This means: If the other factors are constant and when the
UNI increases by 1%, the financial performance will decrease by -0.0102% and
vice versa.
Youn and Gu (2010) argue that TRAVEL ENTERPRISES should reduce
operating costs, sales and marketing costs to increase margins. Hue tourism
enterprises have a small scale, so the management and control costs are limited,
causing losses.
Hypothesis: "Enterprise size has a positive impact on financial
performance".
The regression coefficient of the SIZE variable was not statistically
significant with respect to the ROE variable, but resulted in a ROA variable of
0.0169. It shows that: SIZE has the same impact on financial performance and
has a significance level of 1%. This means that if other factors are constant and
the total asset value increases by 1%, the financial performance will increase by
0.0169% and vice versa.
Regression results with two models of ROA and ROE dependent
variables can conclude that variables are positively correlated with financial
performance: GROW and GDP. The variables that have the opposite relationship
are: DA and TSDH. Two SIZE and UNI variables were not statistically
significant for ROE but significant for ROA variables.
Summarize the results of the study of factors affecting business
performance and compare with the assumptions made initially.
Table 2.15. Comparative hypothesis and research results
Variables
Hypothesis
ROA
ROE
DA
+/-
-
-
TSDH
-
-
-
SIZE
+
+
GROW
+
+
UNI
-
-
22
+
GDP
+
+
+
Table 2.15 shows that the relationship between factors influencing
financial performance is similar to the initial assumption. In particular, the capital
structure has the opposite effect on capital structure. To further assess the impact
of capital structure on financial performance by debt range as well as to find the
optimal capital structure for Hue VDD Enterprises, the topic is to continue
regression model 3 and 4.
Results of a non-linear relationship between capital structure and financial
performance.
Table 2.16. Results of regression model 3 and model 4
Dependent variable
ROA
Independent variable
DA
ROE
-0.0245
(0.868)
-0.0311
(0.856)
-0.0181
(0.005)***
-0.0624
(0.0000)***
-0.0063
(0.054)**
0.0220
(0.0000)***
1.154
(0.0000)***
0.048
(0.083)*
576
1.3429
(0.0000)***
-1.8692
DA2
(0.0000)***
-0.0486
UNI
(0.0000)***
-0.1325
TANG
(0.263)
-0.0261
SIZE
(0.0000)***
0.0281
GROW
(0.0003)***
0.3548
GDP
(0.557)
0.2018
CONS
(0.0000)***
576
N
AR (2) test (Pr > z)
0.140
0.463
Sargan test
0.000
0.247
(*, **, ***: significant at 10%, 5%, 1%)
Source: calculation results of authors under STATA 12.0 program
Table 2.17. Regression results by threshold
23
Threshold
Varibales
DA
0%-
DA> 35,92%.
0.0962**
-0.6148***
-0.0100
-0.0048
TSDH
-0.0706***
-0.2097***
SIZE
-0.0169**
0.0076
GROW
0.0633***
0.0497*
GDP
1.7912**
0.8407
0.0642
0.3427*
UNI
_CONs
(*, **, ***: significant at 10%, 5%, 1%)
Source: calculation results of authors under STATA 12.0 program
When the debt-to-value ratio of the firm was below 35.92%, its value
was 0.0962 with a 5% significance, indicating that the corporate financial
performance would increase by 0.0962% as the debt ratio increased by 1%.
When the debt-to-value ratio exceeded 35.92%, the DA's value was 0.6148 with a 1% significance level, indicating a 1% increase in the debt ratio
would reduce corporate financial performance - 0.6148%.
2.6.4. Discuss the research results
After examining the defects of the models, the author analyzes some of
the following statements about the capital structure of the Hue Enterprises, as
follows:
Analytical
model of factors
influencing corporate
financial
performance:
The results of the GMM model show that the four factors that affect the
financial performance of Hue TTCs are debt ratio, asset growth (GROW), asset
structure (TSDH) and GDP.
The empirical results show that: The regression coefficient of the ROE
model was -0.2890 and statistically significant at 1%, and in the ROA model was
-0.1937 with a 1% significance. That means that if the firm increases its debt
ratio, it will reduce its financial performance. Research by Le Thanh Ngoc et al.
24
(2017) on the sample of tourism joint stock companies listed on the stock market
in Vietnam also gave similar results (when the debt ratio decreased -0.6050%, the
ROA increased by 1 %).
In addition, non-linear regression results have identified a debt threshold
for Hue TTCs of 35.92%. Enterprises should use debt lower than this threshold
because regression results show that the capital structure has a positive impact on
corporate financial performance. In cases where debtors are above optimal levels,
debt reduction should be used to increase financial efficiency. These debt
thresholds also supported previous studies in Vietnam such as Cuong and Canh,
suggesting that debt levels below 59.92% would increase financial efficiency; Vo
Hong Duc and Vo Truong Luan found the optimal debt ceiling below 55.67%;
Vo Xuan Vinh and Nguyen Thanh Phu conclude that the wholesale sector is
15.87% -44.52%, the real estate sector is 41.02% -73.00%, the transport sector is
smaller than 79.66% the construction sector is 61.28% smaller. In addition, the
survey of corporate executives in Chapter 2 also showed similar results, the
target debt ratio was about 33.33%.
Some typical examples of high-debt enterprises such as Hoang Cung
Hotel Joint Stock Company (89.26%), New Day Tourist and Services Company
(83.68%), Ngu Binh Hue Tourism (79.88%), ... under the pressure of high cost of
debt so the financial efficiency of these enterprises are negative over 20%. The
reason is that the large hotel business in Hue use high debt right from the
beginning to invest in the construction of the project should be subject to longterm debt pressure, so the cost has corroded the profitability of enterprise. Apart
from the GDP growth factor, the debt ratio is also the factor that has the greatest
impact on financial performance. This result supports the results of the survey of
the Hue ENTERPRISES that the debt ratio is the most influential factor in
financial performance.
The GROW asset growth factor has the same impact on financial
performance, so it can be seen that real estate developers have a positive impact
on their financial performance. Classified by debt group, GROW had a negative
25