Summary of Doctoral thesis: Factors affecting the credit rating of commercial banks - Research in developed and emerging economies
Bạn đang xem bản rút gọn của tài liệu. Xem và tải ngay bản đầy đủ của tài liệu tại đây (1.07 MB, 33 trang )
1
ABSTRACT
Credit rating agencies such as Fitch, Standard & Poor’s and Moody’s do not mention the difference in
impact of affecting factors on credit ratings of commercial banks between developed markets and emerging
markets. However, some researchers have pointed out there is difference in affecting of finacial ratios to credit
rating of commercial banks between developed markets and emerging markets.
Thesis’s objective is to investigate the difference in impacting of systematical factors such as national
risk, banking system risk in country where the banks locate and specific factors of banks as ownership structure,
bank size and finacial ratios on bank credit ratings between developed markets and emerging markets.
First, we use One way anova analysis and choosing indepent variables for ordered logit model method to
indentify factor affecting to bank credit ratings in developed markets and emerging markets.
The results of the thesis indicate that systematical factors have a stronger impact on bank’s credit ratings
in emerging markets than developed markets. Meanwhile, financial ratios have less impact on bank’s credit
ratings in emerging than developed markets. Moreover, the thesis shows the existence of the difference in
affecting of ownership structure to bank’s credit rating between developed markets and emerging markets.
Basing on the empirical results, we have some policy implications for central banks of emerging markets
to raise the bank’s credit ratings in their countries. We also imply some methods for commercial banks in
emerging markets to enchance their credit ratings.
2
CHAPTER 1: INTRODUCTION
1.1 Study background
Investors and depositors have a great concern about bank’s credit rating. However, credit rating agencies
do not mention details the way and level of impacting of affecting factors on bank’s credit ratings. Besides, some
empirical studies have indicated there is difference in level of impacting of financial ratios on the credit ratings
of commercial banks in developed markets and emerging markets.
So it is essential to identify the difference in impacting of affecting factors on bank’s credit rating in
developed markets and emerging markets.
1.2 Research problem
Due to the study background above, we carry out the study to solve the detail research objectives
following:
Identify the difference in impacting of systematical factors such as national risk, banking sector risk and
bank specific features such as bank size, form of ownership and financial ratios on bank’s credit rating in
developed and emerging markets.
1.3 Research questions
Firstly, is there difference in impacting of systematical factors as national risk and banking sector risk on
bank’s credit rating between developed markets and emerging markets.
Secondly, is there difference in affecting of specific features as bank scale, form of ownership and
financial ratios to bank’s credit rating between developed markets and emerging markets.
1.4 Research objectives
(1): Analyze and compare the impact of systematical factors such as national risk and banking sector risk on
bank’s credit rating between developed markets and emerging markets.
(2): Analyze and compare the impact of specific features includes bank size, form of ownership and
financial ratios on bank’s credit rating between developed markets and emerging markets.
1.5 Scope of this study
The thesis focus on analyzing bank’s credit ratings and affecting factors to bank’s credit ratings at
developed markets and emerging markets in the period from 2010 to 2015.
1.6 Academic and empirical meaning of this study
1.6.1 Academic meaning
First, the thesis identifies the affecting factors to bank’s credit ratings at developed markets and
emerging markets
Second, this study indicates the difference in the impact of systematical factors and specific feature of
commercial banks to their credit ratings between developed markets and emerging markets.
1.6.2 Empirical meaning
First, identifying affecting factors and the impact level of these factors on bank’s credit ratings helps
banking governors in emerging markets define the credit risk of commercial banks. Moreover, the empirical
results of the thesis supply more reference foundation for banking governors in emerging markets to issue
regulations for ensuring the safety of commercial banks and enhancing the bank’s credit ratings in these
countries.
3
Second, defining the affecting factors on bank’s credit ratings helps commercial banks to choose suitable
solutions to raise their credit ratings.
1.7 Contribution of this thesis
The contribution of this study to the empirical literatures relating to bank’s credit ratings is that this
study clarifies the difference in the impacts of national risk, banking sector risk, bank size, form of ownership
and bank’s financial ratios to bank’s credit rating between developed markets and emerging markets.
1.8 Structure of this thesis
Chapter 1 “Introduction”.
Chapter 2 “Bank’s credit ratings in developed markets and emerging markets”.
Chapter 3 “Methodologies”.
Chapter 4 “Empirical results and analysis”.
Chapter 5 “Conclusions and policy implications”.
4
CHAPTER 2: BANK CREDIT RATINGS IN DEVELOPED MARKETS AND
EMERGING MARKETS
2.1 The overview of bank’s credit ratings
2.1.1 Concepts of bank’s credit ratings
Bank’s credit ratings issued by credit rating agencies are ordinal measures that should not only reflect
the current positions of banks but also provide information about their future financial positions (Bellotti et al,
2011a).
2.1.2 Bank’s credit rating methodologies
2.1.2.1 The Uniform Financial Institutions Rating System - UFIRS
This system is adopted by the Federal Financial Institutions Examination Council in 1979. At first, this
system is applied in United State. After that this system is used by many countries due to the recommendation of
the Federal Reserve.
2.1.2.2 Bank’s credit rating methodologies of credit rating agencies
Fitch evaluates the bank’s credit rating through 2 phases:
Phase 1: Accessing bank’s viability rating – VR bases on 5 factors: operating environments, bank size,
management capability, risk management and financial positions of commercial banks.
Phase 2: Accessing bank’s final credit ratings by combining bank’s viability ratings and supports from
government and group.
The same as Fitch, Standard & Poor’s evaluates bank’s credit rating within 2 steps:
Step 1: identify bank’s stand alone credit profile bases on 6 factors include: economic risk, industry risk of
country where banks locate; business position; capital and earnings; risk position; funding and liquidity.
Step 2: evaluate bank’s final credit rating by combining bank’s stand alone credit profile and external
supports from government and group.
2.2 The affecting factors on bank’s credit rating
According to The Uniform Financial Institutions Rating System and bank’s credit rating methodologies
of credit rating agencies, we realize that bank’s credit ratings are affected by the following factors: economic
risk, industry risk of country where banks locate, external supports from government and group and some
specific features of banks.
2.2.1
The affecting of macro factors on bank’s credit ratings
Banking operations are very sensitive to macro factors’ varieties. Especially, changes in economic
policies or political systems have strong affects on bank’s credit ratings in these countries.
2.2.2 The affecting of government supports and group supports on bank’s credit ratings
Fitch (2104) supposes that government supports to belonging commercial banks help to improve these
banks’ credit ratings.
Moreover, supports of big and prestige groups have positive impacts on banks’ credit ratings. According
to Moody’s (1999), groups utilize their scale advantages, risk diversification capabilities and management
experience to help belonging commercial banks.
2.2.3 The affecting of specific features on banks’ credit ratings
5
According to Standard & Poor’s (2011a), specific features of commercial banks have impacts on bank’s
credit rating included: bank size and business position; asset quality; capital and earnings; funding and liquidity.
Credit rating agencies analyze these factors to identify bank’s stand alone credit profiles. After that, credit rating
agencies combine bank’s stand alone credit profiles, economic risks and supports from governments or groups to
determine bank’s credit rating.
2.3 Economic features and commercial bank characteristics in developed markets
2.3.1 Economic features in developed markets
First, developed countries have a high level of per capita GNP.
Second, developed countries have post-industrial economies.
Third, developed countries have a high standard of living.
2.3.2 Commercial bank characteristics in developed markets
First, banking system in developed countries has a high degree of competition.
Moreover, commercial banks in developed markets have a higher level of services diversification than
commercial banks in emerging markets.
Finally, the regulatory frameworks controlling the banking operations in developed countries are better
than emerging markets.
2.4 Economic features and commercial bank characteristics in emerging markets
2.4.1 Economic features in emerging markets
First, emerging markets are countries being in transition process from a closed and less developed
economy to an opened and developed economy.
Second, instability of financial system in emerging markets is an important feature discussed by a lot of
researchers.
Third, financial liberalization is taking place in emerging markets to over come the instability of
financial systems.
Final, GDP growth rates in emerging markets are usually higher than developed markets.
2.4.2 Bank characteristics in emerging markets
First, asset and loan growth rates of commercial banks in emerging markets are at high level.
Second, Suarez (2001) indicates that equity capital of commercial banks in emerging markets do not
present the financial capability of commercial banks as in developed markets.
Third, earning capability of commercial banks, presented by net profit/average total assets ratio, in
emerging markets is higher than commercial banks’ in developed markets.
Final, quality of financial information issued by commercial in emerging markets is not reliable (Vives,
2006). In these countries, issuing financial information of commercial banks has a lot of problems due to slow
intuitional reforms.
2.5 The impact of information asymmetry on bank’s credit rating in emerging markets
2.5.1 Concept of information asymmetry
Information asymmetry occurs when one party of a financial transaction have more sufficient
information than the other party. And this may lead to moral hazard or adverse selection.
2.5.2 The reasons cause the impaction of information asymmetry on bank’s credit rating in emerging markets
6
Information asymmetry between credit rating agencies and credit rated banks always occurs in credit
rating process. The reason make information asymmetry have a strong impact on bank’s credit rating in
emerging market may due to the essence of bank’s credit ratings and the quality of bank’s financial information
in these countries.
2.5.3 The impact of information asymmetry on bank’s credit ratings in emerging markets
Most of bank’s credit ratings in emerging markets are unsolicited rating. These credit ratings base almost
on public information of rated banks. So that the credit rating agencies can not access the credibility and
accuracy of the information especially when publishing information frameworks and accounting standards are
not strict in emerging markets. In this case, the credit rating agencies focus on evaluating the bank’s operation
environment and skip accessing the specific financial ratios of rated banks. So that the information asymmetry
causes the the difference in the impact of economic risks and specific features of commercial banks on bank’s
credit rating between developed markets and emerging markets.
2.6 Literature reviews
Empirical researches relating bank’s credit rating can be divided into 2 strands:
The first one presented by studies that search and try to identify the reliability of rating assignments.
The second strand is focused on empirical researches that investigate the prediction models for bank’s
credit ratings.
2.6.1
Reliability of rating assignments
Researches of Poon and Firth (2005), Poon et al (2009), Shen et al (2012).
2.6.2 Prediction models for bank’s credit ratings
2.6.2.1 The studies applied statistical techniques
Poon et al (1999), Matousek and Stewart (2009), Caporale et al (2012).
2.6.2.2 The studies applied artificial intelligent
Boyacioglu et al (2009), Ioannidis et al (2010), Bellotti et al (2011a, 2011b), Chen (2012).
2.7 Research gaps and thesis’ analyzing framework
2.7.1 Research gaps
We notify that the previous studies have not mentioned the differences in impact of some factors
include: economic risk, industry risk and bank’s ownership form on bank’s credit ratings between developed
markets and emerging markets. Moreover, the number of financial ratios used in these studies is limited.
2.7.2
Thesis analyzing framework
We have 2 groups of factor in our research model. The first one presents systematical factors such as
economic risk and industry risk of the countries where banks locate. The other group presents the specific
features of commercial banks including bank’s ownership form, bank size and financial ratios. We apply One
way – ANOVA analyzing on bank’s financial ratios and indepenent variables selection method for ordered logit
model to indentify the factors impacting bank’s credit ratings in developed markets and emerging markets.The
next step, we access the model’s reliability and test the model’s assumptions. Finnaly,we analyse the impact of
affecting factors and the difference in impact of these factor on bank’s credit ratings between developed markets
and emerging markets.
7
CHAPTER 3: METHODOLOGIES
3.1 Research model
3.1.1 Ordered logic model
The objectives of the thesis are identifying the different in impact of affecting factors on bank’s credit
rating between developed markets and emerging markets and interpreting the impact of these factors on bank’s
credit ratings. So that, we apply ordered logic model as our main analyzing model in this study. Because ordered
logic model is suitable for presenting the result of object classifying process into ordinary ratings (Greene,
2002). Otherwise, basing on the direction of variables’’ coefficients we can identify the impact directions of
corresponding factors on bank’s credit ratings. Meanwhile, we can not achieve these objectives with non linear
models such as neutral network or support vector machines. Moreover, we can use interacting variables in
ordered logic model to access the difference in impact of affecting factors on bank’s credit ratings between
developed markets and emerging markets.
The ordered logic model is presented as following:
y* is a dependent variable and unobserved. We can only observer
Y = 1 if y* ≤ 1
= 2 if 1 < y* ≤ µ1
= 3 if µ1 < y* ≤ µ2
…
= J if µj-1 < y*
µ1 , µ2 ,… µj-1 are thresholds calculated by the models.
β is coefficients presenting the impact of independent variables on the dependent variable.
Ɛ is a stochastic error term. Ɛ has a standard distribution, a 0 average value and variance equaling 1.
3.1.2 Definition and measurement of dependent variable
The dependent variable of the model is bank’s credit ratings issued by Fitch. The dependent variable is
given symbol yi and coded from 1 to 9.
3.1.3 Definition and measurement of independent variable
The independent variables of model are classified into 2 groups:
The first group presents the systematic factors affecting bank’s operation environment.
The other group have some subgroups presenting bank’s specific features such as form of ownership,
bank’ size and financial ratios.
3.2 The research data
The thesis’ research data is crossed-sectional data including bank’s credit ratings, bank’s financial ratios
and macro economic factors affecting bank’s operation environment.
The thesis’ research data is divided into 2 data sets. The first data set has 296 observations of bank’s
credit ratings and bank’s financial ratios in developed markets. The second data set has 282 observations of
bank’s credit ratings and bank’s financial ratios in emerging markets. The list of developed markets and
8
emerging markets is referent to World Economic Outlook 2014 (IMF, 2014). We apply systematical sample
selection method with 2 steps to select observations for these 2 data sets
The bank’s credit ratings are Fitch’s bank’s credit rating assignments from 2013 to 2015. The bank’s
financial ratios between 2010 and 2014 are provided by Bank scope.
3.3 Research hypothesis
Hypothesis 1 (H1): there are differences in impact of economic risk and industry risk of countries where
banks locate on bank’s credit ratings between developed markets and emerging markets.
Hypothesis 2 (H2):there are differences in impact of international financial group ownership on bank’s
credit ratings between developed markets and emerging markets.
Hyppothesis 3 (H3):there are differences in impact of government ownership on bank’s credit ratings
between developed markets and emerging markets.
Hyppothesis 4 (H4):there are differences in impact of bank’s total asset size on bank’s credit ratings
between developed markets and emerging markets.
Hyppothesis 5 (H5):there are differences in impact of financial ratios on bank’s credit ratings between
developed markets and emerging markets.
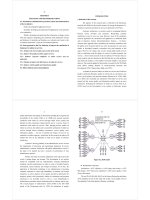
3.4 Analyzing data process of the thesis
The data analyzing process of the thesis to achieve the thesis’ objectives and answer the research
question of the thesis is described by the following diagram:
Diagram 3.1: Thesis’ analyzing data process
Apply One way Anova
analyzing on bank’s
financial ratios
Apply variable
selection process for
Ordered logic model
Identify the
affecting factors
on bank’s credit
rating
Access the
creditability and
assumptions of
the research
model
Merge 2 data
sets and add
interacting
variables
Access the
differences in impact
of affecting factors on
bank’s credit ratings
Source: Author’s inference from literature review
Step 1, to identify the differences in impact of affecting factors on credit ratings between developed
markets and emerging markets we must indicate the specific factors affecting on bank’s credit ratings. To
achieve this purpose, we separately apply one way anova analyzing process and variable selection process for
ordered legit model on the data sets of developed markets and emerging markets.
Step 2, we apply BIC ratios (Bayesian information criteria) to compare the crediability of model
inferring from the above proccess to random models. Besides that, we also test the model’s assumptions such as
muticollinearity, heteroskedasticity and missing essential variables.
9
Step 3, to achieve the first and the second research objectives, we merge the data set of commercial
banks in developed markets and the data set of commercial banks in emerging markets. We also add a dummy
variable named Emer. This proxy takes 1 value if banks locate in developed markets and 0 value in case banks
locate in emerging markets. After that, we apply interact proxies between Emer variable and each variable
presents systematical factors and bank’s specific factors. Finally, we regress again the Ordered logit model with
all variables indentified from previous analyzing steps and these interact proxies. In case the cofficients of the
interact variables are significant that mean there are difference in impact of corresponding variables on bank’s
credit ratings between developed markets and emerging markets.
10
CHAPTER 4: EMPIRICAL RESULTS AND ANALYSIS
4.1 One way Anova analyzing bank’s financial ratios
We separately apply one way Anova analyzing for each data set in the thesis.
Table 4.1: Average values of bank’s financial ratios classified by bank’s credit ratings
in emerging markets
Bank’s
credit
rating
Number
of Obs
Standard
deviation
Average
Min
Max
LnAss:Logarit bank’s total assets
Average
Standard
deviation
Min
Max
AssGrow:Average grow rate of bank’s assets over 3 years
B
70
8.1763
1.3779
5.4189
10.8731
0.2477
0.2719
-0.0512
1.2881
BB
64
8.9984
1.3439
6.3988
13.1649
0.1615
0.1277
-0.0920
0.5908
BBB
116
9.9381
1.6938
5.8197
13.4052
0.1601
0.1167
-0.1883
0.6149
A
32
11.1366
1.9862
6.3651
14.9549
0.1009
0.0645
-0.0326
0.2870
Total
282
9.4235
1.8310
5.4189
14.9549
0.1755
0.1729
-0.1883
1.2881
CreGrow:Average grow rate of loan over 3 years
LoanLoss_Ln:Overdue loan/total loan
B
70
0.2679
0.3014
-0.1466
1.4153
9.2476
14.2697
0.0600
89.9940
BB
64
0.1717
0.1271
-0.1175
0.6352
6.1456
7.2884
0.2160
37.2630
BBB
116
0.3186
1.5222
-0.1357
16.5153
4.8128
6.4004
0.0000
33.9010
A
Total
32
282
0.1160
0.2497
0.0727
0.9901
-0.0319
-0.1466
0.3488
16.5153
3.9422
6.1173
4.1475
9.1790
0.4840
0.0000
19.0650
89.9940
LoanLoss_Equ:Overdue loan/Equity
B
70
9.0775
13.1440
0.5800
LoanPro_Loan:Loan provision/Average total loan
86.0830
77.8620
172.4143
1.3510
985.2000
BB
64
5.9166
7.1224
0.4070
40.8250
33.3714
50.3338
3.2010
335.6260
BBB
116
5.1344
10.4250
0.0000
100.0000
30.5691
62.7480
0.0000
592.5900
A
Total
32
282
4.6897
6.2403
6.3130
10.2703
0.4030
0.0000
27.4330
100.0000
23.6996
42.1649
17.3031
99.7057
3.8960
0.0000
62.9140
985.2000
Equ_Ass:Equity/Total assets
Equ_Loan:Equity/Net loan
B
70
13.0284
7.5463
4.8960
54.4000
12.5905
9.9021
-35.8200
46.3100
BB
64
11.4510
4.6231
4.6550
29.9590
11.3953
4.4502
4.5650
27.6880
BBB
116
11.4910
7.0204
2.2510
45.6580
12.1437
10.6638
2.7870
87.1290
A
32
10.0933
6.3050
1.2650
36.4300
9.7345
7.1818
1.3450
43.6430
Total
282
11.7050
6.6405
1.2650
54.4000
11.8114
9.0263
-35.8200
87.1290
Equ_ShortCap:Equity/Short term capital
Equ_Debt:Equity/Total debts
B
70
27.2697
22.0246
7.4000
117.8660
19.8259
17.1355
5.6050
122.1600
BB
64
22.0198
10.9775
9.9440
71.3420
16.0915
10.6321
5.7420
76.8130
BBB
116
28.5163
67.7129
3.0640
717.1900
30.4765
63.2117
3.1470
514.0000
A
32
18.6040
15.5689
1.6960
76.2060
19.0323
26.8788
5.2040
153.1840
Total
282
25.6077
45.4093
1.6960
717.1900
23.2694
43.0184
3.1470
514.0000
IntIn_Loan:Interest income/Average total loan
IntIn_Ass:Interest income/Total earning interest assets
B
70
19.1616
17.7580
-41.8370
86.6200
15.5154
10.0329
3.8030
67.3100
BB
64
16.9513
14.6495
4.9450
116.6560
13.7887
5.9801
5.1230
39.7260
BBB
116
37.3368
90.0853
1.5400
520.3250
17.7913
39.6251
2.4600
413.7670
A
32
18.4976
32.5349
5.3740
191.8260
11.9574
10.6335
1.3040
64.2230
Total
282
26.0610
60.4427
-41.8370
520.3250
15.6560
26.3065
1.3040
413.7670
11
Bank’s
credit
rating
Number
of Obs
Standard
deviation
Average
Min
Max
Standard
deviation
Average
IntEx_Cap:Interest expense/Total interest bearing capital
B
Min
Max
NIM:Net interest margin
70
14.8549
7.8491
3.5600
54.4100
15.9974
8.3957
4.7900
52.1300
BB
64
11.2155
9.3518
2.9000
70.8000
11.3424
9.2202
0.6000
66.7300
BBB
116
9.8933
7.3001
3.2300
69.0200
9.9942
7.3708
-5.1700
68.0100
A
32
6.8878
2.4154
3.6800
13.2700
6.9241
2.7880
0.0000
13.7700
Total
282
11.0839
7.9578
2.9000
70.8000
11.4420
8.2354
-5.1700
68.0100
NetIntIn_Ass:Net interest income/Average total assets
OthIn_Ass:Other operation income/Average total assets
B
70
13.8780
7.6415
3.7000
61.9300
6.0989
3.3288
1.6300
22.4300
BB
64
12.2491
18.7090
3.5600
139.9600
4.3123
2.4593
1.0200
10.7000
BBB
116
9.1547
6.9236
3.1200
67.9000
4.3609
2.7360
0.1900
16.5400
A
32
6.2269
1.9516
3.4800
12.4600
2.4841
0.6486
1.1000
3.7800
Total
282
10.6972
10.9169
3.1200
139.9600
4.5683
2.8806
0.1900
22.4300
NonIntEx_Ass: Non interest expense/Average total assets
B
ROAA:Return on Average total assets
70
6.2806
3.4380
1.3900
16.2000
7.1035
5.7961
0.6933
40.5170
BB
64
4.4777
2.8568
1.2300
14.4600
5.6268
6.8561
1.1943
52.5063
BBB
116
4.7868
3.2113
0.0000
16.6100
4.7438
5.8730
0.7413
61.2250
A
Total
32
282
2.5263
4.8309
0.9753
3.1961
0.0000
0.0000
4.9600
16.6100
3.3689
5.3739
1.5905
5.8792
0.9227
0.6933
8.9373
61.2250
ROAE:Return on Average equity
B
Exp_Int:Total expense/Total Income
70
6.0141
4.7440
0.7347
32.3683
6.1262
5.3752
-0.4880
32.5820
BB
64
4.8491
5.1862
1.1607
39.2023
4.8953
5.0337
1.0670
36.9770
BBB
116
4.3054
5.5214
0.4237
58.0370
4.3207
5.4613
0.5420
58.1850
A
Total
32
282
3.0632
4.7120
1.2759
5.0017
0.9083
0.4237
6.9520
58.0370
3.0702
4.7574
1.2694
5.1023
1.0000
-0.4880
7.1600
58.1850
NetLoan_Ass:Net loan/Total asset
NetLoan_ShortCap:Net loan/ Total shorterm capital
B
70
3.5223
5.8696
-0.6480
35.7410
6.4434
4.7629
1.0610
23.1070
BB
64
1.9295
1.7895
-1.7550
9.8840
4.8889
5.9204
0.9370
44.4720
BBB
116
1.5113
1.2835
-2.7600
7.3990
3.9355
4.3881
0.1740
40.4890
A
32
1.3356
0.8671
-0.2360
2.8730
2.6124
1.5312
0.6230
6.1850
Total
282
2.0855
3.2642
-2.7600
35.7410
4.6243
4.8026
0.1740
44.4720
NetLoan_Debt:Net loan/Total debts
LiAss_ShortCap:Liquidity assets/Total shortterm capital
B
70
7.0169
5.4266
0.0300
29.0060
1.6594
4.1657
-9.4630
23.8630
BB
64
5.0173
5.8099
0.9400
43.5840
1.2533
1.7253
-6.5410
7.7230
BBB
116
4.0887
3.9986
0.2640
33.3720
1.3015
2.1374
-10.6100
13.1910
A
Total
32
282
2.5883
4.8560
1.4021
4.8536
0.4480
0.0300
5.6190
43.5840
1.3420
1.3840
0.5523
2.6187
0.2750
-10.6100
2.7100
23.8630
LiAss_Debt:Liquidity asset/Total debts
B
70
13.8842
12.0269
-12.1550
58.9220
BB
64
11.4613
12.6789
-74.5380
30.8730
BBB
116
13.2433
9.6325
-31.4700
44.0260
A
Total
32
282
15.4400
13.2472
5.7954
10.7057
4.2120
-74.5380
28.6060
58.9220
Source:Author’s caculating from thesis’ data sets
12
Table 4.2: The result of homogeneity of variance test and One way Anova analyzing on bank’s
financial ratios in emerging markets
Variance
LnAss
AssGrow
CreGrow
LoanLoss_Ln
LoanLoss_Equ
LoanPro_Loan
Equ_Ass
Equ_Loan
Equ_ShortCap
Equ_Debt
IntIn_Loan
IntIn_Ass
IntEx_Cap
P-value of
P-value of
P-value of
homogeneity
One way
homogeneity
Variance
of variance
anova
of variance
test
analyzing
test
0.0110
0.0000 NIM
0.0300
0.0000
0.0000 NetIntIn_Ass
0.0070
0.4010
0.6690 OthIn_Ass
0.0000
0.0000
0.0060 NonIntEx_Ass
0.0000
0.0220
0.0570 ROAA
0.1300
0.0000
0.0060 ROAE
0.2360
0.4920
0.1810 Exp_Int
0.1360
0.1580
0.4760 NetLoan_Ass
0.0000
0.2060
0.6320 NetLoan_ShortCap
0.0870
0.0000
0.0210 NetLoan_Debt
0.0010
0.0000
0.0740 LiAss_ShortCap
0.0010
0.1470
0.6340 LiAss_Debt
0.1210
0.0540
0.0000
Source: Author’s caculating from thesis’ data sets
P-value of
One way
anova
analyzing
0.0000
0.0020
0.0000
0.0000
0.0100
0.0280
0.0230
0.0000
0.0000
0.0000
0.7890
0.3390
According to the average values of bank’s financial ratios in each bank’s credit ratings and the P-value
of One way Anova analyzing showed
in table 4.1 and 4.2, we can conclude that LnAss, AssGrow,
LoanLoss_Ln, LoanLoss_Equ, LoanPro_Loan, Equ_Debt, IntIn_Loan, IntEx_Cap, NIM, NetIntIn_Ass,
OthIn_Ass, NonIntEx_Ass, NetLoan_Ass, NetLoan_ShortCap và NetLoan_Debt have different average values
in each bank’s credit ratings.
Meanwhile, the P-values of
homogeniety of variance tests on CreGrow, Equ_Ass, Equ_Loan,
Equ_ShortCap, IntIn_Ass, ROAA, ROAE, Exp_Int and LiAss_Debt are not significant (>10%) so the
assumption about homogeneity of variance on these variables are invalid. So that we take a nonparameter
Kruskal – Wallis test on these proxies.
Table 4.3: The results of Krukal – Wallis test on bank’s financial ratios in emerging markets
Variable
CreGrow
Equ_Ass
Equ_Loan
Equ_ShortCap
IntIn_Ass
P-value of Kruskal –
P-value of Kruskal –
Variable
Wallis test
Wallis test
0.0050 ROAA
0.0000
0.0360 ROAE
0.0000
0.0250 Exp_Int
0.0000
0.0040 LiAss_Debt
0.2500
0.0220
Source: Author’s caculating from thesis’ data sets
According to the results of One way anova analyzing and Kruskal – Wallis test, we can conclude that
LnAss,
AssGrow,
CreGrow,
LoanLoss_Ln,
LoanLoss_Equ,
LoanPro_Loan,
Equ_Ass,
Equ_Loan,
Equ_ShortCap, Equ_Debt, IntIn_Loan, IntIn_Ass, IntEx_Cap, NIM, NetIntIn_Ass, OthIn_Ass, NonIntEx_Ass,
ROAA, ROAE, Exp_Int, NetLoan_Ass, NetLoan_ShortCap and NetLoan_Debt have different average values in
13
each bank’s credit ratings in emerging markets. In contrast, the average values of LiAss_ShortCap and
LiAss_Debt are not different in each bank’s credit ratings.
We apply one way anova analyzing on bank’s financial ratios in developed markets.
Table 4.4: Average values of bank’s financial ratios classified by bank’s credit ratings
in developed markets
Bank’s
credit
rating
Number of
Obs
Standard
deviation
Average
Min
Max
Average
Standard
deviation
Min
Max
AssGrow:Average grow rate of bank’s assets
over 3 years
LnAss:Logarit bank’s total assets
B
8
11.4577
.6713
10.0440
12.3110
0.0017
0.0920
-0.0945
0.1964
BB
25
10.7804
1.5263
5.2490
12.8230
0.0339
0.1207
-0.1151
0.3602
BBB
52
10.4119
1.7275
6.6830
13.8380
0.0218
0.0884
-0.1968
0.3364
A
152
11.4706
1.7368
7.3850
14.7240
0.0143
0.1047
-0.4042
0.5461
AA
48
11.8124
1.6266
7.7130
14.2390
0.0557
0.0472
-0.0594
0.1627
AAA
11
11.9109
1.3402
10.1530
14.4920
0.0322
0.0577
-0.0453
0.1623
Total
296
11.2977
1.7253
5.2490
14.7240
0.0243
0.0951
-0.4042
0.5461
CreGrow:Average grow rate of loan
over 3 years
LoanLoss_Ln:Overdue loan/total loan
B
8
0.0098
0.1309
-0.1826
0.2727
24.7640
13.5608
0.8800
44.8630
BB
25
-0.0093
0.1130
-0.1708
0.2753
13.2698
8.8345
0.2180
37.9730
BBB
52
0.0361
0.1170
-0.1491
0.5168
6.5633
8.5192
0.0410
44.6330
A
152
0.0443
0.1859
-0.4088
1.4227
3.6221
4.6317
0.0000
44.6490
AA
48
0.0558
0.0648
-0.0759
0.3202
1.7663
1.7369
0.0090
8.1780
AAA
11
0.0800
0.1715
-0.0318
0.5829
1.0203
1.6900
0.0000
5.8160
Total
296
0.0406
0.1534
-0.4088
1.4227
5.1274
7.4089
0.0000
44.8630
LoanLoss_Equ:Overdue loan/Equity
LoanPro_Loan:Loan provision/Average total loan
B
8
306.8720
186.7417
28.7310
690.0910
2.8763
1.8082
0.0100
5.9100
BB
25
130.6217
89.4631
4.7470
381.3450
1.6124
1.1304
-0.3100
4.5700
BBB
52
59.6979
86.3918
0.2420
414.3900
0.9592
1.6735
-0.2900
10.6800
A
152
37.0226
55.7724
0.0000
464.9560
0.4932
1.0274
-0.4900
10.8700
AA
48
23.2292
63.8459
0.0400
433.0000
0.3258
0.3950
-0.0700
1.8300
AAA
11
73.3240
232.5974
0.0000
774.5700
0.0900
0.2509
-0.1800
0.6500
Total
296
55.3169
96.9361
0.0000
774.5700
0.6919
1.2257
-0.4900
10.8700
Equ_Ass:Equity/Total assets
Equ_Loan:Equity/Net loan
B
8
5.8810
3.1806
2.1000
11.3540
9.2836
4.4860
3.0860
16.1920
BB
25
6.6860
3.7176
0.2520
16.6180
12.9957
10.5310
0.6050
53.5830
BBB
52
8.4437
3.8266
1.4640
23.1450
19.7328
37.4397
3.2320
276.9500
A
152
7.1024
3.4055
1.1450
20.4280
16.7668
22.8025
1.9740
198.1360
AA
48
8.0283
2.9046
0.0060
16.0840
20.1603
29.4661
0.0090
151.4190
AAA
11
8.3670
6.5926
0.6530
20.1630
17.4925
15.9759
0.7620
57.3420
Total
296
7.4670
3.6177
0.0060
23.1450
17.3444
25.8997
0.0090
276.9500
14
Bank’s
credit
rating
Number of
Obs
Average
Standard
deviation
Min
Max
Average
Equ_ShortCap:Equity/Short term capital
Standard
deviation
Min
Max
Equ_Debt:Equity/Total debts
B
8
7.1263
3.6462
2.3740
13.6510
6.3853
3.6620
2.1450
12.8410
BB
25
10.2912
6.1303
0.2880
29.5010
7.4736
4.4889
0.2610
19.9290
BBB
52
12.6163
5.6406
1.7230
33.6150
9.5709
4.9256
1.4860
30.1150
A
152
14.0868
19.5748
2.0100
171.4090
7.9145
4.1861
1.1620
26.2490
AA
48
12.0495
8.4045
0.0080
63.6210
8.9642
3.5694
0.0060
19.7250
AAA
11
23.8286
21.0270
5.8390
60.7440
9.7279
8.2934
0.6570
25.2560
Total
296
13.3514
15.4219
0.0080
171.4090
8.3645
4.4883
0.0060
30.1150
IntIn_Loan:Interest income/Average total loan
IntIn_Ass:Interest income/Total earning interest assets
B
8
4.1388
1.2694
2.5400
6.3800
3.9250
1.4714
1.5800
5.8500
BB
25
3.6928
2.5023
1.5200
11.8800
3.9576
2.5821
0.8700
11.6800
BBB
52
3.7648
1.5208
0.0900
9.3700
3.5096
1.3593
1.0600
8.8300
A
152
3.9412
1.5957
0.7200
10.9100
3.4638
1.5443
0.1900
9.9400
AA
48
3.8719
1.4801
1.7300
7.4400
3.3244
1.4050
1.2300
6.3300
AAA
11
5.2309
6.7548
0.0000
24.6100
3.0355
1.2925
1.0800
4.5000
Total
296
3.9313
2.0545
0.0000
24.6100
3.4875
1.5942
0.1900
11.6800
IntEx_Cap:Interest expense/Total interest
bearing capital
NIM:Net interest margin
B
8
2.1900
0.4121
1.7300
2.9500
1.7205
1.1500
-0.1980
3.3640
BB
25
2.4952
2.2075
0.7400
11.6300
1.6064
1.1379
0.1360
5.2070
BBB
52
1.8075
0.9530
0.2800
4.5900
1.8282
0.9111
0.3460
4.6810
A
152
1.9437
1.3209
0.0300
7.3800
1.6478
1.3925
-0.0370
10.3710
AA
48
1.5529
1.1935
0.1500
4.8000
1.8591
0.7391
0.7560
3.7010
AAA
11
1.9327
1.4846
0.3300
4.4600
1.2684
1.2307
0.3440
3.5380
Total
296
1.9092
1.3441
0.0300
11.6300
1.6981
1.1946
-0.1980
10.3710
NetIntIn_Ass:Net interest income/Average total assets
OthIn_Ass:Other operation income/Average
total assets
B
8
1.5258
1.0146
-0.1950
2.9270
0.6049
0.4338
-0.0780
1.2280
BB
25
1.4659
1.0459
0.1340
4.5890
1.2422
0.8313
-0.2310
3.4960
BBB
52
1.7070
0.8400
0.3420
4.3510
0.7673
0.6303
-1.3640
2.7220
A
152
1.4897
1.1239
-0.0310
8.2190
1.2219
2.3249
-0.1810
21.1570
AA
48
1.6610
0.6182
0.7230
3.0580
1.1403
0.9118
0.0070
4.1040
AAA
11
1.2160
1.1900
0.3390
3.3870
0.2618
0.2869
-0.0980
0.8160
Total
296
1.5444
1.0019
-0.1950
8.2190
1.0782
1.7586
-1.3640
21.1570
NonIntEx_Ass: Non interest expense/Average
total assets
ROAA:Return on Average total assets
B
8
3.7551
1.7927
0.0520
6.1600
0.3375
2.4722
-2.7960
4.4290
BB
25
2.7567
1.4319
0.1470
6.3080
-0.2208
1.0151
-3.4080
1.2870
BBB
52
2.1230
1.9067
0.1950
13.9980
0.1170
1.8315
-11.2020
1.8410
A
152
2.0315
2.1603
0.0160
16.3690
0.4275
1.1498
-9.8850
6.6490
AA
48
1.7656
0.9176
0.1470
4.6780
0.7194
0.7254
-3.2490
2.0640
AAA
11
0.4705
0.4257
-0.0390
1.2000
1.0657
0.9620
0.0120
2.4610
Total
296
2.0543
1.9050
-0.0390
16.3690
0.3868
1.2965
-11.2020
6.6490
15
Bank’s
credit
rating
Number of
Obs
Standard
deviation
Average
Min
Max
ROAE:Return on Average equity
Average
Standard
deviation
Min
Max
Exp_Int:Total expense/Total Income
B
8
-0.3178
61.2013
-88.0050
81.8900
74.4116
35.5491
15.1590
133.5020
BB
25
-9.7504
34.8778
-150.1230
28.1520
66.1058
18.6566
24.3430
102.1420
BBB
52
2.6575
17.4151
-68.9970
23.8510
57.2777
20.5838
14.7550
145.2210
A
152
4.9554
11.9207
-74.3900
57.2300
64.3338
24.0560
9.4820
200.0000
AA
48
15.9109
46.3791
-53.1800
321.7950
54.1946
15.2158
14.5110
101.8980
AAA
11
51.0976
132.3486
0.0910
449.3400
29.6526
16.8780
7.4290
62.7300
Total
296
6.6585
36.9528
-150.1230
449.3400
60.5832
23.0990
7.4290
200.0000
NetLoan_Ass:Net loan/Total asset
NetLoan_ShortCap:Net loan/ Total shorterm capital
B
8
63.1024
7.9104
46.6140
70.1220
77.4719
11.1113
60.0990
95.6470
BB
25
57.7573
14.9626
4.0300
73.1660
87.2260
24.5990
4.6560
126.1080
BBB
52
63.8140
20.3189
2.5610
91.2770
95.8951
36.5762
3.0680
193.1080
A
152
57.4293
21.0607
5.1490
92.0240
98.7197
66.7776
9.6570
488.7750
AA
48
62.4362
21.3904
5.5320
97.0130
94.5649
48.3778
6.8200
283.3760
AAA
11
61.8165
25.8793
6.7990
94.1260
209.4969
203.4991
38.1260
766.4160
Total
296
59.7069
20.5274
2.5610
97.0130
100.1214
69.4688
3.0680
766.4160
LiAss_ShortCap:Liquidity assets/Total short-term
capital
NetLoan_Debt:Net loan/Total debts
B
8
69.6515
9.0654
51.4010
81.3050
10.0890
7.1723
3.7010
24.2990
BB
25
66.5232
17.6029
4.1020
84.0970
15.3523
19.1648
2.5500
89.0300
BBB
52
73.8234
23.1714
2.6510
104.0820
25.3165
30.2986
1.4260
159.0970
A
152
66.5928
23.9872
7.4470
147.4430
38.4403
42.6849
0.3020
391.6890
AA
48
72.3578
24.9982
6.5170
133.5730
23.0709
15.9403
0.8560
61.5100
AAA
11
70.0112
31.3312
7.2010
112.6920
67.9500
104.4219
7.7610
377.7170
Total
296
69.0017
23.5972
2.6510
147.4430
32.0229
40.7363
0.3020
391.6890
LiAss_Debt:Liquidity asset/Total debts
B
8
8.8375
5.9283
3.1700
21.4620
BB
25
12.5558
17.1223
1.7010
78.4480
BBB
52
17.4041
16.4145
1.3710
86.9570
A
152
24.0424
19.1224
0.0630
111.3150
AA
48
18.5450
12.3313
0.4960
54.2490
AAA
11
22.5233
20.4505
2.5690
71.3440
Total
296
20.5472
17.7427
0.0630
111.3150
Source: Author’s caculating from thesis’ data sets
16
Table 4.5: The result of homogeneity of variance test and One way Anova analyzing on bank’s
Variance
LnAss
financial ratios in developed markets
P-value of
P-value of
P-value of
homogeneity
One way
homogeneity
Variance
of variance
anova
of variance
test
analyzing
test
0.0060
0.0000 NIM
0.4900
P-value of
One way
anova
analyzing
0.6520
AssGrow
0.0250
0.1700 NetIntIn_Ass
0.2990
0.5800
CreGrow
0.3730
0.5100 OthIn_Ass
0.2980
0.3200
LoanLoss_Ln
0.0000
0.0000 NonIntEx_Ass
0.2850
0.0020
LoanLoss_Equ
0.0000
0.0000 ROAA
0.0020
0.0140
LoanPro_Loan
0.0000
0.0000 ROAE
0.0000
0.0000
Equ_Ass
0.0010
0.0770 Exp_Int
0.4650
0.0000
Equ_Loan
0.6030
0.7700 NetLoan_Ass
0.0060
0.0750
Equ_ShortCap
0.0210
0.1460 NetLoan_ShortCap
0.0000
0.0000
Equ_Debt
0.0000
0.0830 NetLoan_Debt
0.0190
0.4150
IntIn_Loan
0.0000
0.3930 LiAss_ShortCap
0.0000
0.0000
IntIn_Ass
0.3820
0.5230 LiAss_Debt
0.0190
0.0040
IntEx_Cap
0.0310
0.6520
Source: Author’s caculating from thesis’ data sets
The same as the above analyzing, basing on average values of bank’s financial ratios in each bank’s
credit ratings and the p-value of one way anova analyzing presented in table 4.4 and 4.5, we can conclude that
LnAss, LoanLoss_Ln, LoanLoss_Equ, LoanPro_Loan, Equ_Ass, Equ_Debt, ROAA, ROAE, NetLoan_Ass,
NetLoan_ShortCap, LiAss_ShortCap và LiAss_Debt have different average values in each bank’s credit ratings.
Meanwhile, the P-values of homogeniety of variance tests on CreGrow, Equ_Loan, IntIn_Ass, NIM,
NetIntIn_Ass, OthIn_Ass, NonIntEx_Ass and Exp_Int are not significant (>10%) so the assumption about
homogeneity of variance on these variables are invalid. So that we take a nonparameter Kruskal – Wallis test on
these proxies.
Table 4.6: The results of Krukal – Wallis test on bank’s financial ratios in emerging markets
Variable
CreGrow
Equ_Loan
IntIn_Ass
NIM
P-value of Kruskal –
P-value of Kruskal –
Variable
Wallis test
Wallis test
0.0060 NetIntIn_Ass
0.0250
0.3330 OthIn_Ass
0.0010
0.8420 NonIntEx_Ass
0.0000
0.0140 Exp_Int
0.0000
Source: Author’s caculating from thesis’ data sets
The results of Krukal – Wallis test presented in table 4.6 show that CreGrow, NIM, NetIntIn_Ass,
OthIn_Ass, NonIntEx_Ass và Exp_Int have different average values in each bank’s credit ratings.
Basing on the results of One way anova analyzing and Kruskal – Wallis test, we can conclude that
LnAss, CreGrow, LoanLoss_Ln, LoanLoss_Equ, LoanPro_Loan, Equ_Ass, Equ_Debt, NIM, NetIntIn_Ass,
17
OthIn_Ass, NonIntEx_Ass, ROAA, ROAE, Exp_Int, NetLoan_Ass, NetLoan_ShortCap, LiAss_ShortCap and
LiAss_Debt have different average values in each bank’s credit ratings in developed markets. In contrast, the
average values of AssGrow, Equ_Loan, Equ_ShortCap, IntIn_Loan, IntIn_Ass, IntEx_Cap và NetLoan_Debt
are not different in each bank’s credit ratings.
4.2 The result of variable selection for ordered logic model and accessing model’s creditability
4.2.1 The result of variable selection for ordered logic model
To select varaibles for ordered logit model and avoid model’s over-fitting, we pick up 5 sub data sets for
the initial data set. Each sub data sets’ number of observations equal 80% of the number of observations in the
initial data set. We again resgress the model on each sub data sets. We choose the sub data sets from the initial
data set by applying systematical sample selection methold with 5 steps.
Tabble 4.7: The ordered logit models on 5 sub data sets and the initial data set
in emerging markets
Sub data set 1
Variable
Country_rating
Bicra
Government
Group
LnAss
AssGrow
CreGrow
LoanLoss_Ln
Equ_Debt
IntEx_Cap
NIM
NetIntIn_Ass
OthIn_Ass
NonIntEx_Ass
ROAE
Exp_Int
NetLoan_Ass
Coefficient
2.2670
0.6750
0.9698
4.0543
0.6060
-8.0183
3.1831
-0.1034
0.0159
0.2371
-0.1957
-0.0301
-0.5666
0.4862
-0.9325
0.9262
-0.1387
Number of obs =
225
LR chi2(17) = 289.9800
Prob > chi2 = 0.0000
Pseudo R2
= 0.5010
Log likelihood = -144.4212
Sub data set 2
P-value
0.0000
0.0020
0.0190
0.0000
0.0000
0.0090
0.1860
0.0000
0.0010
0.1480
0.2040
0.1120
0.0080
0.0140
0.0310
0.0230
0.1900
Variable
Coefficient
Country_rating
1.8320
Bicra
0.7465
Government
0.9815
Group
4.0830
LnAss
0.5704
AssGrow
-5.3294
CreGrow
0.5879
LoanPro_Loan
-0.0142
Equ_Loan
-0.0859
Equ_ShortCap
-0.0129
Equ_Debt
0.0191
IntIn_Ass
0.0181
NetIntIn_Ass
-0.0149
OthIn_Ass
-0.2888
NonIntEx_Ass
0.1787
ROAE
0.1182
NetLoan_ShortCap
-0.1072
LiAss_Debt
-0.0215
Number of obs =
225
LR chi2(18) = 284.4600
Prob > chi2 = 0.0000
Pseudo R2
= 0.4890
Log likelihood = -148.6402
P-value
0.0000
0.0010
0.0270
0.0000
0.0000
0.0040
0.2340
0.0010
0.1530
0.2210
0.0550
0.1300
0.3780
0.1370
0.2660
0.2480
0.2510
0.2710
18
Sub data set 3
Variable
Coefficient
Country_rating
Bicra
Government
Group
LnAss
AssGrow
LoanLoss_Ln
LoanLoss_Equ
Equ_ShortCap
Equ_Debt
NIM
OthIn_Ass
NonIntEx_Ass
ROAA
NetLoan_Ass
NetLoan_Debt
2.0111
0.8798
1.2492
4.0705
0.5726
-6.1673
-0.1178
0.0214
-0.0047
0.0179
-0.0897
-0.3846
0.2826
0.1410
0.0576
-0.1013
Number of obs =
226
LR chi2(16) = 295.7900
Prob > chi2 = 0.0000
Pseudo R2
= 0.5081
Log likelihood = -143.1579
Sub data set 4
P-value
0.0000
0.0000
0.0040
0.0000
0.0000
0.0010
0.0020
0.5760
0.4570
0.0000
0.2460
0.0280
0.0820
0.1720
0.5920
0.2460
Variable
2.1079
Country_rating
0.8533
Bicra
1.1090
Government
4.4270
Group
0.5170
LnAss
-6.8707
AssGrow
0.7967
CreGrow
-0.0967
LoanLoss_Ln
-0.0167
Equ_ShortCap
0.0179
IntIn_Loan
-0.1847
NetIntIn_Ass
-0.4910
OthIn_Ass
0.4132
NonIntEx_Ass
0.6560
ROAA
-0.4994
Exp_Int
0.1545
LiAss_ShortCap
Number of obs =
226
LR chi2(16) = 304.2700
Prob > chi2 = 0.0000
Pseudo R2
= 0.5154
Log likelihood = -143.0191
Sub data set 5
Variable
Country_rating
Bicra
Government
Group
LnAss
AssGrow
CreGrow
LoanLoss_Ln
Equ_ShortCap
Equ_Debt
IntEx_Cap
OthIn_Ass
NonIntEx_Ass
ROAE
Coefficient
2.0842
0.8235
1.1284
3.8271
0.4918
-3.5649
0.6086
-0.0666
-0.0127
0.0152
-0.0527
-0.3986
0.2538
0.4154
Coefficient
P-value
0.0000
0.0000
0.0120
0.0000
0.0000
0.0000
0.1030
0.0000
0.1110
0.0000
0.2900
0.0150
0.0170
0.0900
0.0910
0.1260
Initial data set
P-value
0.0000
0.0000
0.0090
0.0000
0.0000
0.0320
0.1640
0.0050
0.1700
0.0020
0.4460
0.0360
0.0830
0.1770
Variable
Country_rating
Bicra
Government
Group
LnAss
AssGrow
LoanLoss_Ln
Equ_Debt
OthIn_Ass
Coefficient
1.8164
0.8881
1.1377
3.9542
0.5979
-4.5942
-0.0832
0.0157
-0.1744
P-value
0.0000
0.0000
0.0020
0.0000
0.0000
0.0010
0.0000
0.0000
0.0010
19
-0.2973
0.2780
Exp_Int
-0.0845
0.2310
NetLoan_Debt
Number of obs =
226
Number of obs =
282
LR chi2(16) = 295.4400
LR chi2(9) = 353.8200
Prob > chi2 = 0.0000
Prob > chi2 = 0.0000
Pseudo R2
= 0.5036
Pseudo R2
= 0.4845
Log likelihood = -145.6301
Log likelihood = -188.2233
Source: Author’s caculating from thesis’ data sets
Basing on the regression results of ordered logit models on 5 sub data sets and the initial data set in
emerging markets presented in table 4.7, we calculate the frequencies of variables having significant cofficients
in above models.
Table 4.8: The frequency of variables having significant cofficients in ordered logit models
in emerging markets
Variable
Country_rating
Bicra
Government
Group
LnAss
AssGrow
CreGrow
LoanLoss_Ln
LoanLoss_Equ
LoanPro_Loan
Equ_Ass
Equ_Loan
Equ_ShortCap
Equ_Debt
IntIn_Loan
Frequency (%)
Variable
Frequency(%)
100 IntIn_Ass
0
100 IntEx_Cap
0
100 NIM
0
100 NetIntIn_Ass
0
100 OthIn_Ass
83
100 NonIntEx_Ass
67
0 ROAA
17
83 ROAE
17
0 Exp_Int
33
17 NetLoan_Ass
0
0 NetLoan_ShortCap
0
0 NetLoan_Debt
0
0 LiAss_ShortCap
0
83 LiAss_Debt
0
17
Source: Author’s caculating from thesis’ data sets
The empirical results in table 4.7 and 4.8 show that Country_rating, Bicra, Government, Group, LnAss,
AssGrow, LoanLoss_Ln, Equ_Debt và OthIn_Ass are variable having significant cofficients in the model on the
initial data set. Moreover, these proxies have the frequencies greater than 80% in ordered logit models on sub
data sets and initial data set. Besides that, the results of one way anova analyzing presented in table 4.1 also
indicate that LnAss, AssGrow, LoanLoss_Ln, Equ_Debt and OthIn_Ass having different average values in each
bank’s credit ratings. So that, we can conclude that these proxies have impacts on the bank’s credit ratings in
emerging markets.
We regress the ordered logit models with these variables on the initial data set in emerging markets.
20
Table 4.9: The ordered logit model with selected variables on initial data set in emerging markets
Standard
Variable
Coefficient
P-Value
Confident interval
Deviation
Min
Max
1.8164
0.2897
0.0000
1.2487
2.3842
Country_rating
0.8881
0.1857
0.0000
0.5241
1.2520
Bicra
1.1377
0.3722
0.0020
0.4082
1.8672
Government
3.9542
0.5847
0.0000
2.8082
5.1003
Group
0.5979
0.1049
0.0000
0.3923
0.8035
LnAss
-4.5942
1.4117
0.0010
-7.3612
-1.8273
AssGrow
-0.0832
0.0220
0.0000
-0.1264
-0.0400
LoanLoss_Ln
0.0157
0.0038
0.0000
0.0083
0.0232
Equ_Debt
-0.1744
0.0536
0.0010
-0.2794
-0.0695
OthIn_Ass
16.6202
19.3397
24.3097
/cut1
/cut2
/cut3
1.7691
1.9176
2.1752
13.1528
15.5812
20.0465
20.0876
23.0982
28.5730
Number of obs =
282
LR chi2(9) = 353.8200
Prob > chi2 = 0.0000
Pseudo R2
= 0.4845
Log likelihood = -188.2233
Source: Author’s caculating from thesis’ data sets
We apply the same analyzing process with the variables having impact on bank’s credit ratings in
developed markets.
Table 4.12: The ordered logit model with selected variables on initial data set
Variable
Country_rating
Government
Group
LnAss
LoanLoss_Ln
Equ_Ass
Equ_Loan
IntIn_Loan
NIM
ROAE
Exp_Int
Coefficient
1.3263
2.2145
1.3725
0.6562
-0.1043
0.1149
0.0131
0.1019
-0.5620
0.0121
-0.0232
in developed markets
Standard
P-Value
Deviation
0.1564
0.4154
0.3041
0.0939
0.0233
0.0485
0.0059
0.0740
0.1659
0.0050
0.0061
0.0000
0.0000
0.0000
0.0000
0.0000
0.0180
0.0270
0.1690
0.0010
0.0150
0.0000
Confident interval
Min
1.0197
1.4003
0.7765
0.4721
-0.1500
0.0197
0.0015
-0.0432
-0.8871
0.0023
-0.0352
Max
1.6328
3.0287
1.9684
0.8403
-0.0586
0.2100
0.0247
0.2470
-0.2368
0.0218
-0.0113
21
NetLoan_Ass
/cut1
/cut2
/cut3
/cut4
/cut5
0.0194
11.2014
14.3689
17.1884
21.2567
23.7446
0.0087
1.8856
1.9165
2.0324
2.1849
2.2434
0.0260
0.0024
7.5057
10.6126
13.2049
16.9744
19.3476
0.0365
14.8970
18.1251
21.1718
25.5390
28.1415
Number of obs =
296
LR chi2(12) = 287.7800
Prob > chi2 = 0.0000
Pseudo R2
= 0.3545
Log likelihood = -262.0579
Source: Author’s caculating from thesis’ data sets
4.2.2 The result of accessing model’s crediability
We apply the BIC (Bayesian information criteria) to compare the crediability of the selected model to
random models.
The results of BIC show that the selected models are the finest models.
4.3 Test of the ordered logit model’s assumptions
4.3.1 Test of multicollinearity in the models
To access the affect of high multicollinearity on the variables in the model, we calculate VIF ratios of
each proxies of the model. The variables cause the high multicollinearity in the model if their VIF ratios greater
than 10. We calculate the VIF ratios of the variables of the ordered logic model in developed markets and in the
emerging markets.
The results of VIF ratios show that the VIF ratios of all variables in 2 models are below 10. So that we
can conclude that the ordered logic models on the data sets in developed market and in emerging markets are not
affected by the multicollinearity.
4.3.2 Test of heteroskedasticity in the models
One of the most important assumptions of models is that there is no heteroskedasticity in the model. The
violation of this assumption can impact the standard deviations and p-values of variables in the models. We add
option Robust in the regression command to regress the model without heteroskedasticity assumption and
compare to the above regression results.
The results of model’s regression without heteroskedasticity assumption show that there changes in
standard deviations and p-value of the variables in the models. But the differences are not much and do not
change p-value and the direction of cofficients. So that, the thesis’models are not affected by the
heteroskedasticity.
4.3.3 Test of missing essential variables in the models
The test of missing essential variables in the models, proposed by Chen et al (2015), is applied in this
study. The test’s results show that there is no missing essential variables in the thesis’ models.
22
4.4 Access the marginal affects of the model’s variables.
We calculate the marginal affects of the variables having significant p-values in 4.2.1. The results show
that Country_rating, Government and Group have strong marginal affects on the banks’ classification. Besides,
that marginal affects of these variables in the data set of emerging markets are greater these affects in the
developed markets.
4.5 Analyzing the differences in impact of affecting factors on bank’s credit ratings between developed
markets and emerging markets
As presented in 3.4 to indentify the differences in impact of affecting factors on bank’s credit rating
between developed markets and emerging markets, we merge the data set in developed markets and the data set
in emerging markets together. Moreover, we add Emer, a dummy variable, in the model. This proxy take 0 value
if banks locate in emerging markets. Otherwise, it takes 1 value. After that, we create interact proxies between
Emer and each variables in the model. We add Emer and these interact proxies in the model
The model’ resgression result show that the cofficients of Country_rating_Emer and Emer are
significant and have directions as expected. Besides, the cofficient of Bicra_Emer is significant but Bicra’s is
not. The empirical results also indicate that the cofficients of Government_Emer and Group_Emer are
significant. The cofficient of Government_Emer is negative. But the cofficient of Group_Emer is positive.
Moreover, we notice that LnAss, AssGrow, LoanLoss_Ln, NIM, ROAE, Exp_Int and the interact
proxies between these variables and Emer have significant cofficients and oppositve directions.
4.6 Result analyzing
4.6.1 Analyzing the empirical model of affecting factors on bank’s credit ratings in emerging markets
4.6.1.1 The impact of systematical factors on bank’s credit ratings in emerging markets
The systematical factors include economic risk and industry risks of countries where banks locate have
positive affects on bank’s credit ratings. Besides that, the coefficients of these variables are significant at 1%
level.
These results are similar to bank’s rating criteria of international rating agencies. These results are also
coincident with the empirical results of Bellotti et al (2011a, 2011b) and Caporale et al (2012).
4.6.1.2 The impact of ownership factor on bank’s credit rating in emerging markets
From the regression results showed in table 4.9, we notice that ownership factor has a strong impact on
bank’s credit ratings. Government variable has a positive impact on bank’s credit ratings. This indicates that the
commercial banks belonging to government of countries where banks locate has a larger change to receive
better ratings. Similarly, Group variable has a positive affect on bank’s credit ratings. This show that the
commercial banks belonging big financial groups have a better changes to be classified into A or BBB rating
than the others.
These results are agreed with bank’s rating criteria of international rating agencies. Because these
agencies suppose that governments or international financial groups tend to support to their belonging
commercial banks.
4.6.1.3 The impact of scale factor on bank’s credit ratings in emerging markets
23
Bank’s size, presented by the total asset of the banks, has positive affect on bank’s credit ratings. This
implies that the bigger size do the banks have the better change do they have to receive the better ratings.
Goddard et at (2004) explain that big commercial banks have economic scale advantages. They benefit from
their market power to generate an above average profit rate.
4.6.1.4 The impact of financial ratios on bank’s credit ratings in emerging markets
The empirical results show that the average assets growth rate over 3 years and the overdue loan/Total
loan ratio have negative impacts on bank’s credit ratings. These variable’s coefficients are significant at 1%
level. This indicates that banks having a rapid assets growth rate may be classified into low credit ratings. This is
agreed with the empirical results of Köhler (2015). Besides, the impact of the overdue loan/Total loan ratio
coincides with the bank rating criteria of banking regulatory authorities. Moreover, it is also proved by Caporale
et al (2012).
Next, among capital capacity ratios, we notice that the equity/total debt ratio has positive affect on
bank’s credit rating at 1% significant level. This implies that banks having high equity/total debt ratios can
receive better bank’s credit ratings. Pasiouras and Kosmidou (2007) explain that a strong equity help to increase
bank’s creditworthiness, reduce capital expense. These banks have more capability to expend their business and
deal with operation risks.
Finally, among earning ratios, we find that the other operation income/Average total asset (OthIn_Ass)
has negative impact on bank’s credit ratings. Berger et al (2010) indicate that bank’s diversification in China
cause an increase in operation expenditure and reduce bank’s profitability.
4.6.2 Analyzing the empirical model of affecting factors on bank’s credit ratings in developed markets
4.6.2.1 The impact of systematical factors on bank’s credit ratings in developed markets
Among systematical factors, we notice that the economic risk factor has positive impact on bank’s credit
rating at 1% significant level. The coefficient of Bicra, industry risk, is not significant in the model.
4.6.2.2 The impact of ownership factor on bank’s credit rating in developed markets
The results indicate that all independent variables presenting these factors have positive impact on
bank’s credit rating at 1% significant level. This result is the same as the result in the ordered logic model in
emerging markets.
4.6.2.3 The impact of scale factor on bank’s credit ratings in developed markets
The scale factor has positive impact on bank’s credit ratings. This result is also the same as the result in
the ordered logic model in emerging markets.
4.6.2.4 The impact of financial ratios on bank’s credit ratings in developed markets
Among bank’s asset quality ratios, we notice that the overdue debt/total debt ratio has negative impact
on bank’s credit rating at 1% significant level.
Next, the model’s results show that the equity/total asset ratio and the equity/total net debt ratio have
positive impact on bank’s credit rating at 5% significant level. This result is coincident with the result of the
empirical model in emerging market and empirical studies presented above.
In the group of earning ratios, we notice that there are 3 ratios include NIM ratio, ROAE ratio and the
total expenditure/total income ratio having significant coefficients. NIM ratio has negative impact on bank’s
credit ratings. This result is the same as the result of Matousek and Stewart (2009). In the emerging markets, the
24
levels of deposit interest rate and lending interest rate are lower than these of developed markets. So that the
negative impact of NIM on bank’s credit ratings may be caused by the difference in risk and level of interest
rates.
We also notice that the net loan/total assets ratio has positive impact on bank’s credit ratings. This result
is agreed with many previous empirical studies. Matousek and Stewart (2009) indicate that the liquidity
assets/total assets has negative impact on bank’s credit ratings. Because the bank which face difficuties in capital
mobilization must maintain more liquidity assets. This also reduce the bank’s profitabilies.
4.6.3 Analyzing the difference in impact of affecting factors on bank’s credit rating between developed
markets and emerging markets
4.6.3.1 The difference in impact of systematical factors on bank’s credit ratings between developed markets
and emerging markets.
The empirical results of the models indicate that credit rating of the country where banks locate have a
stronger impact on bank’s credit rating in emerging markets than in developed markets. Among the factors, the
industry risk only has impact on bank’s credit ratings in emerging markets. Liu and Ferri (2001) also conclude
that economy risk strongly impact on corporation’s credit ratings in emerging markets. But this factor does not
impact on the credit ratings of corporations in developed markets. Williams et al (2013) prove that the countries’
credit ratings are the ceilings of corporations’ credit ratings in these countries.
4.6.3.2 The difference in impact of ownership factor on bank’s credit ratings between developed markets and
emerging markets
The thesis’ results show that international financial group’s ownership has stronger impact on bank’s
credit rating in emerging markets than in developed markets. Meanwhile, the positive impact of government
ownership on bank’s credit ratings in emerging markets is lower than in the developed markets. Mirzaei et al
(2013) indicate that commercial banks belonging to international financial groups have a better profitability in
emerging markets than in developed markets. The reason is when these banks penetrate in the emerging markets,
they can use their advantages in banking technologies and innovation services to compete with domestic
commercial banks in order to attain a better profitability. In contrast, when these banks enter the developed
markets their profitability may reduce due to competion with domestic banks in these countries.
4.6.3.3 The difference in impact of scale factor and financial ratios on bank’s credit ratings between
developed markets and emerging markets
The thesis’s result suggest that there is no difference in impact of scale factor on bank’s credit ratings
between developed markets and emerging markets. Otherwise, the average asset growth rate over 3 years has
negative impact on bank’s credit rating in emerging markets. But this ratio has no impact on bank’s credit ratings
in developed markets. The reason of this is discussed in detail in section 4.6.1
Besides, the empirical results show that the impact of the overdue loan/total loan ratio on bank’s credit
ratings is lower in the emerging markets than in developed markets. The cause of this may come from
information asymmetry as explained in previous sections. Suarez (2001) explain that bank’s quality assets ratios
do not reflect the true credit risk of commercial banks due to difference in bank’s accounting standards.
Moreover, bank financial reports in emerging markets are not reliable due to inexact classification of overdue
loans.
25
Next, among the capital capacity ratios, we notice that there is no difference in impact of the equity/total
assets ratio and the equity/net loan ratio on bank’s credit rating between developed markets and emerging
markets. Shen et al (2012) explain that the rating agencies access carefully the impact of capital capacity ratios
on bank’s credit ratings in both high information asymmetry countries and low information asymmetry
countries. Although these ratios are usually not transparent in countries with high information asymmetry. But
the ratings agencies have no other choice and have to classify banks with high capital capacity ratios into high
credit ratings.
Moreover, the impact of bank’s earning ratios (include the total expenditure/total income ratio, Net
interest margin and net return/average total equity ratio) on bank’s credit ratings also reduce in emerging
markets. The information asymmetry in these countries is also the cause of this problem.
Finally, we notice there is no difference in impact of the net loan/total assest ratio on bank’s credit rating
between developed markets and emerging markets.