Financial times guide to technical analysis how to trade like a professional
Bạn đang xem bản rút gọn của tài liệu. Xem và tải ngay bản đầy đủ của tài liệu tại đây (5.94 MB, 244 trang )
About the author
Jacinta Chan is a trader and an equity and futures broker. She
has worked as a senior vice president of derivatives sales and likes
to share the knowledge and skills that she has gained on
professional dealing desks. She is the author of a number of
technical analysis books including Everything Technical Analysis,
published by Prentice Hall.
Contents
About the Author
Acknowledgements
Publisher’s acknowledgements
Preface: what makes an exceptional trader
Some traders’ terms
PART 1 WHAT DO TRADERS KNOW?
Introduction: the market technicians
1 Know the market: how to read and construct charts
2 History has a habit of repeating itself
3 Spot the bubbles and win
4 Follow the winners: trading with the trend
5 The tools that professionals use
6 Leading technical indicators in the market
7 The profit opportunities
8 Wave after wave
9 Booms and busts: risks and returns
10 The secret
Conclusion: leave the random walkers busy with their arguments
– the market technicians are busy making money
PART 2 TRADING WITH PROFESSIONAL
TECHNICAL SYSTEMS
Introduction: the trading game plan
11 Technical indicators to use
12 Principles of a technical algorithm trading system
13 Understanding market characteristics and what to do
14 Simple formulas to design your own trading models
15 Programming trading rules into your system
16 How to write a good trading plan
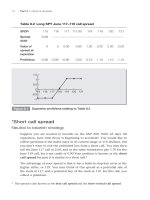
17 Losing a little to gain your capital
18 Practise stop loss
19 Fine tuning the trading wheel
20 The total trader – winning trading psychology
Conclusion: the complete trading set-up kit
Getting started
Glossary
Bibliography
Index
Acknowledgements
The body of technical analysis knowledge did not happen
overnight. It is built up over a century by great traders and
technicians who have put together their knowledge to form what
we know today as technical analysis. Therefore, the first
acknowledgement goes to the founder of technical analysis,
Charles Dow, whose observations still hold true today and benefit
many traders such as myself. There are many great contributors to
technical analysis, too many to be mentioned individually here.
However, there are some authors whose works must be mentioned:
H.M. Gartley (1935) for Profits in the Stock Markets, Richard Arms
Jr. (1999) for Profits in Volume: Equivolume Chart and Gerald
Appel, the originator of Moving Average Convergence and
Divergence (MACD). One of the greatest technical indicators
contributor of all time is Welles Wilder, the author of New
Concepts in Technical Trading Systems and originator of the
Resistance Strength Index (RSI), Directional Movement Index
(DMI) and Parabolic Stop-And-Reverse (Parabolic SAR). Other
leading technical indicator contributors whose works are
mentioned here are George Lane, the originator of Stochastics;
Woods, Vignolia and Granville, the developers of On Balance
Volume; and Ralph Elliott, the originator of Elliott Waves. Other
great technical analysis teachers of all time whose work greatly
influenced my thesis and work are John Bollinger (Bollinger on
Bollinger), Larry Williams (The Definitive Guide to Futures Market
(Volumes I and II)) and Perry Kaufman (Trading Systems and
Methods).
Credit is to be given to Equis International whose Metastock
software is very useful for profit analysis.
This book did not happen overnight either. It took the efforts of
many individuals from different backgrounds and parts of the
world whom I have come to know as friends over the years. I thank
Dr. Noor Azlinna Azizan for going through this book. I thank
Christopher Cudmore, my commissioning editor, for publishing
this book and all the team at Pearson Education. I thank all my
friends, my colleagues, clients and readers whose support make my
books bestsellers. I thank all my family, especially my parents,
Chan Kok Heong and Yap Chin Tuck for their love and support.
Lastly and most importantly, I thank God for all these wonderful
family, friends, colleagues, clients, editors and the great teachers of
technical analysis who contribute to the success of this book.
Jacinta Chan
Publisher’s acknowledgements
We are grateful to the following for permission to reproduce
copyright material:
The Financial Times
Figure 1.0 from FTSE100,
Figure 1.1
from FTSE100,
Figure 1.3
from FTSE100,
Figure 1.5
from FTSE100,
Figure 1.10
from FTSE100,
Figure 2.1
from Nikkei 225
Figure 2.2
from DJIA, />Figure 2.3 from SSE,
Figure 2.4
from ASX 200
Figure 2.5
from ASX200,
Figure 2.6
from ASX, />Figure 2.7 from
Figure 2.8
from Hang Seng
Figure 2.9
from Nikkei 225,
Figure 2.10
from ASX200,
Figure 2.11
from Figure
2.12 from DAX,
Figure 2.13
from CAC40,
Figure 2.14
from Nasdaq,
Figure 2.15
from Eurofirst300
Figure 2.16
from Dax, />Figure 3.1 from Hang Seng,
Figure 3.2
from Hang Seng,
Figure 3.3
from Hang Seng,
Figure 3.4
from Hang Seng,
Figure 3.5
from Hang Seng,
Figure 4.1
from Nikkei 225,
Figure 4.2
from Nikkei 225,
Figure 4.3
from Nikkei 225,
Figure 4.4
from Nikkei 225 using Moving Aver,
Figure 4.5
from Nikkei 225,
Figure 4.6
from Nikkei 225,
Figure 4.7
from Nikkei 225,
Figure 4.8
from Nikkei 225,
Figure 5.1
from S&P 500,
Figure 5.2
from S&P 500,
Figure 5.3
from S&P 500,
Figure 6.1
from S&P 500,
Figure 6.2
from S&P 500,
Figure 6.3
from S&P 500,
Figure 6.4
from S&P 500,
Figure 6.5
from S&P 500,
Figure 6.6
from S&P 500,
Figure 7.1
from FTSE 100
Figure 7.2
from FTSE 100
Figure 7.4
from FTSE 100
Figure 9.1
from FTSE 100
/>In some instances we have been unable to trace the owners of
copyright material, and we would appreciate any information that
would enable us to do so.
Preface: what makes an exceptional
trader
Investment is a fascinating subject that has intrigued many over
the centuries. It amasses fortunes for some, loses millions for
others. In today’s fast-moving financial markets, more fortunes are
made and lost than ever before, and in record time.
To be a savvy investor, you need the extra proven edge to ensure
that your investments grow at the expense of uninformed
investors. In order to make it in this game, you will need a
statistical trading edge that has been proven to generate net
abnormal returns in the long run. You will need a tool to gain this
statistical trading edge and the tool is simply your very own
mechanical trading system.
This book is a guide to a trader’s journey in search of that ‘ideal’
algorithm trading system that gives you this statistical trading
edge, one that can decipher market patterns and detect trends to
generate net abnormal returns in the long run.
The Financial Times Guide to Technical Analysis is a trader’s
guidebook, written by a trader for traders – and you can become a
successful one too. It is hoped that all traders will benefit from the
book’s content. Using the same concepts and principles as those
used by financial institutions, the book places retail investors on
level ground with institutional traders. It guides them to make
abnormal returns with their own technical professional trading
systems.
This book is about how you can be a smarter investor, one who
grows capital in the stock and futures markets. It is about how you,
the smart amateur investor, take control of your financial future in
all the financial markets. This book will show you how to assess
the markets technically and time your investment in a way that lets
your capital grow while limiting your losses all the way.
You will see how some successful professionals make profits
consistently with technical analysis techniques and formulas, and
learn how to apply the concepts and principles that professional
traders use. You will also be exposed to insider knowledge and
concepts from behind the trading desks of financial institutions.
The Financial Times Guide to Technical Analysis consists of two
parts. The first part – What do traders know? – is an introduction
to technical analysis. This basic level introduction is written for
investors who are new to technical analysis. It gives new traders an
overview of the tools that are available in technical analysis and
guidance on how to use them.
The second part – Trading with professional technical systems –
concentrates on the strategies used in trading. This advanced level
is written for serious investors who are willing to commit time,
money and endurance to trade profitably. It analyses a particular
trading system – BBZ – and related trading plans, strategies and
risk control management. It gives instructions to traders on how to
develop and optimise a trading system; and it shows how simple
moving average and standard deviations can be used for model
building.
Objectives
The purpose of compiling this book is to ensure that you gain a
comprehensive understanding of the tools used by traders.
Therefore, one of our objectives is to explore some simple trading
techniques from a selection of technical analysis tools to design
and build mechanical trading systems. The ultimate aim is to
develop you, the reader, into a good trader.
My aim is that anyone who picks up this book will be able to apply
the tools and techniques easily. This book condenses the most
important investment principles of a full three-year undergraduate
finance course into those relevant to the trading practitioner
dealing in today’s markets. You do not need to go through three
years of a full-time finance course to become a professional trader,
just start by reading this book.
Important points to remember
What marks an exceptional trader from an average trader is a
proven statistical trading edge of producing positive net returns in
the long run. An exceptional trader is not born with a natural
gaming talent to time purchases and sales. Rather he or she is
someone who is an extremely keen observer of market price
patterns. The exceptional trader does his or her homework by
researching the markets and backtesting a technical trading
system. Anyone can be an exceptional trader if he or she dedicates
and commits the time to study and practise technical analysis in
the science of trading. This book aims to develop an exceptional
trader – you.
The FT Guide to Technical Analysis provides the basic foundations
of technical analysis and trading systems. It explains the concepts
of technical indicators in the research, design and backtesting of a
mechanical trading system. The book begins by looking at the
behaviour of market prices and introduces technical analysis to
these price patterns. The second part of the book is on trading and
the trading systems that professional traders use. These cover the
complete subject of technical analysis and trading at beginner and
intermediate levels. No prior knowledge is required.
The book introduces insiders’ concepts and principles on becoming
a professional trader. The approach is of a mentor professional
trader guiding a favourite apprentice in the fine science of trading
with technical analysis. These insider concepts and principles are
simple and effective and they can easily be learnt and applied.
Before investing in anything, at any time, home- and groundwork is
a must. This book helps in guiding you through that basic,
essential, background work. It is dedicated to showing you how to
time the purchase and sale of financial instruments in a way that
makes your capital grow in the long run. It aims to fill the gap
between the shortcomings in further and higher financial
education and the vast, complex markets that confront us all.
So, this book is for anyone who wants to do better in the financial
markets, especially the stocks and futures markets. It is for those
who want a greater understanding of the stock and futures
markets, enabling them to manage their investments better by
controlling their risks.
Why you need to know technical analysis
to trade
Technical analysis is the study of price patterns to identify trading
opportunities; it is about charting data and interpreting charts
using technical tools and techniques. These techniques are instilled
into formulas which are called mechanical trading systems in
accordance with specific trading plans. Good trading plans
encompass the estimations of traders’ rewards and risks. Very good
trading plans specify the strategies for entry and risk control
management. Essentially, good trading plans are part of good
money management.
Technical analysis, one of the most important investment subjects,
is what every investor needs to learn before making any trading
decisions, especially in regard to the timing of a purchase or sale of
any financial asset. Every wise investor knows that each financial
market has its own cycles, and making abnormal, exceptional
profits is all about knowing and following the patterns of these
seasons.
This book is all about guiding the average investor to use the right
technical indicators to detect these timings in order to make
exceptional profits. It is about how you can distinguish yourself
from the crowd and make exceptional profits using not only the
given tools in this book but also tools that you, yourself, have
invented.
The Financial Times Guide to Technical Analysis will appeal to
anyone interested in the stock and futures markets. It is a succinct
professional trading guide for the individual serious investor,
whether an amateur or someone with some knowledge of
investment. It begins with a guided tour of the world of investing
and gives practical advice on trading opportunities and the
corresponding appropriate strategies using well-known and newly
innovated technical analysis concepts.
How to use this book
The book is written in an easy to read technical traders’ language,
for anyone who wants to find the extra edge to trading. It begins
with some traders’ terms that you need to become familiar with to
get a basic overview of this book’s subject matter. (These terms are
also covered in the glossary at the end of the book.)
You will notice that each chapter begins with two short sections:
What topics are covered in this chapter?
What are the objectives?
A brief background introduction sets the scene and the important
points are then clearly laid out, followed by in-depth discussion and
trading examples and exercises where necessary. The chapter’s
concepts are summed up in a chapter review for quick revision.
Finally, in ‘A Note to the trading apprentice’ I list some of my
observations, theories and trading experiences, often as a caution
on where not to tread and when not to trade.
My main note to the trading apprentice – you – is that trading is
not an art but a serious profession that can be learnt and applied
profitably. Technical analysis is a quantitative science with proven
functional theorems that every trader can use. You too can start
trading for a living. If at the end of this book you can trade
professionally, this guide will have achieved its objective.
It is my hope that after reading this book, you will trade the
markets in a different way – a more professional way. It is your
personal responsibility to learn trading as a profession and this
book will help you towards this goal. I aim to show the way that
professional traders play this game, so read this book with an open
mind and follow each step carefully. One day soon, using the
concepts that I have laid out here, you may be building better
trading models than the ones in this book. When that day comes,
this book will have achieved its purpose. I would be delighted to
learn about and discuss your trading model with you if you email
me at
All the best in your trading.
Jacinta Chan
Neither the author nor the publisher can accept responsibility for
any loss occasioned to any person who either acts or refrains from
acting as a result of any statement in this book. Readers should
note that the author is not recommending the purchase or sale of
any particular financial security: references to companies are
made for illustration.
Some traders’ terms
Analysis
Fundamental analysis The study of economic information to
forecast prices and to gauge if an asset is overvalued or
undervalued. It is an analysis of current economic conditions to
calculate the fair value and forecast the future price of an asset.
Technical analysis The study of price movements using past
prices, volume and open interest to identify trading opportunities.
It is an analysis of historical price data to identify price trends.
Technical analysis includes a variety of techniques such as chart
analysis, pattern recognition, seasonality and cycle analysis, and
algorithm technical trading systems.
Chart analysis
Chart A graphical record of prices and volume, taken at regular
intervals.
Close/closing price The last trade price for the period.
High The highest price traded for the period.
Low The lowest price traded for the period.
Open/opening price The first traded price for the period.
Open interest The number of futures contracts that have been
opened and have not been closed. The amount of futures contracts
that are still open and in existence.
Volume The number of contracts/shares traded for the period.
Technical indicators
Bands Lines constructed around a moving average that define
relative high and low.
Bband Z-test statistics (BBZ) A technical trading system that
uses as a default one standard deviation around a default 21-day
moving average (to give a long signal above the one standard
deviation band and a short signal below the one standard deviation
band).
Absolute range breakout A technical trading system that
indicates a buy signal when the close is above the high of the
previous number of days and a sell signal when the close is below
the low of the previous number of days.
Moving average (MA) The measure of the average price over the
previous periods that is recomputed each succeeding period using
the most recent data.
Moving average convergence and divergence (MACD) An
indicator that uses the difference between a 12-day and a 26-day
moving average to indicate a buy signal if the difference is more
than the average difference of the previous nine days and a sell
signal if the difference is less than the average difference of the
previous nine days.
Optimised Bband Z-test statistics (OptBBZ) A technical
trading system that uses optimised parameters for standard
deviation and moving average (to give a long signal above the
optimised standard deviation band and a short signal below the
optimised standard deviation band).
Trading range terms
Trading range A price range in which trading has been confined
for an extended period. Generally sideways in character.
Trading range system A trading system that tries to sell at the
resistance and to buy at the support on the assumption that the
market will pull back at the resistance and support levels.
Resistance An area on a chart above the current price where
identifiable trading has occurred before. It is believed that
investors who bought at those higher prices will become sellers
when those prices are reached again, thus halting an advance.
Support An area where declines are halted and reversed. Support
is often associated with perceived value.
Trading trend terms
Algorithm trading system A trading system with a set of trading
rules that mathematically computes according to an algorithm
(suitable to the prevailing market conditions) mechanically
generated signals (long, short or out-of-market) indicating when to
enter and when to exit, and executes the trades automatically.
Algorithmic trading (or automated or algo, or black box or robo
trading) is the computer program that executes trades according to
an algorithm that is suitable to prevailing market conditions. The
algorithm in the program is derived after intensive backtesting and
optimisation. Algorithm trading programmes are popularly
employed by professional model trading desks of large financial
institutions.
Trend trading system A trading system with a set of trading
rules that defines when to initiate a position early to capture the
prevailing trend using a mechanically generated signal on the
assumption that the trend will continue. Moving average and
standard deviation are technical indicators used in trend trading
systems.
Downtrend A state in which prices are steadily declining.
Uptrend A state in which prices are steadily increasing.
Tests
Backtest The process of testing using historical data.
Optimisation The process of finding the best performing
parameter for a trading system.
Parameter A value assigned to a trading system to vary/optimise
the timing of the signal.
Theories
Dow theory An observation (initially by Charles Dow) which
states that:
The averages must confirm each other.
The averages discount everything.
The market has three movements.
The major trends have three phases.
Volume must confirm trend.
A trend continues until the signal reverses.
Elliott wave theory An observation (initiated by R. N. Elliott)
which states that all market activities develop into well-ordered
patterns consisting of five primary impulse waves followed by three
correction waves.
Fractal geometry An observation (initially by Benoit
Mandelbrot) which states that there are repeating patterns in
nature including time series.
Random walk theory An observation (initially by Eugene Fama)
which states that the history of the series cannot be used to predict
the future in any meaningful way and that the future path of the
price of a security is no more predictable than the path of a series
of cumulated random numbers (Fama, 1965).
Trading terms
Fill Getting the order done.
Long The state of owning a security.
Short The state of being short a security. The act of selling before
buying.
Rollover The closing of the front month’s position and the
opening of the next month’s position.
Slippage cost The cost of the difference between the theoretical
execution price and the actual price executed due to poor fill.
Volatility The tendency for prices to vary. Standard deviation and
variance are measures of volatility.
Whipsaw A period of wrong signals that result in losses
part 1
What do traders know?
Introduction: the market technicians
Professional traders are market technicians who are financial
experts in the practical science of trading. Today’s market
technicians usually use technical analysis to trade in the financial
markets they specialise in. They use price charts and technical
analysis tools to make trading decisions.
Before they trade, traders have trading plans. These plans are their
special trading edge. Their trading edge charts the future of their
trading experience to be that of net positive return. Therefore, their
trading plans are usually based on historical patterns of statistical
price returns. They plan their trading before they begin and they
begin with research.
Strange as it may seem, many people who are trading in stocks and
futures do not know what they are doing. They repeatedly lose
money and they do not even know why. The most common reason
is that they fail to cut their losses early and even after a loss has
been cut they cannot even contemplate why they have lost.
This book is arranged in topics to cover everything that the trader
needs to make it as a professional. Anyone can be a trader but only
those who have undergone and passed professional technical
training and are trading seriously can be a professional trader.
In the author’s experience, the topics that are important in the
science of trading have their foundations in technical analysis,
which can be viewed as the cornerstone of professional trading.
The topics that are important in basic technical analysis are:
charts
classical reversal and continuation patterns
gaps
trends
moving averages
momentum
range breakouts
projection levels
risk and returns
the trading system.
This introduction defines the market technician who is a trader in
terms of Dow theory and trading.
The learning objectives of this part are to guide you, step by step,
to:
learn how to construct and read your own chart
identify reversal and continuation chart patterns
spot bubbles and gaps, and then follow the trend winners
construct common technical indicators like moving average
and put them to use in your trading
identify the profit-making opportunities and the possible
projection of how far the trend will carry
learn the basics of a trading system.
Firm foundations
The first foundations of technical analysis were laid by Charles
Dow in a series of Wall Street Journal editorials in the late 1800s
and early 1900s. Charles Dow, the editor, founder and part owner
of the Wall Street Journal and the creator of the Dow Jones Index,
penned his observations and analysis of the US stock market in a
series of Review and Outlook editorials in the Journal. His
observations and analysis were later called the Dow theory.
The layout of Part 1
Dow theory
Dow theory covers six basic tenets that form the foundations of
technical analysis:
1. The averages (industrial and transportation) must confirm
each other.
2. The averages discount everything.
3.
4.
5.
6.
The market has three movements.
The major trends have three phases.
Volume must confirm trend.
A trend continues until the signal reverses.
The market’s three movements are:
1. primary movements (lasting for years)
2. secondary correction movements (lasting for months) and
3. daily fluctuations.
Chart showing accumulation, uptrend, excess,
distribution, downtrend and despair
Source: From FTSE 100,
/>In a bull primary movement, the three phases are:
1. accumulation
2. big up move (uptrend) and
3. excess.
In a bear primary movement, the three phases are:
1. distribution
2. big down move (downtrend) and
3. despair.
Usually the beginning of the uptrend or downtrend is confirmed by
a rising volume. This trend continues until the signal shows
reversal and the signal can be obtained from the averages.
Traders’ terms – technical analysis
Technical analysis basically consists of four important concepts.
1.
2.
3.
4.
price–volume relationships
trading ranges
trend identification and
buy and sell signals.
Rising volumes with rising prices confirm an uptrend while rising
volumes with falling prices confirm a downtrend. The market is
said to be range trading if it trades between support and resistance.
Scalpers and day traders looking for very short-term profits buy at
points where they perceive there is support and sell where there is
resistance. However, trend traders look for confirmation of a
downtrend on the breaking support level to sell and an uptrend on
the breaking resistance level to buy.
Basically, all these concepts apply in trading. These concepts take
the forms of different technical indicators such as moving averages.
This book is organised to cover these concepts in the order price–
volume relationships, trading ranges, trend identification and
mechanical trading signals.
Review
The first foundations of technical analysis were laid by Charles
Dow about a century ago. They were later known as Dow theory
and cover six basic tenets:
The averages must confirm each other.
1.
2.
3.
4.
The averages discount everything.
The market has three movements.
The major trends have three phases.
Volume must confirm trend.