Studies of the perception of respondents regarding KVK training intervention in agriculture
Bạn đang xem bản rút gọn của tài liệu. Xem và tải ngay bản đầy đủ của tài liệu tại đây (548.85 KB, 16 trang )
Int.J.Curr.Microbiol.App.Sci (2019) 8(2): 1275-1290
International Journal of Current Microbiology and Applied Sciences
ISSN: 2319-7706 Volume 8 Number 02 (2019)
Journal homepage:
Original Research Article
/>
Studies of the Perception of Respondents regarding KVK Training
Intervention in Agriculture
Sabyasachi Karak1*, Subhajit Roy1 and Siddhartha Dev Mukhopadhyay2
1
Department of Agricultural Extension, Faculty of Agriculture, Bidhan Chandra Krishi
Viswavidyalaya, Mohanpur, Pin code- 741252, Nadia, West Bengal, India
2
Department of Agricultural Extension, Palli Siksha Bhavana, Institute of Agriculture, VisvaBharati University, Sriniketan- 731236, Birbhum, West Bengal, India
*Corresponding author
ABSTRACT
Keywords
Perception,
Training,
Interventions
Article Info
Accepted:
12 January 2019
Available Online:
10 February 2019
The present study was executed in Palli Siksha Bhavana, Institute of Agriculture, VisvaBharati University in the year 2016-17. KVK generally deals with training programmes
related to needy areas to be served to both men and women. The Subject Matter Specialists
are deputed to other KVKs, Agricultural Universities, ICAR institutes and other training
institutes to orient themselves with the subject. The objective was to study the perception
of respondents regarding KVK intervention in agriculture. As Ban and Hawkins (2000)
define perception as the process by which we receive information or stimuli from our
environment and transform it into psychological awareness. It is interesting to see that
people infer about a certain situation or phenomenon differently using the same or
different sets of information. In the present research work the word “Perception” refers to
the understanding/comprehension of farmers make about different components of training
like the extent of awareness, knowledge and skill developed through KVK training, few
broad areas have been considered on which trainings have been imparted by Nadia Krishi
Vigyan Kendra.
Introduction
Krishi Vigyan Kendras generally deal with
training programmes related to needy areas to
be served to both men and women. The type
of courses covered are usually package of
practices for various cereals, pulses, oilseeds,
vegetable and fruit crops, fertilizer
management,
plant
protection,
farm
mechanization, care and feeding of animals,
sheep and goat keeping, poultry farming,
pisciculture,
irrigation
and
water
management, soil and moisture conservation,
income generating activities, farm planning,
marketing of produce etc. To impart training
efficiently, KVKs very often engaged more
specialised persons. The training programmes
are further intended to cover backward areas
and weaker sections on the priority basis. But
how can be the impact of KVK’s can be
measured? Understandably it’s a huge
institution spread over the country training on
1275
Int.J.Curr.Microbiol.App.Sci (2019) 8(2): 1275-1290
public fund. Has it show positive impacts in
terms of well trained farming community able
to able latest agricultural technologies in their
field which in turn expected to increase the
production and productivity of crops and
lands. But there was an attempt for changing
agricultural matrix of the country through
application of S and T inputs; farmers’
perception played an important role in
accepting and adopting those S and T inputs
in their field. Resultantly it is fund that almost
there are no dearth improved technologies but
the adoption rate of the same is not up to the
level of expectation. Some logic is also
pertinent in case of KVK’s efforts in
imparting awareness, knowledge and skill
among farmers on various aspect of farming.
How do farmers perceive the KVK’s as well
as the usefulness of their efforts. To ascertain
the extent of awareness, knowledge and skill
developed through KVK training, few broad
areas have been considered on which
trainings have been imparted. These are
Knowledge and Skill development about
agricultural technologies; Knowledge and
Skill development for Income generating
activities; Knowledge and Skill development
about
Better
livestock
Management;
Knowledge and Skill development about
Farm Mechanisation; Knowledge and Skill
development about New Technologies;
Knowledge and Skill development about
Improvement of overall Socio-economic
Condition. Under each broad area sets of
statements have been framed.
Materials and Methods
Research is a systematic attempt to obtain
answers to meaningful questions about
phenomena or events through the application
of scientific procedure. It is an objective,
empirical, logical analysis and recording of
controlled observations that may lead to the
development of generalisations, principles or
theories resulting to some extent in prediction
and control of events out of consequences in
case of specific phenomena. Research is
therefore, scientific and as such not satisfied
with isolated facts, but seeks to integrate and
systematise its findings. The chapter deals
with the research methods and procedures
followed by the researcher to analyze the
problem in the course of investigation. The
entire discussions have been made under the
following sub-themes.
Plan of work
Considering wide and varied application of
the study, it was felt that detailed survey of all
aspects related to the objectives should be
framed for the study. Keeping the stipulated
period in view, the area of investigation,
sample size, problem and method of analyses
of data, a rough plan was prepared prior to
actual
investigation
and
finalized
subsequently.
Research design
A research design is the programme that
guides the researcher in the process of
collecting, analysing and interpreting
observations to draw inferences. Keeping in
view the objective of the study, the researcher
tried to include qualitative and behavioural
attributes in the study. The present research
study comes within the purview of survey
research mainly of “Ex-post facto” in nature.
In the light of the objectives and scope of the
study, decisions were taken on the techniques
of investigation, research materials and tools
to be used and patterns of statistical analysis
to be incorporated.
Locale of the study
The study was proposed to be conducted in
three blocks in Nadia district in West Bengal.
Under these three blocks six villages are taken
for this research.
1276
Int.J.Curr.Microbiol.App.Sci (2019) 8(2): 1275-1290
Sampling procedure
Purposive as well as simple random sampling
techniques were adopted for the study. For
selection of district and block purposive
sampling techniques was adopted and in case
of selection of respondent’s simple random
sampling technique was taken up covering to
a total sample of 120 respondents to be
selected as respondent for the present study a
farmer was required to be attending KVK
training at least for last three years.
Sampling Frame
West Bengal
Nadia
Kalyani Subdivision
Harighata Block
Ranaghat Subdivision
Chakdaha Block
Ranaghat II
Bhabanipur Village (20)
NutangoraVillage(20)
PatuliVillage(20)
Satyopol Village(20)
Banamalipara (20)
PanchberiaVillage(20)
Statistical analysis
Percentage
Percentage was used in description analysis
for making simple comparison between two
responses. For calculating percentage, the
frequency of a particular cell was multiplied
by 100 and divided by the total number of
respondents in the particular category to
which the cell belonged.
central tendency. It is used summarily on the
essential features of a series and in enabling
data to be compared. Mean is better than other
averages especially in social and economic
studies
where
direct
quantitative
measurements are possible.
Where
x= the symbol used for mean, Σ =
Summation, xi = Values of ith item, n =
Number of respondents.
Calculation of score index
Mean score
It is defined as the sum of observations
divided by number of observations. Mean is
the simplest and relatively stable measure of
It is also another score gap analysis where the
obtainable scores of each of the respondents
on a variable were calculated to categorize
them in to four categories as given below,
1277
Int.J.Curr.Microbiol.App.Sci (2019) 8(2): 1275-1290
Factor analysis
Factor is a method of multivariate analysis
and is often used as a method of data
reduction. The different steps of factor
analysis have been employed in study are as
follows:
i.
ii.
iii.
Correlation Matrix is used as a primary
data for factor extraction
Variables which have Eigen value more
than 1 are selected as components.
Varimax type of Rotation of orthogonal
Rotation with Kaiser Normalization is
applied as a method of rotation.
Regression analysis
Y = a + b1 x1 + b2 x2 +...................... + bnxn
Where,
Y = dependent variable, a = a constant, b1 =
partial regression
coefficient,
x1
=
independent variables, n = total numbers of
independent variables.
Multiple Regression Analysis
Y =a+b1X1+b2X2+----------+bkXk
Where,
a is the intercept (i.e. the value of Y)
When all X are 0 and b (1-------k) are the
partial regression coefficients associated with
the independent variables Xi, represents the
amount of change in the Y for each unit in Xi.
Step wise multiple regression
The step wise regression procedure computes
a sequence of regression equations, at each
step adding and deleting independent
variables. Let the procedure starts with an
explanatory variable, say X1, then it enters
X2 using the forward selection procedure.
After X2 is entered, it looks at X1 and
decided whether to retain it or not by looking
at F-value of X1. If it is retained, it enters the
next variables, say X3. After X3 is entered, it
looks again at the F-values for variables, X1
and X2, and deletes any variables which are
super flows. The procedure requires F-values.
The F-value which determines the addition of
variables and the F-value which determines
the variables to delete.
Results and Discussion
Perception of respondents about KVK
training in increasing knowledge and skill
about agricultural technologies
Table 1 represents the distribution of
respondents against their PI regarding
increase in knowledge and skill about
agricultural technologies. From the table it
can be observed that in Haringhata (17) and
Ranaghat (16) block majority of the
respondents had semi-medium level of
perception about increase in knowledge and
skill followed by high level of perception (12
and 16 respectively).
In case of Chakdaha block majority of the
respondents had high perception about their
increase in knowledge and skill through KVK
trainings (35).
Taking all the blocks together it was found
that majority of the respondents had high
perception about increase in knowledge and
skill through KVK training followed by semimedium and medium level of perception.
Perception of respondents about KVK
training for income generating activity
Table 2 represents the distribution of
respondents against their PI about KVK
1278
Int.J.Curr.Microbiol.App.Sci (2019) 8(2): 1275-1290
training for income generating activity. From
the table it can be observed that in Haringhata
(14) and Ranaghat (15) and Chakdaha (18)
block majority of the respondents had high
perception about KVK training in this regard.
In case of Haringhata (14) and Ranaghat (13)
block the next majority group had medium
level of perception while considering
Chakdaha (14) block majority had semi
medium level of perception in this regard.
Taking all the blocks together it was found
that majority of the respondents had high of
perception about KVK training for income
generating activity index group followed by
semi-medium and medium index group
respectively.
Perception of respondents about KVK
training for better livestock management
Table 3 represents the distribution of
respondents against their PI about KVK
training helpful for farm mechanization. From
the table it can be observed that in Haringhata
(19) and Chakdaha (30) block majority of the
respondents had high perception about KVK
training for farm mechanization followed by
semi-medium level of perception (17,
10respectively).
While in case of Ranaghat (21) block it can be
observed that majority of the respondents had
under semi medium level of perception
followed by high (12) level. Taking all the
blocks together it was found that majority of
the respondents had high level perception
about KVK training for farm mechanization
followed by semi-medium and medium level
of perception.
Perception of respondents about KVK
training on new technology
Table 4 represents the distribution of
respondents against their PI about KVK
training on new technologies. From the table
it can be observed that in Ranaghat (19) and
Chakdaha (22) block majority of the
respondents had high perception of getting
new technologies from KVK training
followed by semi-medium level of perception
(15, 15respectively).
It is also found that in case of Haringhata
block majority of the respondents had semimedium (15) level of perception in this regard
followed by high (14) level of perception.
Taking all the blocks together it was found
that majority of the respondents had high of
perception regarding getting new technologies
form KVK training followed by semi-medium
and medium index group.
Perception of respondents about KVK
training for overall improvement of socioeconomic condition
Table 5 represents the distribution of
respondents against their PI with regard to
KVK training for overall improvement of
socio-economic condition.
From the table it can be observed that in
Haringhata (20) and Chakdaha (26) block
majority of the respondents had high
perception about KVK training in this regard
followed by semi-medium (15 and 13
respectively) level of perception.
And in case of Ranaghat block it can be
observed that majority of the respondents had
semi-medium (18) level of perception
followed by high (13) perception level index.
Taking all the blocks together it was found
that majority of the respondents had high
perception about KVK training for overall
improvement of socio-economic conditions or
the respondents followed by semi medium
and medium level of perception.
1279
Int.J.Curr.Microbiol.App.Sci (2019) 8(2): 1275-1290
Association between changes in knowledge
with other independent variables
32.83% of total variance as observed from
Adjusted R2 value.
To ascertain this association change in
knowledge in crop production, horticulture
and income generation technologies change
index have been considered as the dependent
variables for all three cases. Variables like,
Extent of training received in seed science
(X1), Extent of training received in agronomy
(X2), Extent of training received in
horticulture (X3), Extent of training received
in plant protection (X4) and Extent of training
received in animal husbandry (X5),
Perception of Respondents about KVK
Training in Increasing Knowledge and Skill
about Agricultural Technologies (X6),
Perception of Respondents about KVK
Training for Income Generating Activity
(X7),Perception of Respondents about KVK
Training for Better Livestock management
(X8), Perception of Respondents about KVK
training for Farm Mechanization (X9),
Perception of Respondents about KVK
training on New Technology (X10),
Perception of Respondents about KVK
training for overall Improvement of SocioEconomic Condition (X11) have been taken
as the independent variables.
To have more accurate prediction stepwise
regression (forward selection method) was
also conducted and result is presented in table
6.1. From the table it can be observed that
only two variables, namely, Extent of training
received in Seed science and Extent of
training received in Agronomy were retained,
both were found having significant positive
relation with change in knowledge in crop
production technologies.
Multiple regression and stepwise regression
(wherever necessary) were conducted. Results
are presented in following tables.
Change index knowledge
production technologies
in
crop
Regression analysis change in knowledge in
crop production technologies
From table 6 it can be observed that only two
variables, namely, Extent of training received
in Seed science (x1) and Extent of training
received in Agronomy (X2) had positive and
significant association with change in
knowledge index. The model only explained
Change index knowledge in horticultural
technologies
Regression analysis change in knowledge in
horticultural technologies
From the table 7 it can be observed that only
two variables, namely, Extent of training
received in Seed science (x1), extent of
training received in Animal husbandry (X5)
and extent of training received in Perception
of respondents about KVK training on New
Technology (X10) had positive and significant
association with change in knowledge index.
The model only explained 47.92% of total
variance as observed from Adjusted R2 value.
To have more accurate prediction stepwise
regression (forward selection method) was
also conducted and result is presented in table
7.1. From the table it can be observed that
only five variables, namely, extent of training
received in Seed science, extent of training
received in Animal husbandry, extent of
training received in Animal husbandry,
perception of respondents about KVK training
for Income Generating Activity, perception of
respondents about KVK training on New
Technology and Perception of Respondents
about KVK training for overall Improvement
of Socio- Economic condition were retained,
both were found having significant positive
1280
Int.J.Curr.Microbiol.App.Sci (2019) 8(2): 1275-1290
relation with change in
horticultural technologies.
knowledge in
Change index knowledge
generating activities
in
regression have been conducted. The results
are presented below.
income
Multiple regression analysis for change in
adoption crop production technologies
Regression analysis change in knowledge in
income generating activities
From the table 9 it can be observed that four
independent variables, namely Extent of
training received in seed science (X1), Extent
of training received in animal husbandry (X5),
Perception of Respondents about KVK
Training in Increasing Knowledge and Skill
about Agricultural Technologies (X6),
Perception of Respondents about KVK
Training for Better Livestock management
(X8) had significant and positive association
with the change in adoption of crop
production technologies.
From the table 8 it can be observed that only
two variables, namely, Extent of training
received in Horticulture (x3), extent of
training received in plant protection (X4) and
extent of training received in agronomy (X2)
had positive and significant association with
change in knowledge index. The model only
explained 52.37% of total variance as
observed from Adjusted R2 value.
To have more accurate prediction stepwise
regression (forward selection method) was
also conducted and result is presented in table
8.1. From the table it can be observed that
only four variables, namely, Extent of training
received in Horticulture, extent of training
received in Plant protection, Extent of training
received in Agronomy and Perception of
respondents about KVK training in Increasing
Knowledge and Skill about Agricultural
Technologies were retained, both were found
having significant positive relation with
change in knowledge in income generating
activities.
Ascertaining the association of change in
adoption of technologies with other
independent variables
For this section, like change in knowledge
portion, three broad aspects like, Crop
production
technologies,
Horticulture
production
technologies
and
Income
generating activities have been considered as
dependent variables. Same set of independent
variables have been considered as dependent
variables. Multiple regression and stepwise
Step wise regression results as depicted in
table 9.1 showed that two variables only
retained in the model, having significant
positive association with the change in
adoption pattern of crop production
technologies. The analysis explained 72.54%
of the total variance.
Multiple regression analysis for change in
adoption horticultural technologies
From the table 10 it can be observed that four
independent variables, namely, Extent of
training received in horticulture, extent of
training received in agronomy (X2),
Perception of Respondents about KVK
Training for Better Livestock management
(X2), Perception of Respondents about KVK
training for Farm Mechanization (X2) had
significant and positive and significant
association with the change in adoption of
horticultural technologies.
Step wise regression results as depicted in
table 10.1 showed that two variables only
retained in the model, having significant
positive association with the change in
1281
Int.J.Curr.Microbiol.App.Sci (2019) 8(2): 1275-1290
adoption pattern of horticultural technologies.
The analysis explained 72.89% of the total
variance.
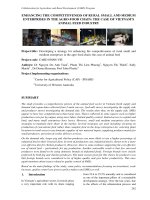
Seed science
Scree Plot of C1, ..., C11
1.4
1.2
Multiple regression analysis for change in
adoption in income generating activities
Eigenvalue
1.0
From the table 11 it can be observed that
seven independent variables, namely Extent
of training received in horticulture.
0.8
0.6
0.4
0.2
0.0
1
Extent of training received in seed science
(X1), Extent of training received in plant
protection (X4),
Extent of training received in animal
husbandry (X5), Perception of Respondents
about KVK Training for Income Generating
Activity (X7), Perception of Respondents
about KVK Training for Better Livestock
management (X8), Perception of Respondents
about KVK training for Farm Mechanization
(X9) had significant and positive association
with the change in adoption in income
generating activities.
As the multiple regressions analysis explained
more that 73% of the total variance, result of
step wise regression was not found better in
this case and hence excluded from the
purview of analysis.
2
3
4
5
6
7
8
9
10
11
Factor Number
On the basis of factor loadings two factors
with highest loadings have been selected. It is
found from the table 12 that Factor 1 is
primarily anchored by six variables namely,
family members, cosmoploiteness, media
exposure, social participation, land holdings
and annual income. Factor 2 is found to be
anchored by age, education, family members,
cosmopoliteness, land holdings and material
possessions. Factor 3 is anchored by media
exposure. Factor 4 is mostly represented by
education, family education and social
participation. Factor 5 is anchored by age,
family education and material possession.
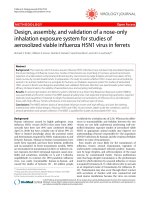
Agronomy
Scree Plot of C1, ..., C11
1.75
Association of different factors with extent
of training received in different broad
areas
Eigenvalue
1.50
For these section five broad areas, namely,
Seed Science, Agronomy, Horticulture, Plant
Protection and Animal Husbandry have been
considered.
Eleven factors have been taken in the factor
analysis separately for each broad area. On
the basis of scree plot dimensionality had
been reduced.
1.25
1.00
0.75
0.50
1
2
3
4
5
6
7
8
9
10
11
Component Number
Scree plot of agronomy
On the basis of factor loadings two factors
with highest loadings have been selected. It is
found from the table 13 that Factor 1 is
1282
Int.J.Curr.Microbiol.App.Sci (2019) 8(2): 1275-1290
Plant protection
Scree Plot of C1, ..., C11
1.75
1.50
Eigenvalue
primarily anchored by seven variables
namely,
education,
family
members,
cosmopoliteness, media exposure, social
participation land holdings and annual
income. Factor 2 is found to be anchored by
age and annual income. Factor 3 is anchored
by media exposure. Factor 4 is mostly
represented by family members, land holdings
and material possession. Factor 5 is anchored
by age, education, family education, social
participation and material possession.
1.25
1.00
0.75
0.50
Horticulture
1
2
3
4
5
6
7
8
9
10
11
Component Number
Scree Plot of C1, ..., C11
Scree plot of plant protection
1.0
Eigenvalue
0.8
0.6
0.4
0.2
0.0
1
2
3
4
5
6
7
8
9
10
11
Factor Number
Scree plot of horticulture
On the basis of factor loadings two factors
with highest loadings have been selected. It is
found from the table 14 that Factor is
primarily anchored by four variables namely,
age, education, family members and income.
Factor 3 is found to be anchored by
cosmopoliteness, media exposure, social
participation and land holding.
On the basis of factor loadings two factors
with highest loadings have been selected. It is
found from the table 15 that Factor 1 is
primarily anchored by seven variables
namely, age, education, family members,
cosmopoliteness, social participation land
holdings and material possession. Factor 3 is
anchored by age, education, family education,
social participation and land holdings. Factor
4 is mostly represented by family members,
cosmopoliteness, and media exposure and
land holdings. Factor 5 is anchored by media
exposure.
Animal Husbandry
Similarly factor four is anchored by family
education and material possession. Factor five
is mostly represented by age and family
education. Factor six is anchored by family
members, media exposure and land holding.
Lastly factor seven is represented by
education,
cosmopoliteness,
social
participation, material possession and annual
income.
1283
Scree Plot of C1, ..., C11
1.75
1.50
Eigenvalue
1.2
1.25
1.00
0.75
0.50
1
2
3
4
5
6
7
Component Number
8
9
10
11
Int.J.Curr.Microbiol.App.Sci (2019) 8(2): 1275-1290
Table.1
(n=120)
Perception Index
(PI)
0-25(Low)
26-50(Med)
51-75(Semi med)
76-100(High)
Haringhata Block
0
11
17
12
Distribution of the Respondent
Ranaghat Block
Chakdaha Block
0
0
8
0
16
5
16
35
Total
0
19
38
66
Percentage
0
15.83
31.66
55
Table.2
(n=120)
Perception Index
(PI)
0-25(Low)
26-50(Med)
51-75(Semi-med)
76-100 (High)
Haringhata Block
0
14
12
14
Distribution of the Respondent
Ranaghat Block
Chakdaha Block
0
0
13
8
12
14
15
18
Total
0
35
38
47
Percentage
0
29.16
31.66
39.16
Table.3
(n=120)
Perception Index
(PI)
0-25(Low)
26-50(Med)
51-75(Semi-med)
76-100(High)
Haringhata Block
0
4
17
19
Distribution of the Respondent
Ranaghat Block
Chakdaha Block
0
0
7
0
21
10
12
30
Total
0
11
48
61
Percentage
0
9.1
40
50.83
Table.4
(n=120)
Perception Index
(PI)
0-25(Low)
26-50(Med)
51-75(Semi-med)
76-100(High)
Haringhata Block
0
11
15
14
Distribution of the Respondent
Ranaghat Block
Chakdaha Block
0
0
6
3
15
15
19
22
Total
0
20
45
55
Percentage
0
16.66
37.5
45.83
Table.5
(n=120)
Perception Index
0-25(Low)
26-50(Med)
51-75(Semi-med)
76-100(High)
Haringhata
Block
0
5
15
20
Distribution of the Respondent
Ranaghat Block
Chakdaha Block
0
9
18
13
1284
0
1
13
26
Total
0
15
46
59
Percentage
0
12.5
38.33
49.16
Int.J.Curr.Microbiol.App.Sci (2019) 8(2): 1275-1290
Table.6
Term
Coef
SE Coef
310
130
Constant
0.927
0.800
(X1) Extent of training received in Seed Science
1.379
0.973
(X2) Extent of training received in Agronomy
0.105
0.524
(X3) Extent of training received in Horticulture
-0.085
0.658
(X4) Extent of training received in Plant Protection
0.19
1.09
(X5) Extent of training received in Animal Husbandry
-0.424
0.491
(X6) Perception of Respondents about KVK Training in Increasing
Knowledge and Skill about Agricultural Technologies
-0.220
0.492
(X7) Perception of Respondents about KVK Training for Income Generating
Activity
-0.492
0.480
(X8) Perception of Respondents about KVK Training for Better Livestock
management
0.315
0.629
(X9) Perception of Respondents about KVK training for Farm Mechanization
-0.005
0.499
(X10) Perception of Respondents about KVK training on New Technology
0.150
0.543
(X11) Perception of Respondents about KVK training for overall Improvement
of Socio- Economic Condition
** Significant @ 5% level
R-sq 43.33%
R-sq(adj)= 32.83%
T- Value
2.38
1.16
1.42
0.20
-0.13
0.17
-0.86
P- Value
0.019
0.049**
0.039**
0.841
0.898
0.862
0.390
-0.45
0.656
-1.02
0.308
0.50
-0.01
0.28
0.617
0.992
0.783
Table.6.1 Results of stepwise regression
Term
Constant
Extent of training received in Seed science
Extent of training received in Agronomy
* Significant @ 1% level
Coef
SE Coef
275.5
63.4
-0.989
0.749
-1.340
0.930
R-sq 43.33%
T- Value
P- Value
4.34
0.000
-1.32
0.009*
-1.44
0.002*
R-sq(adj)= 32.83%
Table.7
Term
Coef
SE Coef T- Value
-110
176
-0.63
Constant
2.10
1.08
1.94
(X1) Extent of training received in Seed Science
-0.25
1.31
-0.19
(X2) Extent of training received in Agronomy
0.033
0.707
0.05
(X3) Extent of training received in Horticulture
-0.563
0.890
-0.63
(X4) Extent of training received in Plant Protection
2.45
1.47
1.67
(X5) Extent of training received in Animal Husbandry
0.095
0.663
0.14
(X6) Perception of Respondents about KVK Training in
Increasing Knowledge and Skill about Agricultural Technologies
-1.140
0.665
-1.72
(X7) Perception of Respondents about KVK Training for Income
Generating Activity
0.341
0.649
0.53
(X8) Perception of Respondents about KVK Training for Better
Livestock management
0.271
0.850
0.32
(X9) Perception of Respondents about KVK training for Farm
Mechanization
0.724
0.674
1.07
(X10) Perception of Respondents about KVK training on New
Technology
0.958
0.734
1.31
(X11) Perception of Respondents about KVK training for overall
Improvement of Socio- Economic Condition
** Significant @ 5% level
R-sq = 56.32% R-sq(adj)= 47.92%
1285
P- Value
0.532
0.045**
0.847
0.963
0.528
0.037**
0.887
0.089
0.600
0.751
0.015**
0.095
Int.J.Curr.Microbiol.App.Sci (2019) 8(2): 1275-1290
Table.7.1 Results of Stepwise Regression
Term
Constant
Extent of training received in Seed science
Extent of training received in Animal husbandry
Perception of Respondents about KVK Training for Income
Generating Activity
Perception of Respondents about KVK training on New
Technology
Perception of Respondents about KVK training for overall
Improvement of Socio- Economic Condition
* Significant @ 1% level, ** Significant @ 5% level
Coef
-127
1.98
2.46
1.061
SE Coef
122
1.04
1.41
0.634
T- Value
-1.05
1.90
1.74
1.67
P- Value
0.298
0.041**
0.004*
0.047**
0.896
0.609
1.47
0.044**
1.008
0.665
1.64
0.105**
R-sq = 69.23% R-sq(adj)= 61.67%
Table.8
Term
Coef
SE Coef
T- Value
121.8
53.5
2.28
Constant
-0.050
0.329
-0.15
(X1) Extent of training received in Seed Science
-0.536
0.400
-1.34
(X2) Extent of training received in Agronomy
-0.429
0.215
-0.15
(X3) Extent of training received in Horticulture
-0.425
0.270
-1.57
(X4) Extent of training received in Plant Protection
0.446
0.446
1.00
(X5) Extent of training received in Animal Husbandry
-0.369
0.202
-1.83
(X6) Perception of Respondents about KVK Training in
Increasing Knowledge and Skill about Agricultural Technologies
-0.189
0.202
-0.94
(X7) Perception of Respondents about KVK Training for Income
Generating Activity
0.034
0.197
0.17
(X8) Perception of Respondents about KVK Training for Better
Livestock management
0.140
0.258
0.54
(X9) Perception of Respondents about KVK training for Farm
Mechanization
-0.006
0.205
-0.03
(X10) Perception of Respondents about KVK training on New
Technology
0.156
0.223
0.70
(X11) Perception of Respondents about KVK training for overall
Improvement of Socio- Economic Condition
* Significant @ 1% level, ** Significant @ 5% levelR-sq = 59.23% R-sq(adj)= 52.37%
P- Value
0.025
0.879
0.042**
0.049**
0.009*
0.319
0.040**
0.351
0.865
0.589
0.978
0.486
Table.8.1 Results of Stepwise Regression
Term
Coef
SE Coef
150.6
35.1
Constant
-0.374
0.204
Extent of training received in horticulture
-0.439
0.263
Extent of training received in Plant protection
-0.561
0.387
Extent of training received in Agronomy
-0.320
0.188
Perception of Respondents about KVK Training in
Increasing Knowledge and Skill about Agricultural
Technologies
R-sq = 73.03% R-sq(adj)= 64.87%
1286
T- Value
4.29
-1.83
-1.67
-1.45
-1.71
P- Value
0.000
0.070
0.098
0.150
0.091
Int.J.Curr.Microbiol.App.Sci (2019) 8(2): 1275-1290
Table.9
Term
Coef
SE Coef
133
165
Constant
1.39
1.01
(X1) Extent of training received in Seed Science
0.98
1.23
(X2) Extent of training received in Agronomy
0.082
0.667
(X3) Extent of training received in Horticulture
-0.404
0.838
(X4) Extent of training received in Plant Protection
1.23
1.37
(X5) Extent of training received in Animal Husbandry
0.577
0.626
(X6) Perception of Respondents about KVK Training in Increasing Knowledge and
Skill about Agricultural Technologies
0.473
0.625
(X7) Perception of Respondents about KVK Training for Income Generating Activity
1.200
0.612
(X8) Perception of Respondents about KVK Training for Better Livestock
management
-0.575
0.801
(X9) Perception of Respondents about KVK training for Farm Mechanization
-0.072
0.634
(X10) Perception of Respondents about KVK training on New Technology
0.169
0.684
(X11) Perception of Respondents about KVK training for overall Improvement of
Socio- Economic Condition
** Significant @ 5% level
R-sq = 58.14% R-sq(adj)= 47.11%
T- Value
0.81
1.37
0.80
0.12
-0.48
0.89
0.92
P- Value
0.422
0.043**
0.428
0.902
0.630
0.033**
0.039**
0.76
1.96
0.451
0.042**
-0.72
-0.11
0.25
0.475
0.910
0.805
Table.9.1 Stepwise regression analysis for Change in Adoption Crop Production Technologies
Term
Constant
Extent of training received in Seed science Seed
science
Extent of training received in Income generating
activity
** Significant @ 5% level
Coef
182.2
1.458
SE Coef
64.7
0.952
T- Value
2.81
1.53
P- Value
0.006
0.028**
1.157
0.587
1.97
0.041**
R-sq 77.78%
R-sq(adj)= 72.54 %
Table.10
Term
Constant
(X1) Extent of training received in Seed Science
(X2) Extent of training received in Agronomy
(X3) Extent of training received in Horticulture
(X4) Extent of training received in Plant Protection
(X5) Extent of training received in Animal Husbandry
(X6) Perception of Respondents about KVK Training in Increasing
Knowledge and Skill about Agricultural Technologies
(X7) Perception of Respondents about KVK Training for Income Generating
Activity
(X8) Perception of Respondents about KVK Training for Better Livestock
management
(X9) Perception of Respondents about KVK training for Farm
Mechanization
(X10) Perception of Respondents about KVK training on New Technology
(X11) Perception of Respondents about KVK training for overall
Improvement of Socio- Economic Condition
** Significant @ 5% level
R-sq 66.67%
1287
Coef
124
-0.310
1.451
0.473
0.538
-0.34
-0.308
SE Coef
127
0.776
0.942
0.512
0.643
1.05
0.481
T- Value
0.98
-0.40
1.54
0.92
0.84
-0.32
-0.64
P- Value
0.328
0.690
0.026**
0.048**
0.405
0.749
0.524
-0.287
0.480
-0.60
0.551
0.560
0.470
1.19
0.035**
0.294
0.615
0.48
0.033**
-0.247
0.143
0.487
0.525
-0.51
0.27
0.612
0.786
R-sq(adj)= 59.12%
Int.J.Curr.Microbiol.App.Sci (2019) 8(2): 1275-1290
Table.10.1 Stepwise regression analysis for Change in Horticultural Technologies
Term
Constant
Extent of training received in Agronomy
Extent of training received in Income generating activity
*Significant @ 1 % level ** Significant @ 5% level
Coef
SE Coef
T- Value
P- Value
99.1
60.9
1.63
0.107
1.517
0.907
1.63
0.047**
-0.573
0.450
-1.27
0.010*
R-sq = 77.79 % R-sq(adj) 72.89%
Table.11
Term
Coef
SE Coef
T- Value
90
112
0.80
Constant
0.786
0.689
1.14
(X1) Extent of training received in Seed Science
-0.092
0.836
-0.11
(X2) Extent of training received in Agronomy
0.270
0.455
0.59
(X3) Extent of training received in Horticulture
0.115
0.571
0.20
(X4) Extent of training received in Plant Protection
0.097
0.935
0.10
(X5) Extent of training received in Animal Husbandry
-0.062
0.427
-0.15
(X6) Perception of Respondents about KVK Training in Increasing
Knowledge and Skill about Agricultural Technologies
0.412
0.426
0.97
(X7) Perception of Respondents about KVK Training for Income
Generating Activity
0.202
0.417
0.48
(X8) Perception of Respondents about KVK Training for Better
Livestock management
0.383
0.546
0.70
(X9) Perception of Respondents about KVK training for Farm
Mechanization
0.171
0.432
0.40
(X10) Perception of Respondents about KVK training on New
Technology
0.047
0.466
0.10
(X11) Perception of Respondents about KVK training for overall
Improvement of Socio- Economic Condition
** Significant @ 5% level
R-sq = 79.79% R-sq(adj) = 73.12%
P- Value
0.424
0.056**
0.912
0.054**
0.041**
0.017**
0.884
0.035**
0.029**
0.044**
0.693
0.920
Table.12
Variables
Age
Education
Family Education
Family members
Cosmopliteness
Media Exposure
Social Participation
Land Holdings
Material Possession
Annual Income
Factor 1
-0.038
0.090
0.018
0.114
0.923
0.265
0.160
0.209
-0.052
0.076
Factor 2
0.672
0.198
-0.043
0.553
0.097
-0.020
0.016
0.104
0.061
-0.103
Factor 3
-0.240
-0.487
-0.036
0.018
-0.194
0.056
-0.161
-0.170
-0.347
-0.263
1288
Factor 4
0.168
0.122
0.044
-0.155
-0.046
-0.070
0.302
-0.599
-0.126
-0.016
Factor 5
0.288
0.033
0.474
-0.162
-0.043
-0.326
0.149
-0.016
0.184
-0.012
Communality
0.622
0.301
0.230
0.369
0.903
0.185
0.165
0.442
0.177
0.086
Int.J.Curr.Microbiol.App.Sci (2019) 8(2): 1275-1290
Table.13
Variables
Age
Education
Family Education
Family members
Cosmopliteness
Media Exposure
Social Participation
Land Holdings
Material Possession
Annual Income
Factor 1
-0.077
0.108
-0.049
0.129
0.731
0.367
0.215
0.213
-0.081
0.103
Factor 2
-0.542
-0.191
0.062
-0.652
-0.103
0.009
0.001
-0.080
-0.030
0.108
Factor 3
-0.323
-0.504
-0.093
0.043
-0.193
0.097
-0.159
-0.144
-0.363
-0.233
Factor 4
-0.122
-0.098
-0.031
0.158
0.111
0.050
-0.295
0.640
0.135
0.024
Factor 5
0.256
0.021
0.427
-0.091
0.029
-0.297
0.252
0.004
0.110
-0.000
Communality
0.485
0.312
0.198
0.476
0.596
0.235
0.222
0.482
0.170
0.077
Table.14
Variables
Age
Education
Family Education
Family members
Cosmopliteness
Media Exposure
Social Participation
Land Holdings
Material Possession
Annual Income
Factor 1
0.823
0.314
0.002
0.430
0.147
-0.077
0.095
0.106
0.084
0.038
Factor 2
0.102
-0.088
0.045
0.047
0.096
-0.022
-0.084
0.053
0.015
-0.024
Factor 3
-0.103
0.080
-0.051
0.155
0.866
0.343
0.119
0.287
0.013
0.030
Factor 4
0.094
0.101
0.046
-0.031
-0.010
-0.017
0.029
0.100
0.986
0.034
Factor 5
1.134
0.031
0.661
-0.113
0.047
-0.232
0.106
0.020
0.068
0.016
Factor 6
-0.160
-0.108
-0.076
0.224
-0.044
0.043
-0.434
0.429
0.038
-0.005
Factor 7
0.008
0.323
0.016
-0.066
0.237
-0.088
0.113
0.102
0.119
0.402
Communality
0.751
0.240
0.450
0.279
0.841
0.188
0.244
0.301
1.000
0.166
Table.15
Variables
Age
Education
Family Education
Family members
Cosmopliteness
Media Exposure
Social Participation
Land Holdings
Material Possession
Annual Income
Factor 1
0.824
0.245
-0.033
0.473
0.109
-0.021
0.055
0.081
0.103
-0.077
Factor 2
0.016
-0.113
-0.039
-0.103
-0.883
-0.244
-0.149
-0.242
0.040
-0.066
Factor 3
0.303
0.021
0.372
-0.215
-0.145
-0.336
0.045
-0.016
0.137
-0.041
Factor 4
-0.159
-0.108
-0.103
0.192
0.008
0.075
-0.374
0.552
0.094
-0.033
Factor 5
-0.142
-0.366
-0.116
0.033
-0.178
0.080
-0.184
-0.198
-0.380
-0.316
Communality
0.816
0.218
0.165
0.318
0.844
0.184
0.201
0.409
0.184
0.113
Factor 5
0.152
0.086
0.129
-0.208
0.002
-0.070
0.375
-0.552
-0.116
0.009
Communality
0.890
0.195
0.126
0.290
0.647
0.199
0.214
0.427
0.159
0.087
Table.16
Variables
Age
Education
Family Education
Family members
Cosmopliteness
Media Exposure
Social Participation
Land Holdings
Material Possession
Annual Income
Factor 1
0.877
0.236
0.011
0.437
0.117
-0.036
0.051
0.071
0.093
-0.097
Factor 2
0.122
-0.082
-0.067
-0.085
0.062
0.039
0.082
0.058
0.035
0.105
Factor 3
0.121
-0.156
0.088
-0.184
-0.778
-0.366
-0.151
-0.284
0.042
-0.113
1289
Factor 4
-0.260
-0.317
-0.312
0.121
-0.153
0.238
-0.203
-0.182
-0.366
-0.231
Int.J.Curr.Microbiol.App.Sci (2019) 8(2): 1275-1290
Scree plot of animal husbandry
On the basis of factor loadings two factors
with highest loadings have been selected. It is
found from the table 16 that Factor 1 is
primarily anchored by six variables namely,
age,
education,
family
members,
cosmopoliteness, land holdings and material
possession. Factor 2 is anchored by
cosmopoliteness, media exposure, social
participation, land holdings, and annual
income. Factor 3 is anchored by family
education and material possession. Factor 4 is
mostly represented by family members and
media exposure. Factor 5 is anchored by age,
education,
family
education,
social
participation and annual income.
It is concluded that,
Majority of the respondents had high
perception about increase in knowledge and
skill through KVK training followed by semimedium and medium level of perception
Majority of the respondents had high of
perception about KVK training for income
generating activity index group followed by
semi-medium and medium index group
respectively
Majority of the respondents had high
perception about KVK training for better
livestock management followed by semimedium and medium level of perception.
Majority of the respondents had high level
perception about KVK training for farm
mechanization followed by semi-medium and
medium level of perception.
Majority of the respondents had high of
perception regarding getting new technologies
form KVK training followed by semi-medium
and medium index group.
Majority of the respondents had high
perception about KVK training for overall
improvement of socio-economic conditions or
the respondents followed by semi medium
and medium level of perception.
References
Bowden, R. (1984). Experimental Learning in
Agriculture.
In
training
from
agricultural development 1982. FAO
Economic and Social development
series, 26:39-47, 369.
Gorsuch, Richard L. (1983) Factor Analysis.
Hillsdale, NJ: Erlbaum
Mishra, B. Mishra, R. and Kanungo, A.P.
(2005) Women’s access to farm
information and technology, Journal of
Extn. Edn. Vol. ix and x (1,2) pp 72-77.
Sharma, K.A. and Murthy, A.S. (1971).
Training needs as perceived by farmers.
Kurukshetra. Vol. 19, No. 15, pp. 11.
Singh, H. and Patel, H.N. (1990). Knowledge
level and socio-economic characteristics
of content and non-contact farmers.
Maharashtra J. Extn. Edu., Vol. XXIV,
No. 1 & 2, p. 71-72
Sohal, T.S. (1967).Organizing farmers’
Training Report presented at summer
institute held at I.A.R.I. New Delhi-12.
How to cite this article:
Sabyasachi Karak, Subhajit Roy and Siddhartha Dev Mukhopadhyay. 2019. Studies of the
Perception of Respondents regarding KVK Training Intervention in Agriculture.
Int.J.Curr.Microbiol.App.Sci. 8(02): 1275-1290. doi: />
1290