Growth, yield and yield contributing factors of rice crop as influenced by different level and methods of irrigation in Tarai region of Uttarakhand, India
Bạn đang xem bản rút gọn của tài liệu. Xem và tải ngay bản đầy đủ của tài liệu tại đây (401.87 KB, 11 trang )
Int.J.Curr.Microbiol.App.Sci (2019) 8(4): 1088-1098
International Journal of Current Microbiology and Applied Sciences
ISSN: 2319-7706 Volume 8 Number 04 (2019)
Journal homepage:
Original Research Article
/>
Growth, Yield and Yield Contributing Factors of Rice Crop as
Influenced by Different Level and Methods of Irrigation in
Tarai Region of Uttarakhand, India
Vikas Sharma1*, Priyanka Gunjan2, Yadvendra Pal Singh1 and P.K. Singh1
1
Department of Irrigation and Drainage Engineering, G.B Pant University of Agricultural
and Technology, Pantnagar, India
2
Indian Institute of Technology (IIT), Roorkee, India
*Corresponding author
ABSTRACT
Keywords
Aqua Crop model,
Water use
Efficiency,
Subsurface drip
irrigation
Article Info
Accepted:
10 March 2019
Available Online:
10 April 2019
The present study was undertaken with a view to study the effect of different level of
irrigation on biometric parameters of rice crop such as growth, yield and yield attributes
and water use efficiency under surface and subsurface drip irrigation. The results shows
that the biometric parameters such as plant height, number of tillers per plant, plant dry
matter and LAI for rice crop were found maximum in the treatments T 3 (subsurface drip)
and T8 (conventional irrigation). Water supply to the crops was significantly higher in the
treatment T8 as compared to other treatments. The crop yield was found to be maximum in
treatments T8 followed by T7 and T3. Whereas, the water use efficiency for treatments
under drip irrigation was significantly superior to the treatments under conventional
irrigation.
Introduction
The available fresh water resources in the
world are constant and the population is
continually increasing, this available water
per capita will continue to decrease resulting
in stress or water scarcity in some areas.
Rice (Oryza sativa) is the most important
human food crop in the world, directly
feeding more people than any other crop. Rice
has also fed more people over a longer time
than has any other crop. It is spectacularly
diverse, both in the way it is grown and how it
is used by humans. This is the staple food of
those people which living in the eastern and
the southern parts of the country, particularly
in the areas having over 150 cm annual
rainfall. As of 2009 world food consumption
of rice was 531.61 million metric tons of
paddy equivalent (354,60281 of milled
equivalent), while the remote largest
consumers were China consuming 156.31
million metric tons of paddy equivalent (29.4
percent of the world consumption) and India
consuming 123.5 million metric tons of paddy
equivalent
(23.28%
of
the
world
consumption) (FAO 2012). Drip irrigation is a
1088
Int.J.Curr.Microbiol.App.Sci (2019) 8(4): 1088-1098
type of micro- irrigation that has the potential
to save water and nutrients by allowing water
to drip slowly to the roots of plants, either
from above the soil surface or buried below
the surface. The goal is to place water directly
into the root zone and minimize evaporation
rate. Drip irrigation systems distribute water
through a network of direction and flow
control valves, pipes, tubing, and emitters or
drippers. Depending on how well designed,
installed, maintained, and operated it is, a drip
irrigation system can be more efficient than
other types of irrigation systems, such as
surface irrigation or sprinkler irrigation.
The main objectives of this study to
investigate growth, yield and yield contribute
factors as influenced by different level and
method of irrigation.
average annual rainfall was 1400 mm with the
monsoon season generally from June to
September month. The summer is too dry and
hot, and the winter is very cold. The dry
season starts from November and ends in
May. The mean monthly temperature ranges
from 5˚C to 25˚C while the mean maximum
temperature varies from 20˚C to 40˚C.The
experimental site consists of silty clay loam
with sand (14%), silt (54%) and clay (32%).
The average bulk density of the experimental
site was determined using core sampler. The
average bulk density was found to be 1.45
g/cm3. The soil moisture content before and
after irrigation and at field capacity was
determined by soil moisture meter (TDR 300)
and calibrated with gravimetric method at
regular interval of time. The field capacity
was found to be 42 percent by volume basis.
Materials and Methods
Drip irrigation scheduling of rice crop
Study area, climate and soil characteristics
The crop water requirement was calculated by
following formula as given in INCID, (1994).
The total water applied to the rice crop is
calculated as:
The present study was conducted at G.B. Pant
University of Agriculture and Technology,
Pantnagar (29˚N latitude, 79˚30´E longitude
and 243.83 m above mean sea level) in
Uttarakhand state of India which comes under
Tarai region, located in foothills of the
Himalayas. The study area comes under
Agro- climatic zone 14 and 9. The
experimental fields of 1000 square meter at
the Vegetable Research Centre (VRC), G.B
Pant University of Agriculture and
Technology Pantnagar, Uttarakhand was
selected to conduct various field experiments.
The experimental field has drip irrigation as
well as surface irrigation facility. The
meteorological data such as temperature,
relative humidity, wind speed, rainfall, pan
evaporation and sunshine hours during the
crop period was acquired from the
meteorological observatory located at Crop
Research Centre (CRC), Pantnagar which is 5
km away from the experimental site. The
V= ∑ (Ep× Kp× Kc ×Sp ×Sr ×WP + ER)
Where,
V = estimated crop water requirement at
100% water use level, litre/day/plant
Epan = Pan Evaporation, mm/day Kp = Pan
coefficient
Kc = Crop coefficient
Sp = Plant to plant spacing, m Sr = Row to
row spacing, m
Wp = Percentage wetted area, 90% ER =
Effective rainfall, mm
In this study calculation of crop coefficient,
Kc, for rice crop was done on the basis of
Agromet
Advisory
Service
Bulletin,
GBPUA&T, Pantnagar The value of crop
1089
Int.J.Curr.Microbiol.App.Sci (2019) 8(4): 1088-1098
coefficient for initial stage Kc nit was taken as
0.8, for mid stage Kc mid was taken as 1.7 and
for end stage it was taken as Kc end as 0.7.
Based on USDA. S.C.S method the effective
rainfall (ER) is calculated on monthly basis
as:
surface drip irrigation in DSR planted at 15
cm row spacing
T5: 1.2V - Volume of water application under
surface drip irrigation in DSR planted at 15
cm row spacing
T6: 1.2V - Volume of water application under
subsurface drip irrigation in DSR planted at
15 cm row spacing
ER = Pt [
] for Pt < 250mm Where,
Pt - total rainfall, mm
The drip irrigation system with a mainline of
a PVC pipe of 40 mm diameter having wall
thickness of 1.8 mm and pressure rating up to
6 kg/cm2 was laid.
The lateral turbo line having 16 mm diameter
was provided with drippers of 1.3 lph
discharge capacity with minimum pressure of
1 kg/cm2 spaced at 30 cm. In this study drip
lines (lateral) were laid parallel to the crop
rows and one drip line served two rows of
crop.
The duration of water application to each
treatment was controlled with the help of
delivery valves provided at inlet of each
laterals. Under drip irrigation treatments soil
moisture was maintained near field capacity
with the help of frequently application of
water at 3-7 days interval.
Experimental treatments for rice crop
T1: V - Volume of water application under
surface drip irrigation in DSR planted at 20
cm row spacing
T2: 1.2V - Volume of water application under
surface drip irrigation in DSR planted at 20
cm row spacing
T3: 1.2V - Volume of water application under
subsurface drip irrigation in DSR planted at
20 cm row spacing
T4: V - Volume of water application under
T7: Surface irrigation (soil moisture
maintained at saturation) in DSR planted at 20
cm row spacing
T8: Conventional flood irrigation (Standing
Water) in TPR planted at 20 cm row spacing
Test crop, preparation of experimental
plot, fertilizer application and fertigation
Rice (Oryza sativa), variety HKR-47 was
selected as test crop for study. Deep
ploughing (20-25 cm) of field was done with
soil turning plough. In subsurface drip
irrigation treatments, lateral (turbo line) were
laid at 20 cm below ground surface. At the
inlet of drip line (turbo line) lateral valve
were provided to start and stop the irrigation.
With the row spacing of 20 cm and 15 cm the
rice seeds were directly sown on 22th of June
2015 in direct seeded rice (DSR) treatments.
Later the transplantation of nursery raised rice
seedlings were done on 15th July 2015 with
the row spacing of 20 cm in transplanted rice
treatment replications. Recommended dose of
N: P2O5: K2O, 120:60:40 kg/ha were supplied
during the crop period which was based on
soil analysis.
At the time of sowing and just before
transplanting, the 25% of recommended dose
of nitrogen and total quantities of P2O5 and
K2O along with 25 kg/ha of zinc (Zn) were
applied. The harvesting of the crop was
started on 31th October 2015. The harvesting
1090
Int.J.Curr.Microbiol.App.Sci (2019) 8(4): 1088-1098
was finished by 2nd November, 2015. From
each plot, the crop and straw yield was
recorded separately and then converted to per
hectare basis.
plant height while the TPR with saturated
level of irrigation under surface irrigation
showed significant influence on plant height
entire the growing period of crop.
Biometric observations recorded in rice
crop
Number of tillers per plant
Five plants were randomly selected from each
replication and selected plants were tagged by
aluminium tag for identification. For taking
biometric observations, different parameters
of vegetative growth such as plant height,
number of tillers per plant, number of shoots
per m2, leaf area index, plant dry matter and
yield and yield contributing characters were
recorded at 30, 60, 90 DAS and at harvest.
Statistical analysis
In this study analysis of variance technique
was used to analyse the experimental data to
randomized block design with the help of
computer. The critical differences at 5% level
of probability were calculated for testing the
significance of difference between the
treatments.
Results and Discussion
In this study effects of treatments on all the
characters were found to be significant.
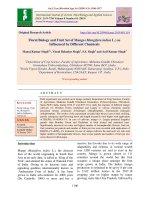
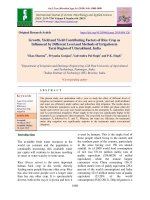
The highest average plant height (Table 4.1)
at 30 and 60 DAS was recorded for T3 (1.2V Volume of water application under subsurface
drip irrigation in DSR planted at 20 cm row
spacing) with value of 36 cm and 70 cm,
respectively. While average plant height at 90
days after sowing and at harvest was found to
be highest for T8 (Conventional flood
irrigation (Standing Water) in TPR planted at
20 cm row spacing) with value of 96 cm and
103 cm, respectively. The result revealed that
the significant influence of sub surface drip
irrigation with 20 cm row spacing over
submerged irrigation at 30 and 60 DAS on
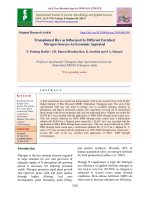
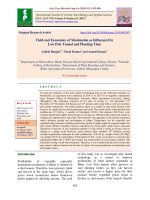
At 30 DAS the number of tillers per plant was
found to be almost similar for all the
treatments except treatments T6, T7, T8 (Table
3.2).
At 60, 90 DAS and at harvest the highest
number of tillers per plant was recorded for
with value of 12, 11, 10, respectively. Thus,
result showed that the number of tillers per
plant in transplanted rice (TPR) was
significantly superior to direct seeded rice
(DSR).
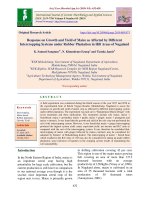
Leaf Area Index (LAI)
The highest leaf area index at 30 DAS was
recorded for the treatment T8 (1.16 m2 m-2)
followed by T7 (1.1 m2 m-2). AT 60, 90, and
at harvest, the highest LAI was recorded
again in T8 followed by T7 and T1 (Table 3.3).
Thus, result showed that TPR with submerged
irrigation was significantly superior to DSR
under drip. This result revealed that the plant
leaf growth was affected by water and
moisture availability.
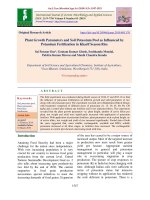
Plant dry matter
At 30, 60 and 90 DAS the plant dry matter
was recorded maximum for treatment T5 (182
g m-2), T3 (463 g m-2) and T6 (1946 g m-2),
respectively. At harvest the plant dry matter
was found to be highest for the treatment T8
(2070 g m-2) (Table 3.4).
This result showed that TPR with submerged
irrigation was significantly superior to DSR
under drip and DSR with saturated level of
irrigation.
1091
Int.J.Curr.Microbiol.App.Sci (2019) 8(4): 1088-1098
Yield and yield contributing characters
The number of productive tillers/hill and
panicle length were recorded highest for
treatment T8 followed by T2 and T3. The
analysis of the data revealed that the number
of panicles and grains per plant were recorded
highest for the treatment T8 followed by T7.
The weight of 1000 grains was highest for
treatment T8 with a value of 40.8 gm followed
by T7 and T3 (Table 3.5) Thus, this result
showed the method of irrigation such as
surface irrigation, surface drip irrigation and
subsurface drip irrigation significantly
influenced the crop yield and all yield
contributing characters. Similar result was
also reported by Ayars et al., (1999) based on
his study on subsurface drip irrigation of row
crops: a review of 15 years of research at the
Water Management Research Laboratory. The
result revealed that the grain yield was
observed maximum for the treatment T8 (7.9
t/ha) followed by treatment T7 (7.1t/ha) and
treatment T3 (6.9 t/ha) and minimum for
treatment T4 (5.4t/ha). Similar results were
reported by other researchers (Tabbal et al.,
2002, Bouman et al., 2005) between
continuous and intermittent irrigation. The
straw yield was observed maximum for the
treatment T8 (12.1 t/ha) followed by treatment
T7 (11.1 t/ha) and the minimum for T1 (8.6
t/ha). In this study harvesting index was
recorded highest for the treatment T3 (42.5%)
and lowest for treatment T4 (35.5%). Thus,
the overall result revealed that treatments T8
(Conventional flood irrigation (Standing
Water) in TPR planted at 20 cm row spacing)
and T3 (1.2V - Volume of water application
under subsurface drip irrigation in DSR
planted at 20 cm row spacing) were
significantly superior to other treatments.
The effect of irrigation regimes and method of
irrigation on water use efficiency (WUE) was
significant T1 to T8 with 0.018 to 0.0621 t/ha-
cm m (Table 3.6). The water use efficiency
was found to be highest for the treatment T3
with a value of 0.0621 t/ha-cm, followed by
treatment T6 with a value of 0.0620 t/ha-cm.
Surface irrigation under treatment T8 i.e. TPR
with continuous soil submergence produce
lowest WUE but in the treatment T7 i.e.
surface irrigation in DSR with saturated soil
increases the WUE (Table 4.9). In this study
the amount of water needed to grow one kg of
rice was found to be lowest for treatment T3
with a value of 1607 litres of water, followed
by treatment T6 with a value of 1611 litres of
water and highest for treatment T8 with a
value of 5508 litres of water. Thus, the overall
result showed that the effective use of water
as well as effective water management under
surface and subsurface drip irrigation over
surface irrigation.
Field investigations was undertaken to
investigate the growth yield and yield
contribute factor as influenced by different
level and method of irrigation at the
experimental farm of Vegetable Research
Centre, GBPUA&T, Pantnagar, Uttarakhand.
The highest average plant height at 30 and 60
DAS was recorded for T3 (1.2V - Volume of
water application under subsurface drip
irrigation in DSR planted at 20 cm row
spacing) with a value of 36 cm and 70 cm,
respectively. While average plant height at 90
days after sowing and at harvest was found to
be highest for T8 (Conventional flood
irrigation (Standing Water) in TPR planted at
20 cm row spacing) with a value of 96 cm and
103 cm, respectively. At 30 DAS the number
of tillers per plant was found to be almost
similar for all the treatments except
treatments T6, T7, T8. At 60, 90 DAS. At
harvest, the highest number of tillers per plant
was recorded for T8 (Conventional flood
irrigation (Standing Water) in TPR planted at
20 cm row spacing) with a value of 12, 11,
10, respectively.
1092
Int.J.Curr.Microbiol.App.Sci (2019) 8(4): 1088-1098
Table.1 Effect of various treatments on plant height of rice crop (cm) at
different stages of crop growth
Treatment
Plant Height (cm)
Days after sowing (DAS)
30
60
90
At Harvest
T1
29
68
82
93
T2
34
66
84
90
T3
36
70
84
91
T4
34
68
82
92
T5
34
66
86
90
T6
33
67
78
87
T7
33
66
92
100
T8
31
70
96
103
CD (P<0.05)
6.3
6.5
9.85
10.1
SEM (±)
0.83
1.06
2.1
1.5
CV (%)
7.1
4.4
7
5
Table.2 Effect of various treatments on number of tillers per plant of rice crop at different stages
of crop growth
Treatment
Number of tillers per plant
Days after sowing (DAS)
30
60
90
At harvest
T1
4
10
9
8
T2
4
9
9
9
T3
4
8
8
7
T4
4
9
8
8
T5
4
7
7
6
T6
3
9
8
7
T7
3
8
7
7
T8
5
12
11
10
CD (P<0.05)
1.1
4.9
1.6
1.2
SEM (±)
0.23
0.70
0.56
0.45
CV (%)
17.2
22.2
19.0
16.5
1093
Int.J.Curr.Microbiol.App.Sci (2019) 8(4): 1088-1098
Table.3 Effect of various treatments on leaf area index (LAI) of rice crop at different stages of
crop growth
Treatment
Leaf Area Index (LAI)
Days After sowing (DAS)
3
0
60
90
At Harvest
T1
0.95
2.12
4.57
3.4
T2
0.91
2.08
4.31
3.22
T3
0.87
2
4.21
3.02
T4
0.90
5
2.02
4.35
3.06
T5
0.86
2.01
4.2
3.15
T6
0.92
2.07
4.32
3.1
T7
1.1
2.2
4.6
3.25
T8
1.16
2.92
4.78
3.9
CD (P<0.05)
0.12
0.18
0.32
0.46
SEM (±)
0.05
0.12
0.10
0.10
CV (%)
14.9
16.4
6.40
8.70
Table.4 Effect of various treatments on plant dry matter of rice crop at different stages of crop
growth
Plant dry matter (g m-2)
Treatment
Days after sowing (DAS)
30
60
90
At Harvest
T1
113
362
1341
1778
T2
147
411
1427
1890
T3
122
463
1229
1759
T4
155
419
1680
2315
T5
182
415
1890
2472
T6
158
373
1946
2560
T7
134
398
1195
1640
T8
149
338
1582
2070
CD (P<0.05)
74.6
102.3
186.2
285.1
SEM (±)
9.93
19
3.6
3.8
CV (%)
19.2
13.9
9.7
7.4
1094
Int.J.Curr.Microbiol.App.Sci (2019) 8(4): 1088-1098
Table.5 Effect of various treatments on yield contributing characters of rice at harvest
Treatment
T1
T2
T3
T4
T5
T6
T7
T8
CD (P<0.5)
SEM (±)
CV (%)
No. of
Productive
tillers/plant
8
9
7
8
6
7
7
10
1.2
0.50
18.2
No. of
grains/plant
642
697
704
631
651
679
743
812
213.2
21.64
8.8
Panicle
Length
(cm)
25.6
26
29.2
25.06
25.3
25.1
26.06
29.7
2.8
0.84
9.02
1000
grain
weight
(g)
38.1
39.2
39.8
36.2
36.9
38.3
40.2
40.8
3.8
0.729
5.4
Grain
yield
(t/ha)
6.1
6.5
6.9
5.4
6.0
6.4
7.1
7.9
1.4
0.26
9.9
Straw
yield
(t/ha)
8.6
9.2
9.3
9.8
10.4
10.8
11.1
12.1
1.6
0.42
11.9
Harvesting
index
(%)
41.5
41.4
42.5
35.5
36.5
37.2
39.01
39.5
9.2
1.04
6.9
Table.6 Water use efficiency of rice under different level of irrigation
Treatment
T1
T2
T3
T4
T5
T6
T7
T8
CD (P<0.5)
SEM (±)
CV (%)
Total
irrigation
water
applied
(mm)
261.2
313.4
313.4
195.8
235.1
235.1
2222
3555.5
Effective
rainfall
(mm)
796
796
796
796
796
796
796
796
Total
amount
of water
applied
(mm)
1057.2
1109.4
1109.4
991.8
1031.1
1031.1
3018
4351.5
Total
Water saving
(%)
75.7
74.5
74.5
77.2
76.3
76.3
30.6
Water
use
efficiency
(t/ha-cm)
0.0576
0.0585
0.0621
0.0544
0.0581
0.0620
0.0235
0.0181
0.21
0.075
17.4
Fig.1 Effect of different levels of irrigation on plant height of rice crop
1095
Amount of
water to
produce
unit yield
(l/kg)
1733
1706
1607
1836
1718
1611
4250
5508
Int.J.Curr.Microbiol.App.Sci (2019) 8(4): 1088-1098
Fig.2 Effect of different levels of irrigation on tillers per plant for rice crop
Fig.3 Effect of different levels of irrigation on leaf area index (LAI) for rice crop
Fig.4 Effect of different levels of irrigation on plant dry matter for rice crop
Plate.1 Rice crop under drip irrigation at 15 and 30 DAS
Plate.2 Rice crop at 90 DAS and at harvest
1096
Int.J.Curr.Microbiol.App.Sci (2019) 8(4): 1088-1098
The highest leaf area index at 30 DAS was
recorded for the treatment T8 (1.16m2 m-2)
followed by T7 (1.1 m2 m-2). AT 60, 90, and
at harvest the highest LAI was recorded again
in T8 (4.78 m2 m-2) followed by T6 (4.6 m2 m2). Thus, result showed that TPR with
submerged soil irrigation was significantly
superior to DSR under drip irrigation. In case
of plant dry matter the effect of different level
of irrigation was found to be significant at all
different DAS. At 30, 60 and 90 DAS the
plant dry matter was recorded maximum for
treatment T5 (182 gm-2), T3 (463 gm-2) and T6
(1946 gm-2), respectively. At harvest, the
plant dry matter was found to be highest for
the treatment T8 (2070 gm-2). The number of
productive tillers/hill and panicle length were
recorded highest for treatment T8 followed by
T2 and T7.
The analysis of the data revealed that the
number of panicles and grains per plant were
recorded highest for the treatment T8 followed
by T7 and T3. The weight of 1000 grains was
highest for treatment T8 with a value of 40.8
gm followed by T3 and T2. The grain yield
was observed maximum for the treatment T8
(7.9 t/ha) followed by treatment T7 (7.1t/ha)
and treatment T3 (6.9 t/ha) and minimum for
treatment T4 (5.4t/ha). The straw yield was
observed maximum for the treatment T8 (12.1
t/ha) followed by treatment T7 (11.1 t/ha) and
the minimum for T1 (8.6 t/ha).In this study
harvesting index was recorded highest for the
treatment T3 (42.5%) and lowest for treatment
T4 (35.5%).
The water saving over submerged soil
irrigation under surface irrigation (TPR) was
found to be highest for treatment T4 with a
value of 94.4 %, followed by treatment T1
with a value of 92.6 % and lowest for
treatment for T7 with a value of 37.4 %.
During entire growing period of crop the total
irrigation water applied for the treatments T1,
T2, T4, T5 under surface drip irrigation and for
the treatments T3, T6, under subsurface drip
irrigation was 261.2, 313.4, 195.8, 235.1 and
313.4, 235.1 mm, respectively. Similarly total
irrigation water applied for the treatments T7
and T8 under surface irrigation was 2222 and
3555.5 mm, respectively The water use
efficiency was found to be highest for
treatment T3, followed by treatment T6 and
lowest for treatment T8. In this study the
amount of water needed to grow one kg of
rice was found to be lowest for treatment T3
with a value of 1603 litres of water, followed
by treatment T6 with a value of 1611 litres of
water and highest for treatment T8 with a
value of 5508 litres of water.
References
Abedinpour, M., Sarangi, A., Rajput, T.B.S.,
Singh, M., Pathak, H. and Ahmad, T.
2012. Performance evaluation of Aqua
Crop model for maize crop in a semiarid environment. Agricultural Water
Management, 110: 55–66.
Andarziana, B., Bannayanb, M., Stedutoc, P.,
Mazraeha, H., Baratid, M.E., Baratie,
M.A. and Rahnamaa, A. 2011.
Validation and testing of the Aqua
Crop model under full and deficit
1097
Int.J.Curr.Microbiol.App.Sci (2019) 8(4): 1088-1098
irrigated wheat production in Iran.
Agricultural Water Management, 100:
1-8.
Cinaj, M. and Grazhdani, S. 2015. Validation
of Aqua Crop model in the simulation
of sugar beet production under
different
water
regimes
in
southeastern Albania. International
Journal of Engineering Science and
Innovative
Technology
(IJESIT),
Volume 4.
Ebrahim, A., Hamidreza, A.A., Aimrun, W.
and Mojtaba, R. 2015. Simulation of
rice yield under water and salinity
stress in rasht area using Aqua Crop
model. Journal Technology (Science
and Engineering), 76: 21-28.
El-Rahman, G. Abd. 2009. Water Use
Efficiency of Wheat under Drip
Irrigation Systems at Al Maghara
Area, North Sinai, Egypt. AmericanEurasian Journal Agriculture &
Environment Science, 5: 664 - 670.
How to cite this article:
Vikas Sharma, Priyanka Gunjan, Yadvendra Pal Singh and Singh, P.K. 2019. Growth, Yield
and Yield Contributing Factors of Rice Crop as Influenced by Different Level and Methods of
Irrigation in Tarai Region of Uttarakhand, India. Int.J.Curr.Microbiol.App.Sci. 8(04): 10881098. doi: />
1098

![Growth and yield of Ashwagandha [Withania somnifera (L.)] as influenced by different intercropping system in Kymore plateau of Madhya Pradesh](https://media.store123doc.com/images/document/2020_01/09/medium_vsb1578562778.jpg)