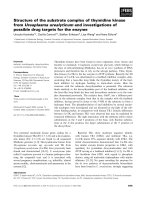
Appraisal and mapping of soil fertility status for Korasagu-4 micro watershed, by using Geo-spatial techniques
Bạn đang xem bản rút gọn của tài liệu. Xem và tải ngay bản đầy đủ của tài liệu tại đây (908.92 KB, 11 trang )
Int.J.Curr.Microbiol.App.Sci (2019) 8(5): 2339-2349
International Journal of Current Microbiology and Applied Sciences
ISSN: 2319-7706 Volume 8 Number 05 (2019)
Journal homepage:
Original Research Article
/>
Appraisal and Mapping of soil fertility status for Korasagu-4 micro
watershed, by using Geo-spatial techniques
K.T. Gurumurthy, D. Ravikumar, A.V. Priyanka*, Anantakumar Patil,
M.D. Rudresh, K.M. Vasanthkumar, S. Raghavendra and A. N. Raghu
SUJALA III Project, Department of Soil Science and Agricultural Chemistry, University of
Agricultural and Horticultural Sciences, Shivamogga, Karnataka, 577204, India
*Corresponding author
ABSTRACT
Keywords
Grids, GPS, GIS
techniques, Soil
fertility and
Correlation study
Article Info
Accepted:
18 April 2019
Available Online:
10 May 2019
A study was undertaken to assess the soil fertility status of Korasagu-4 micro-watershed in
Channagiri taluk, Davanagere district of Karnataka. Total ninety six grid wise surface soil
samples were collected at 0-15 cm depth to assess the soil parameters and prepare thematic
maps by using GIS techniques. The results indicated that soils of micro watershed were
slightly acidic to strongly alkaline in soil reaction with non-saline in nature. Soil organic
carbon content was found to be medium in major area. The available N, P 2O5, K2O were
found to be low (73.37%), medium (94.65%) and high (58.72%) respectively in the microwatershed. The 55.89 per cent and 70.17 per cent area of the micro watershed soils were
found to be medium in sulphur and boron content. Whereas zinc was found to be deficient
in 84.85 per cent of the area. The correlation study showed that organic carbon has
significant and positive correlation with the availability of N (r=0.304**), P (r=0.265**),
K (r=0.311**),S (r=0.515**), Zn (r=0.239*), Fe (r=0.261*) and significant and negative
correlation with Mn (r=-0.453**), Cu (r=-0.431**) and B (=-0.250*) indicating, the
compelling role of organic carbon in the maintenance of balanced soil health.
Introduction
Soil is one of the most important resources of
the nature. The kind of soil and its associated
characteristics provides information regarding
nutrient availability in soils which forms the
basis for the fertilizer recommendations for
maximising the crop yields and to maintain
the adequate fertility in soils for longer
period. The physical and chemical properties
of soils provide the information about the
capacity of soil to supply mineral nutrients.
Spatial variation across a field becomes great
challenge for assessing the soil fertility of an
area. Describing the spatial variability of soil
fertility across a field has been difficult until
new technologies such as Global Positioning
Systems (GPS) and Geographic Information
Systems (GIS) were introduced. GIS is a
powerful set of tools for collecting, storing,
retrieving, transforming and displaying spatial
data (Burrough and McDonnell, 1998). As
human population continues to increase,
human disturbance on the earth’s ecosystem
2339
Int.J.Curr.Microbiol.App.Sci (2019) 8(5): 2339-2349
to produce food and fibre will place greater
demand on soils to supply essential nutrients.
Imbalanced and inadequate use of chemical
fertilizers, improper irrigation and various
cultural practices also deplete the soil quality
rapidly (Medhe et al., 2012). In India, low
fertility of soils is the major constraint to
achieving high productivity goals (SLUSI,
2010). Therefore, it is important to investigate
the soil fertility status and it may provide
valuable information relating crop research.
Considering these facts, the present study was
initiated with the objective to assess the soil
fertility status of Korasagu-4 microwatershed, Channagiri taluk of Davangere
district.
Materials and Methods
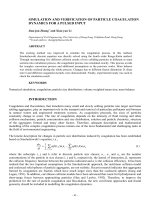
The study was carried out at Korasagu-4
micro-watershed is located in Channagiri
taluk of Davangere district of Karnataka and
lies between 14° 0' 54.01" N latitude and 76°
4' 10.51" E longitude and 13° 58' 33.80" N
and 76° 4' 28.90" E as well altitude 669 MSL
with a spatial extent of 980.94 ha (Fig.1).
Total area of Korasagu-4 micro watershed
was found to be 980.94 ha out of which
928.94 ha (94.29%) area was considered for
study and 52 ha (5.71%) area was considered
under habitation and water body. The average
rainfall in the study area was 756 mm. The
survey of India toposheet was used to prepare
base maps covering Korasagu-4 micro
watershed. The cadastral map having parcel
boundaries with survey numbers collected
from KSRSAC, Bengaluru were used for the
study. The survey of India toposheet with
1:50,000 scale was used along with the
satellite imaginary for updating the base
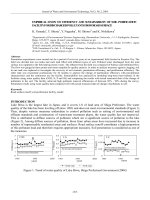
maps. Grid sampling (0-15 cm depth) was
done in the study area by imposing grids of
320 x 320 m intervals in the micro watershed
with 1:7920 scale (Fig. 2). Total 96 surface
soil samples were collected from the fixed
grid points using hand held GPS for studying
soil fertility status in the micro watershed.
The collected soil samples were analyzed by
adopting standard procedure. Particle size
distribution was determined by international
pipette method (Piper, 1966). Soil pH and
electrical conductivity was determined at
1:2.5 soil water suspensions by potentiometric
and conductometry method (Jackson, 1973).
Organic carbon was measured by Chromic
acid wet digestion method (Walkley and
Black 1934). Available N in the soil was
determined
by
alkaline
potassium
permanganate method as described by
Subbiah and Asija (1956). Available
phosphorus was extracted by using Olsen’s
extractant (0.5 M NaHCO3) for neutral and
alkaline soils and Bray’s extractant for acid
soils was determined by spectrophotometer
(Jackson, 1973). The available K was
estimated by extracting the soil with 1 N
NH4OAC (pH 7.0) by using flame
photometer. The exchangeable calcium and
magnesium were determined by versanate
titration method (Jackson, 1973). Available
sulphur was extracted from soil using 0.15 per
cent CaCl2 solution and determined by
turbidometrically
(Black,
1965).
The
micronutrients like Fe, Zn, Mn, Cu and B in
the soil were extracted with DTPA extractant
by
using
Atomic
Absorption
Spectrophotometer (Lindsey and Norvell,
1978). Hot water extractable boron in soil was
determined as per the procedure outlined by
John et al., (1975) by using Azomethane-H
reagent.
Nutrient status of soil maps
A excel format file consisting of data for X
and Y co-ordinates in respect of sampling site
location was created. A shape file (vector
data) showing the outline of Korasagu-4
micro-watershed was created. The excel
format file was selected in project window
and in the Y co-ordinates were selected. The
Z field was used for different nutrients. The
korasagu-4 micro-watershed shape file was
also opened and from the surface menu of Arc
2340
Int.J.Curr.Microbiol.App.Sci (2019) 8(5): 2339-2349
GIS spatial analyst “Interpolate grid option”
was selected, on the output “ Grid
specification dialogue” output grid extend
chosen was same as Korasagu-4 microwatershed shape and the interpolation method
employed. The generated map was
reclassified based on ratings of respective
nutrients.
Results and Discussion
In the study area its soil fertility status with
respect to texture, pH, EC, organic carbon,
primary nutrients, secondary nutrients and
micronutrients such as Zn, Fe, Cu, Mn and B
was assessed. The results obtained are
presented and discussed below.
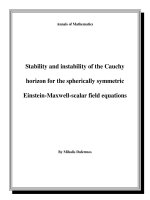
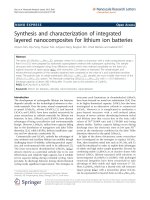
Texture of surface soils
Surface soil texture of Korasagu-4 microwatershed was mainly covered with sandy
clay loam to clay texture (Fig. 3). Sandy loam
texture was observed in 95 ha (9.68%) and
clay texture in 521 ha (53.16%) of the microwatershed. The variation in surface soil
texture may be due to variations in parent
materials, topography, weathering and
translocation of clay. It affects absorption of
nutrients, microbial activities, infiltration and
retention of water, soil aeration, tillage and
irrigation practices (Gupta, 2004).
Soil reaction (pH) and Electric conductivity
(EC)
The soil reaction status (Fig. 4) of the study
area indicated that 51 ha (5.23%) was slightly
acidic (5.0-5.5), 119 ha (12.8%) neutral, 63 ha
(8.39%) was slightly alkaline and 311 ha
(31.71%) was strongly alkaline (8.4 - 9.0) in
nature. The variations in soil pH were due to
the parent material, rainfall and topography
(Tangaswamy et al., 2005). The high pH of
the soil was due the presence of high degree
of base saturation (Meena et al., 2006).
Relatively high pH value in soil was due the
accumulation of exchangeable bases in the
solum. The soils were acidic due to the acidic
parent material (Granite and gneiss).
Therefore, periodically agricultural lime
incorporation is imperative for improvement
of soil pH. The Electric conductivity ranged
from 0.05 to 2.15 ds m-1 indicating soils of
non saline in nature and could be attributed to
leaching of soluble salts and runoff
transportation due to high precipitation (Singh
and Mishra, 2012).
Soil organic carbon, available nitrogen,
phosphorus and potassium
High level of soil organic carbon status was
observed in major area (192 ha). About 533
ha (56.39%) was medium and 177 ha
(18.06%) was low in soil organic carbon
status (Fig. 5). The medium to high organic
carbon status in soil attributed to good
vegetative growth and consequent addition of
organic matter to soil (Patil and Ananth
Narayana, 1990). Low organic carbon in the
soil was due to low input of FYM and crop
residues (Binita et al., 2009). The available
nitrogen status (Fig. 5) of micro watershed
was low in 719 ha (73.37%) and was medium
in 209 ha (21.28%). The variation of nitrogen
content was related soil management,
application of FYM and fertilizer to previous
crop (Ashok, 2000). Low nitrogen was due to
low organic matter content in this soil.
The available phosphorus status was medium
in entire micro watershed area (Fig. 6) and it
was ranged from 20.38 to 66.87 kg ha-1 with a
mean value of 39.07 kg ha-1 (Table 1). This
may be attributed to the semi arid
environment with low rainfall and the
continuous use of high analysis phosphatic
fertilizers especially SSP (Nalina et al., 2016).
The available potassium (K2O) content was
low to high in status (Fig. 6). It was ranged
from 108.33 to 723.88 kg ha-1 with a mean
2341
Int.J.Curr.Microbiol.App.Sci (2019) 8(5): 2339-2349
value of 377.62 kg ha-1 (Table 1). The low to
high status of potassium in surface soil is due
to intense weathering and the release of
potassium from organic residues. Similar
results were reported by Basavaraj et al.,
(2005).
Exchangeable calcium, magnesium and
available sulphur
The exchangeable calcium and magnesium
were sufficient in the entire study area (Fig. 7)
was due to the type and amount of clay. These
results were in confirmation of the findings of
Krishnamurthy (1993) reported the highest
values of exchangeable calcium and
magnesium in surface and sub surface soil.
The available sulphur status was high in 379
ha (38.62%). The high content of organic
carbon couple with fine textured soils in the
study area contributed to higher sulphur
content and 548 ha (55.89%) area was
medium in sulphur content (Fig. 8). The
higher availability of sulphur is due to the
negative charge of the clay which shows
anionic repulsion to sulphate anion (Seta et
al., 2017)
DTPA extractable
available boron
micronutrients
and
Present investigation results indicated that
entire micro watershed area (980.84 ha) was
sufficient in DTPA extractable micronutrients
like copper (Fig. 9), iron (Fig. 9) and
manganese (Fig. 10), while the available zinc
(Fig. 10) was sufficient in 96 ha (9.80%),
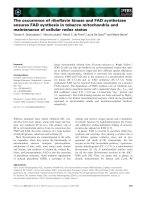
deficient in 832 ha (84.85%) area. The
available boron content was ranged from low
to medium and it was ranged from 0.15-1.43
mg kg-1 with a mean value of 0.64 mg kg-1
(Fig. 11, Table 1).
The DTPA extractable iron content in micro
watershed was sufficient. This might be due
to the granite gneiss parent material which
was known to possess higher iron content. It
was ranged from 2.26 to 38.62 mg kg-1. The
DTPA extractable zinc content showed both
sufficient and deficient. The zinc deficient
was attributed to the alkaline soil condition
which might occur due to high precipitation
of hydroxides and carbonates (Thanga swamy
et al., 2005). The DTPA extractable
manganese content in entire study area was
sufficient. This may be attributed to its higher
content in granite gneiss parent material. The
DTPA extactable copper in the study area
ranged from 0.57- 4.85 mg kg-1. The
sufficiency of copper in study area was
related to its parent material. Majority of
surface soils of the micro watershed, the
boron content was low to medium. Like
sulphur states, available boron status also
closely followed the organic carbon in these
soils.
Correlation co-efficient(r) between soil
organic carbon and soil available nutrients
The soil organic carbon showed positive and
significant correlation with available nitrogen
(r=0.304**).The significant and positive
correlation between organic carbon and
available nitrogen could be because of release
of mineralizable nitrogen from soil organic
matter in proportionate amounts and
adsorption of NH4 –N by humus complexes in
soil. The results are in conformity with those
of Kumar et al., (2014). The significant and
positive correlation between organic carbon
and available phosphorus (r=0.265**) might
be due to acidulating effect of organic carbon,
formation
of
easily
accessible
organophosphate complexes, release of
phosphorus from organic complexes and
reduction in phosphorus fixation by humus
due to formation of coatings on iron and
aluminium oxides. The results are in harmony
with the findings of Singh et al., (2014). A
significant positive correlation (r = 0.311**)
was observed between organic carbon and
2342
Int.J.Curr.Microbiol.App.Sci (2019) 8(5): 2339-2349
available K content (Table 2). This might be
due to creation of favourable soil environment
with presence of organic matter. Similar
relationship was also reported by Chauhan
(2001). Significant positive correlation was
also found between available potassium and
clay content. It might be due to the presence
of most of the mica (biotite and muscovite) in
finer fractions. A positive correlation (r =
0.515**) was observed between organic
carbon and available sulphur content. This
relationship was existed because most of the
sulphur is associated with organic matter
(Nor, 1981). Available Zn was positive and
significantly correlated (r = 0.1**) with
organic carbon (Table 2). Similar result was
obtained by Minakshi et al., (2005) in soils of
Patiala district of Punjab.
Table.1 Chemical properties and nutrient status of Korasagu-4 micro-watershed
Parameters
Soil pH (1:2.5)
EC (ds m-1)
Soil organic carbon(g kg-1)
Available nitrogen (Kg ha-1)
Available phosphorus (Kg ha-1)
Available Potassium (Kg ha-1)
Exchangeable calcium ( Cmol p+ kg-1)
Exchangeable Magnesium ( Cmol p+ kg1
)
Available Sulphur (mg kg-1)
Fe (mg kg-1)
Zn (mg kg-1)
Cu (mg kg-1)
Mn (mg kg-1)
B (mg kg-1)
Range
Mean
5.02 - 8.95
0.05 - 2.15
1.5 – 10.8
8.78 - 420.22
20.38 - 66.87
108.33 - 723.88
4.50 - 29.5
2.0 - 22.25
7.60
0.31
6.02
235.70
39.07
377.62
15.64
10.03
7.68 - 44.18
2.26 - 38.62
0.24 - 0.88
0.57 - 4.85
0.98 - 28.84
0.15 - 1.43
21.17
12.76
0.47
1.78
7.85
0.64
Table.2 Correlation study for soil organic carbon with available macro and micronutrients
Parameters
Organic carbon
-
Organic carbon
Available N
Available P2O5
Available K2O
Exchangeble Ca
Exchangeble Mg
Available S
DTPA Zn
DTPA Fe
DTPA Mn
DTPA Cu
Available B
0.304**
0.265**
0.311**
0.374**
0.525**
0.515**
0.239*
0.261*
-0.453**
-0.431**
-0.250*
** Correlation is significant at the 0.01 level
* Correlation is significant at the 0.05 level
2343
Int.J.Curr.Microbiol.App.Sci (2019) 8(5): 2339-2349
Fig.1 Location map of Korasagu-4 micro watershed
Fig.2 Grid map of Korasagu-4 micro watershed
Fig.3 Soil surface texture map of Korasagu-4 micro watershed
2344
Int.J.Curr.Microbiol.App.Sci (2019) 8(5): 2339-2349
Fig.4 Soil reaction and Electrical conductivity map of Korasagu-4 micro watershed
Fig.5 Soil organic carbon and available nitrogen map of Korasagu-4 micro watershed
Fig.6 Available phosphorus and available potassium map of Korasagu-4 micro watershed
2345
Int.J.Curr.Microbiol.App.Sci (2019) 8(5): 2339-2349
Fig.7 Exchangeable calcium and magnesium map of Korasagu-4 micro watershed
Fig.8 Available sulphur map of Korasagu-4 micro watershed
Fig.9 Available copper and iron map of Korasagu-4 micro watershed
2346
Int.J.Curr.Microbiol.App.Sci (2019) 8(5): 2339-2349
Fig.10 Available manganese and zinc status of Korasagu-4 micro watershed
Fig.11 Available Boron status of Korasagu-4 micro watershed
A significant positive correlation (r =
0.261**) was found between organic carbon
and available Fe content (Table 2). The
availability of metal ion (Fe) increase with
increases in organic matter may supply
chelating agents (Yadav and Meena, 2009).
The increase in availability of sulphur by
organic carbon may be attributed to release of
sulphur from organic complexes as well as
acidulating action of soil organic carbon thus
enhancing the weathering of minerals
containing sulphur. Similar results were
reported by Pareek (2007). The significant
and positive correlation between soil organic
carbon and available iron content might be
due increases in organic matter may supply
chelating agents. Yadav and Meena (2009)
but soil organic carbon showed negative and
significant
correlation
with
available
manganese (r=-0.453**), Copper (r=0.431**) and Boron (r=-0.250*). It shows
with increase in organic carbon availability
Mn, Cu and Born decreases (Table 2).
In short it can be concluded that soils under
study area was strongly acidic to slightly
alkaline in soil reaction with non saline in
nature and soil organic carbon was 5 -18 g
kg-1. The DTPA extractable micro nutrients
like iron, copper and manganese were found
to be sufficient in entire study area. Whereas
zinc was found to be sufficient in 96 ha
(9.8%) and deficient in 832 ha (84.85%) and
boron content was found to be low to
medium. The study highlights the importance
of mapping the parameters which give the
2347
Int.J.Curr.Microbiol.App.Sci (2019) 8(5): 2339-2349
spatial extent rather than the means which
have limited applicability for better soil
management and precise management of
nutrients.
Acknowledgement
Authors are thankful to World Bank for
funding this project under KWDP II,
SUJALA III WDD Government of
Karnataka, Bengaluru.
References
Ashok, K. S., 2000, Studies on soils
aggregation in vertisols of north
Karnataka. M.Sc. (Agri.) Thesis, Univ.
Agril. Sci., Dharwad Karnataka (India)
Basavaraj., Naidu, D., Ramavatharam, M. V.
S., Venkaih, N., Rama Rao, K. G. and
Reddy, K. S, 2005. Characterization,
classification and evaluation of soils in
Chandragiri mandal of Chittoor district,
Andhra Pradesh. Agroped., 15: 55– 62.
Binita, N.K., G.S. Dasog and P.L. Patil. 2009.
Soil fertility mapping in ghataprabha
left bank canal command area of north
Karnataka by geographic information
system technique. Karnataka J. Agric.
Sci., 2 (1): 73-76
Black, C.A. (Ed.), 1965, Methods of soil
analysis, part I and II. American society
of
Agronomy,
Inc.,
Publishers,
Medison, wisconsin, USA.
Burrough, P.A., and McDonnell, R. A.
(1998). Principle of geographic
information systems. Oxford: Oxford
University Press.
Chauhan J.S., 2001. Fertility status of soils of
Birla Panchayat Samiti of Jodhpur
district (Rajasthan). M.Sc. (Ag.) Thesis,
MPUAT, Udaipur.
Gupta, P.K. (2004): Soil, plant, water and
fertilizer analysis. Shyam Printing
Press, Agrobios, India, 38p.
Jackson, ML. 1973. Soil Chemical Analysis.
Second edition. Printice Hall of India,
New Delhi. 498.
John, M. K., Chuah, H. H., and Neufield, J.
H. 1975. Application of improved
azomethine-H
method
to
the
determination of boron in soils and
plants: Analytical Left. 8, 559-568.
Krishnamurthy, K G., 1993, Properties,
genesis and classification of red soil o f
North Karnataka. M. Sc. (Agri.) Thesis,
Univ. Agric. Sci., Dharwad (India).
Kumar, A, Mishra VN, Srivastav LK,
Banwasi R. Evaluation of soil fertility
status of available major nutrients (N, P
and K) and micronutrients (Fe, Mn, Cu
and Zn) in vertisols of Kabeerdham
district of Chhattisgrah, India. Inter. J.
Interdisc. Multidisci. Studies. 2014;
1(2): 72-79.
Lindsay, W. L., and Norvell, W. A. (1978).
Development of a DTPA soil test for
zinc, iron, manganese, and copper. Soil
Science Society of American Journal,
42, 421 – 428.
Medhe, S. R., V. G. Takankhar and A. N.
Salve.
Correlation
of
chemical
properties, secondary nutrients and
micronutrient anions from the soils of
Chakur Tahisil of Latur district,
Maharashtra. Trends in life science,
2012,1(2):34-40
Meena, H. B., Sharma, R. S. and Rawat, R.
S., 2006, Status of Macro and
Micronutrients in some soils of Tonk
district of Rajasthan. J. Indian Soc. Soil
Sci., 54(4): 508- 512.
Minakshi, N.S., Tur, V.K., Nayyar, P.K.
Sharma and Sood, A.K. (2005). Spatial
distribution of micronutrient in soils of
Patiala district – A GIS Approach. J.
Indian Soc. Soil Sci., 53(3): 324-329.
Nalina, C. N., Anil Kumar, K. S.,
Chandrakala, M., Sheela Rani, S.,
Sujata, K., Shilpa Shree, K. G.,
Rajendra Hegde and Sing, S. K. 2016,
Soil nutrient status mapping of
2348
Int.J.Curr.Microbiol.App.Sci (2019) 8(5): 2339-2349
Nagenahalli micro-watershed under
Eastern Dry Zone of Karnataka by
remote sensing, detailed soil survey and
GIS techniques. Indian J.Agric.Res.,
50(5): 389-397.
Nor, Y.M. 1981. Sulphur mineralization and
adsorption in soils. Pl. Soil, 60: 451459.
Patil, P. L and Ananthanarayana, R., 1990,
Determination of lime requirement of
some acid soils of Uttara kannada
district, Karnataka J. Agric. Sci., 3:161170
Pareek, N. Soil mineralisable sulphur a
sulphur availability index. J. Ind. Soc.
Soil Sci. 2007; 3: 289- 293.
Singh, R. P. and Mishra, S. K., 2012,
Available macro nutrients (N, P, K and
S) in the soils of Chiraigaon block of
district Varanasi (U.P) in relation to soil
characteristics. Indian J. Sci. Res., 3(1):
11-21
Singh Nongmaithem Raju, Jhariya MK,
Loushambam RS. Performance of
soybean and soil properties under
poplar based agroforestry system in
Tarai belt of Uttarakhand, India.
Ecology
Environment
and
Conservation. 2014; 20(4):1569-1573.
Subbaiah, BV, Asija GL. A rapid procedure
for the estimation of available nitrogen
in soils. Curr. Sci. 1956; 25:259-260.
SLUSi, (2010). Annual Report 2009-2010.
Soil and Land Use Survey of India.
Kodigehalli Road, Bangalore, India.
Thangasamy, A., Naidu, M. V. S.,
Ramavatharam, N. and Reddy, R. C.,
2005, Characterization, classification
and evaluation of soil resources in
Sivagiri micro-watershed of Chittoor
district in Andhra Pradesh for
sustainable land use planning. J. Indian
Soc. Soil Sci., 53: 11–21.
Walkley, A.J., and Black, I.A. (1934).
Estimation of soil organic carbon by the
chromic acid titration method. Soil
Science, 37, 29-38.
Yadav, R. L. and Meena, M. C. (2009).
Available micronutrients status and
relationship with soil properties of
Degana soil series of Rajasthan. Journal
of the Indian Society of Soil Science.
57(1): 90-92.
How to cite this article:
Gurumurthy, K.T., D. Ravikumar, A.V. Priyanka, Anantakumar Patil, M.D. Rudresh, K.M.
Vasanthkumar, S. Raghavendra and Raghu, A. N. 2019. Appraisal and Mapping of Soil
Fertility Status for Korasagu-4 Micro watershed, Channagiri Taluk, Davanagere District,
Karnataka, India. Int.J.Curr.Microbiol.App.Sci. 8(05): 2339-2349.
doi: />
2349