Stratification of plot scale vegetation in agroforestry dusung patterns in the Toisapu hamlet, Ambon city, Indonesia
Bạn đang xem bản rút gọn của tài liệu. Xem và tải ngay bản đầy đủ của tài liệu tại đây (287.64 KB, 7 trang )
Int.J.Curr.Microbiol.App.Sci (2019) 8(6): 17-23
International Journal of Current Microbiology and Applied Sciences
ISSN: 2319-7706 Volume 8 Number 06 (2019)
Journal homepage:
Original Research Article
/>
Stratification of Plot Scale Vegetation in Agroforestry Dusung Patterns in
the Toisapu Hamlet, Ambon City, Indonesia
Alvanolis Ivanno Passal*, Gun Mardiatmoko and Fransina Latumahina
Postgraduates, Forest Management Study Program Universitas Pattimura Ambon, Indonesia
*Corresponding author
ABSTRACT
Keywords
Agroforestry,
Dusung vegetation
system
Article Info
Accepted:
04 May 2019
Available Online:
10 June 2019
The study was carried out in the Dusung Community Forest (Agroforestry) area of Toisapu
Negeri Hutumuri Hamlet, South Leitimur Subdistrict, Ambon City in August - October
2018 to determine the condition of stratification of stands based on ecological conditions
in dusung agroforestry systems in Toisapu Hamlet. The study was begun with an inventory
of potential at the seedling, sapling, pole and tree levels to see vegetation. The results of
the study on three measurement plots have different types of vegetation specifically for
stratification of pole and tree level vegetation. Based on the results of inventory types and
calculation of plant density index (INP Value) for tree level and pole in Plot 1 plot, Plot 2
and Plot 3, there were five dominant types of vegetation, Nutmeg (Myristica fragrans),
with INP = 39, 9, Durian (Durio zibethinus) with INP = 86.6, Langsat (Lansium sp) with
INP = 43, Duku (Lansium domestisum) with INP = 103 and Clove (Eugenia aromatica)
with INP = 27.4.
trees of various sizes. Tropical rainforest is
the most fertile type of vegetation. Arief
(1986) in Idriyanto (2008) explains that in
tropical rainforests there are canopy
stratification from various tree species that are
of different heights. These characteristics are
owned by tropical rain forests. In Indonesia,
tropical rainforests are found in Sumatra,
Kalimantan, Sulawesi, Maluku, and Irian
Jaya. This forest has about 3,000 large tree
species and is included in 450 genera.
Introduction
Indonesia is one of the countries included in
megadiversity, which is a country that has
high diversity. MOH R.I (2007), added that
Indonesia was the center of biodiversity and
was ranked as the second richest in the world
after Brazilia. It is estimated that around 25%
of the various species in the world are in
Indonesia, of which each contains thousands
of non-plasma plasma in unique combinations
so that there are various genes in individuals
(Arief, 2001). Most of Indonesia's forests are
included in tropical rainforests, which are
complex communities, places that provide
Community forests in Indonesia that are
developed with agroforestry patterns will
provide results that are not only wood but also
17
Int.J.Curr.Microbiol.App.Sci (2019) 8(6): 17-23
fruits, food, medicines, bamboo, industrial
plants, spices and so on.
Hutumuri Hamlet, South Leitimur Subdistrict,
Ambon City, which are astronomically
located at 03º 40 '06.7 "South Latitude and
128º 17' 36.8" East Longitude with location
elevations 50-100 asl (Fig. 1 and 2).
The number of types of plants that make up
community forests with agroforestry systems
has an impact on the period of acceptance. By
using time management, it will greatly benefit
farmers because they can meet their needs.
Tools and materials
The equipment used was, Phiband, Roll
meter, camera, raffia, machete, Hagameter
and Garmin GPS. Materials included scale
stands of plots with a measuring plot gradient
of 20 x 20m²; 10 x 10 m² for measuring the
height and diameter of various tree stands; 5 x
5 m² and 2 x 2 m² plot gradients, for
understorey measurements.
The character of the dusung agroforestry
system in the Maluku Islands is generally
located in 1–10 Km of land settlements with
wet lowlands (0 - 500 masl), so that fruits
(Duren, Nutmeg, Mangosteen, Duku,
Langsat), spice plants (Nutmeg, Clove,
Pecan) and food crops (Tubers and Bananas)
are very dominant according to soil
conditions (Wattimena, 2007). The type of
land use at the study site has developed into a
dry land gardening area mixed with shrubs
with various types of fruit trees, timber and
lower-level plants. This area has hilly forest
vegetation with woody vegetation, namely,
Linggua (Petrocarpus Indicus), Samama
(Anthocepalus
Macrophylus),
Walnuts
(Canarium Indicum), Kenanga (Cananga
Odorata), Coastal Bintanggor (Callophylum
Inophylum L), Pulai (Alstonia Schlolaris),
Kayu Besi Pantai (Insia sp), Ketapang
(Terminalia Catappa), Cemara Pantai
(Kasuarina sp). Fruit plants namely Mango
(Mangifera
indica),
Durian
(Durio
zibhethinus), Duku (Lansium domesticum),
Langsat (Langsium sp), Guava (Myrtaceae)
and plantation vegetation such as Nutmeg
(Miristyca
fragans)
Coconut
(Cocos
nucifera), Clove (Eugenia aromatica), shrub
vegetation is dominated by Alang-alang
(Imperata cilindrika) and ferns (Nephrolepsis
exaltata).
Research methods
Primary data collection was done through
direct observation and measurement of the
object of research in the field by inventorying
the potential of vegetation at seedlings,
saplings, poles and trees.
The vegetation sampling technique was
carried out by 100% vegetation survey of
sapling, pole and tree levels (calculation using
allometric equations with diameter variables
at chest height). The samples were taken from
all observation lines with the width and length
size of the plot 20 x 20 m² and 10 x 10 m² for
measuring the height and diameter of tree
stands while 5 x 5 m² and 2 x 2 m² measuring
plots, for understorey measurements.
Data analysis
Data analysis using several calculation
methods INP value was calculated based on
the sum of the value of Relative Density
(KR), Relative Frequency (FR) and Relative
Dominance (DR). The amount of INP in a
vegetation was calculated by the following
equation (Soerianegara and Indrawan, 1983).
Based on these equations, to calculate the
species INP size:
Materials and Methods
Time and location of research
The research was carried out on dusung areas
in community forest of Toisapu Negeri
18
Int.J.Curr.Microbiol.App.Sci (2019) 8(6): 17-23
Sapling, pole and tree phases used the
following formula
tree level was based on the results of
inventory types and calculation of plant
density index (INP value). Meanwhile, tree
and pole levels in Plot 1 plots 2 and plot 3
used area size of Plot. For instance, 0.12 ha
showed the distribution of vegetation species
as in the following table 1.
INP = RD + RF + RD
The dominant distribution of plant species in
the three plots for tree growth was dominated
by 5 types of plants, namely Nutmeg
(Myristica fragrans), with INP = 39.9, Durian
(Durio zibethinus) with INP = 86.6, Langsat
(Lansium sp) with INP = 43, Duku (Lansium
domestisum) with INP = 103 and Clove
(Eugenia aromatica) with INP = 27.4.
Based on the results of the calculation of
vegetation density, the plants that have the
highest INP value are Duku plants followed
by Durian plants and finally clove plants.
Based on the results of vegetation analysis in
Table 1, it was concluded that for tree level
stands the Duku and Langsat plants spread
more evenly than the other types. This was
indicated by the frequency value category of
these two types of plants, which are larger
than other types of plants. Whereas, Durian
and Duku trees have more species per unit
area than other types of plants, so the value of
the plant density is also greater. In addition,
the Duku and Durian plants also have a
greater dominance value so that these two
types control the growing space in the
vegetation community for each measurement
plot.
Results and Discussion
Vegetation analysis in measurement plots
The diversity of plant species found in each
community forest with a dusung system on
Ambon Island has a different structure and
stratification of vegetation. The highest
number and species were found in agroforest
because local people through generations with
diversification perennial cultivation plants
(fruits, cloves and nutmeg) have managed
forestland.
To determine the density of vegetation
species, the composition (type composition)
and shape (structure) of vegetation were
studied at a stretch of forest area. Vegetation
analysis answered the dominant plant species
and gave the main characteristics of the plant
community at the plot level. The size of
vegetation dominance was expressed in the
form of canopy closure, basal area, important
value index and comparison of important
values (Indriyanto, 2006).
Distribution of plant species for the three
sample plots at the level of the pole level
growth is 6 types, namely Nutmeg, Durian,
Langsat, Duku, Mangosteen and Clove. Based
on the calculation of INP value, the plants that
have the largest INP value are Langsat plants
with INP values = 92.5, followed by each
type of Nutmeg plant with INP value = 60.9,
Durian with INP value = 51.4, Duku with INP
The results of the three measurement plots
had different types of vegetation that differed.
The stratification of vegetation at the pole and
19
Int.J.Curr.Microbiol.App.Sci (2019) 8(6): 17-23
= 41.6, Cloves with INP = 32.5; and the
smallest is Mangosteen with INP = 21.1.
Distribution of plant species in the three
carbon measurement plots of the research
location can be seen in the table 2.
study area. According to Martono (2012),
species diversity index is important
information about a community.
The wider the sample area and the more
species encountered, the index value of
species diversity tends to be higher. A
relatively low diversity index value is
common in communities that have reached a
climax. The data in the table 2 is very relevant
to the opinion that for both the type of tree
level growth and the level of the pile, the
value of the diversity index is relatively the
same, as in table 3.
Based on the results of analysis of pole level
vegetation according to the information in the
table 2, that the types of Duku plants, Durian
and Langsat spread very evenly compared to
other types of plants.
This is indicated by the amount of the
frequency value that is seen based on the
results of measurements and calculations.
The number of randomly formed plant
communities usually determines the high
diversity of vegetation. Communities that are
very stable, extensively regional, and
homogeneous, usually have a lower diversity
index than forest areas with no diverse
vegetation or forests with a wider scale will
experience periodic disturbances due to
natural factors that occur for example by fire,
wind, flood, pests, and human intervention.
However, if viewed from the average value of
the overall distribution of vegetation types,
the pole level is uniform because the results
of the assessment of the frequency values for
all types of plants do not show a significant
difference.
The types of nutmeg and Langsat plants have
more plants per unit area of the base
compared with the other three types of plants,
because the density value of these plants is
greater. Besides that, the stands of Langsat
and Durian plants also have a greater
dominance value because of the nature and
character of the trees that control almost the
majority of vegetarian communities in the
The three carbon measurement plots where
tree level stands with diversity index values
ranged from 0.21 to 0.37, while in pole level
stands, diversity index values ranged from
0.11 - 0.37.
Table.1 Tree level stand density value in three measurement plots
No
Jenis Pohon
1 Nutmeg (Myristica
fragrans)
2 Durian (Durio zibethinus)
3 Langsat (Lansium sp)
4 Duku (Lansium
domestisum)
5 Clove (Eugenia
aromatica)
TOTAL
∑
9
D
RD
F
RF
D
7,5 12,33 0,67 18,18 0,22
RD INP
9,39 39,9
27 22,5 36,99 0,67 18,18 0,73 31,47 86,6
6
5 8,22
1 27,27 0,17 7,53
43
25 20,83 34,25
1 27,27 0,96 41,52 103
6
5
8,22 0,33
9,09 0,23 10,09 27,4
73 60,83
100 3,67
100 2,32
Research Data (Processed, 2018)
20
100
299
Int.J.Curr.Microbiol.App.Sci (2019) 8(6): 17-23
Table.2 Pole level stand density value in 3 carbon measurement plots
No
1
2
3
4
5
6
Pole type
Nutmeg (Myristica fragrans)
Durian (Durio zibethinus)
Langsat(Lansium sp)
Duku (Lansium domesticum)
Manggis (Garcinia
manggostana)
Clove (Eugenia aromatica)
TOTAL
∑
22
8
19
5
2
D
73,33
26,67
63,33
16,67
6,67
RD
36,07
13,11
31,15
8,2
3,28
F
0,67
1
1
1
0,67
RF
13,33
20
20
20
13,33
D
0,28
0,45
1,01
0,33
0,11
RD
11,51
18,29
41,37
13,4
4,46
INP
60,9
51,4
92,5
41,6
21,1
5
61
16,67
203,33
8,2
100
0,67
5
13,33
100
0,27
2,45
10,98
100
32,5
321
Source: Research Data (Processed, 2018)
Table.3 Vegetation diversity index in 3 measurement plots
No
Tree Type
1
Nutmeg (Myristica fragrans)
ShannonWinner
Index(H)
0,26
Pole Type
Nutmeg (Myristica fragrans)
ShannonWinner
Index(H)
0,37
2
3
4
Durian (Durio zibethinus)
Langsat (Lansium sp)
Duku (Lansium domesticum)
0,37
0,21
0,37
Durian (Durio zibethinus)
Langsat (Lansium sp)
Duku (Lansium domesticum)
0,27
0,36
0,21
5
6
Clove (Eugenia aromatica)
0,21
Manggis (Garcinia manggostana)
Clove (Eugenia aromatica)
0,11
0,21
Source: Research Data (Processed 2018)
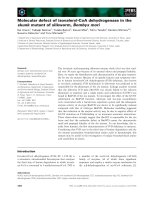
Fig.1 Research location, Toisapu Negeri Hutumuri Hamlet & shape and size of the sampling plot
21
Int.J.Curr.Microbiol.App.Sci (2019) 8(6): 17-23
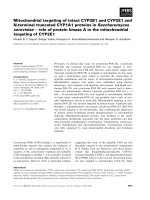
Fig.2 Shape and size of the sampling plot
20m
10m
5m
2m
A 2m
B 5m
C 10m
D 20 m
Based on the Shannon-Winer diversity index
criteria, for the two levels of growth this stand
had a low diversity. This showed that habitat
conditions in the three measuring plots are
relatively homogeneous, when viewed from
the aspect of disturbance to the ecosystem,
because there were no any periodic crop
destruction activities in the Toisapu Negeri
Hutumuri Hamlet as the research location.
References
Indriyanto. 2006. Ekologi Hutan [Forest
Ecology]. Buku. PT Bumi Aksara.
Jakarta. 210 p.
Martono, D. S. (2012). Analisis vegetasi dan
asosiasi antara jenis-jenis pohon utama
penyusun hutan tropis dataran rendah di
Taman Nasional Gunung Rinjani Nusa
Tenggara Barat [Analysis of vegetation
and associations between major tree
species composing lowland tropical
forests in Gunung Rinjani National
Park, West Nusa Tenggara]. Jurnal
Agri-Tek, 13(2).
Soerianegara I dan IndrawanA, 1983. Ekologi
Hutan Indonesia [Indonesian Forest
Ecology]. Institut Pertanian Bogor.
Wattimena, G.A. 2007. Agroforestri di
Maluku [Agroforestry in Maluku].
Makalah Diskusi Panel Alumni SMU
Negeri 2 Ambon. TMII Jakarta.
Wattimena C.M.A, 2008, Evaluasi Pola
Tanam Dusung Sebagai Sebuah Sisitim
Agriforestry Tradisional di Kota Ambon
[Evaluation of Dusung Planting Patterns
as a Traditional Agroforestry System in
Ambon City]. Tesis Program Studi Ilmu
Kehutanan, Universitas Gadjah Mada
(tidak dipublikasikan).
This is understandable because the area is a
community plantation forest area or dusung
agrofotrestry system, which has become a
community plantation area which is preserved
and the needs of the community around the
community forest area.
In conclusion, plant types in plot 1 were
dominated by nutmeg (Miristica fragrans)
plants, plots of Durian (Durio zibethinus)
plants and plots of Duku plants (Lancium sp)
with an average density of plant species for
INP tree level stands of 299 and for pole stand
INP values of 321. The Shannon-Winer
diversity index value or 'H' value in the three
carbon measurement plots for tree level
stands ranged from 0.21 - 0.37, while for pole
level stands, the diversity index value ranged
from 0.11 - 0.37.
22
Int.J.Curr.Microbiol.App.Sci (2019) 8(6): 17-23
How to cite this article:
Alvanolis Ivanno Passal, Gun Mardiatmoko and Fransina Latumahina. 2019. Stratification of
Plot Scale Vegetation in Agroforestry Dusung Patterns in the Toisapu Hamlet, Ambon City,
Indonesia. Int.J.Curr.Microbiol.App.Sci. 8(06): 17-23.
doi: />
23