Geographic origin classification and simultaneous determination of methylxanthines in vietnamese tea using chemometrics based on the near infrared reflectance spectroscopy
Bạn đang xem bản rút gọn của tài liệu. Xem và tải ngay bản đầy đủ của tài liệu tại đây (892.87 KB, 7 trang )
Tạp chí Khoa học & Công nghệ Số 6
33
Geographic origin classification and simultaneous determination
of methylxanthines in vietnamese tea using chemometrics based
on the near infrared reflectance spectroscopy
Tran Thi Hue1,*, Bui Duc Tho2, Nguyen Van Ri2 , Ta Thi Thao2,**
1
Faculty of chemistry, Thai Nguyen University of education
Faculty of chemistry, VNU University of science
*
, **
2
Abstract
This paper reported the results of classification of geographic origin and simultaneous analysis
of three methylxanthines (caffeine, theobromine, theophylline) in Vietnamese tea samples by the
infrared reflectance spectrophotometry coupled with chemometrics. The spectral range was
10,000-4,000cm-1 and each spectrum was measured at 2 cm-1 intervals. For the purpose of
geographic origin classification, this study used FT-NIR spectroscopy combined with Partial
Least Squares Discriminant Analysis (PLS-DA), and Principal Component AnalysisDiscriminant Analysis (PCA-DA). The ability to determine the origin of tea samples in the
prediction set of PLS-DA model is 100%. Using the same IR spectral database combined with
the partial least squares (PLS), three methylxanthines in tea samples are also quickly quantified.
The PLS model based on the spectra of 24 tea samples in which the contents of 3 analytes were
determined by high performance liquid chromatography- HPLC) were applied for simultaneous
determination of caffeine, theobromine and theophylline in samples. The determination of
methylxanthines in 7 tea samples in test set gave the good accuracy of the PLS model. The
correlation coefficients (R2) in the prediction set were of 0.9582, 0.8894 and 0.9303 for
theobromine, theophylline, and caffeine, respectively. This work demonstrated that infrared
reflectance spectrophotometry combined with chemometrics could be applied to rapidly classify
the geographic origin and simultaneous determination of main contents in green tea.
Nhận
20.05.2019
Được duyệt 14.06.2019
Công bố
26.06.2019
Keywords
caffeine,
theobromine,
theophylline,
multivariable
regression, tea,
infrared reflectance
spectrophotometry
® 2019 Journal of Science and Technology - NTTU
1 Introduction
Tea (Camellia Sinensis L) was discovered very early about 2700
BC. Tea becomes a cultural popular drink in almost every social
activities and penetrates into daily life in Vietnam. Nowadays,
tea have been varieties in the market not only from botanical
standpoints but also in terms of quality attributes. Catechins,
together with phenolic acids, are a group of polyphenols that are
important factors in the taste of tea. Caffeine, theophylline, and
theobromine are the main methylxanthines constituting the tea
alkaloids, being important factors in the quality of teas. Many
factors can contribute to the chemical composition and taste of
tea, such as species, season, age of the leaves, climate and
horticultural conditions. Thus, green teas cultivated in different
geographical areas will present significant differences in their
chemical compositions[1].
Traditionally, sensory evaluation is used to discriminate the
geographic origin of tea. However, using sensory evaluation
to identify tea is imprecise, as it can be easily influenced by
other factors, including the environment and the mood of the
evaluator[2,3]. So far, there have been many analytical
methods have proved to be effective for quality control of
tea. Several authors propose capillary electrophoresis as the
technique to be used[4,5]. Many works have been reported
including high-performance liquid chromatography (HPLC)
determinations of these tea polyphenols with isocratic[6] and
gradient elution[7-10]. However, the above chemical
analysis methods are complex, time-consuming, laborintensive, costly and require large amounts of organic
solvents. Therefore, a rapid and accurate analytical method
is required to discriminate the geographical indicator of tea
origin. Fourier Transform Infrared (FT-IR) spectroscopy is a
Đại học Nguyễn Tất Thành
Tạp chí Khoa học & Công nghệ Số 6
34
powerful analytical tool because it is fast and nondestructive. Recently, IR spectroscopy has been applied for
the simultaneous analysis of free amino acids, caffeine, total
polyphenols and amylose in green tea[11-15].
Vietnam has 35 tea producing provinces with a total area of
125,000 hectares, most of them in the Northern Midlands,
North Central and Central Highlands provinces. Every year,
Vietnam's tea exports reach over US $ 100 million. Vietnam
has exported tea to 107 countries, ranking 7th in export
volume (987.3 thousand tons in 2018), ranking 6th in export
value. However, in our country the classification of different
types of tea is still based on the sense[19].
In this study, we developed a method using IR spectroscopy
to simultaneously analyze three methylxanthines and
discriminate the geographic origin of Vietnamese tea.
Statistical algorithm used in this paper was PLS. Pattern
recognition techniques, such as PLS-DA and PCA-DA, were
applied for classification purposes.
2 Material and methods
2.1 Instruments
A HPLC system (Shimadzu LC- 20A system) equipped with
a dual wavelength absorbance detector and LiChrospher C18 reverse phase (5µm x 250mm x 4.6mm) column was
used. The mobile phase containing 85% buffer (potassium
phosphate, pH 3.0) and 15% acetonitrile with 1.2ml min-1
flow rate was used and the detector was set at 271nm.
The infrared reflectance analysis using Thermo scientific
series Nicolet iS50 NIR was used. Each spectrum consists of
3000 values of intensities at 2cm-1 intervals in the
wavenumber range 10,000-4,000cm-1. An Eureka HD-40
30L dehumidifier was used for removing water of samples
before NIR analysis.
2.2 Sampling and sample preparation for analysis
A total of 57 green tea samples which have a identified
geographical origin, directly taken in the process of
harvesting and processing in the provinces of Thai Nguyen
(23 samples), Lam Dong (14 samples), other provinces
such as Ha Giang, Yen Bai, Tuyen Quang, Hoa Binh (20
samples) was collected. The original and botanical
information of the samples were recognized by onsite
collection (for setting up the model) or based on the
package (for comparison of the geographical origin
between predicted and trade result). About 100g of airdried tea-leaves were kept at least 2 days in a dehumidifier
at the 30% moisture before analyzing.
All the NIR analysis were carried out in a separated chamber
with 30% moisture of air. The dried tea samples were ground
in a laboratory grinder to obtain tea powder through to 240
(63μm) mesh BS sieves. Dry tea powder (about 5g) was put
in to a sample cup in the standard procedure. Each tea sample
was measured five times and then average of the five spectra
Đại học Nguyễn Tất Thành
collected from the same tea sample was used for further
analysis.
In order to obtain known and reference concentrations for
setting up the multivariate models, methylxanthines contents
in real samples were measured by reverse phase- high
performance liquid chromatography (RP-HPLC). Because
caffeine is very soluble in boiling water (66 g/100 mL), the
methylxanthines were extracted out of tea samples by using
boiling water. Approximately 2.0 g tea powders, accurately
weighed, were extracted twice with 50mL double-boiling
distilled water 95-1000C [6], and let to stand for 5 minutes.
The infusions were filtered with filter paper, and diluted to
100mL with double-distilled water. The tea brews were
filtered through a 0.45µm membrane filter and analyzed
immediately.
2.3 Spectral pre-treatment
In this study, the spectral pre-treatment was done using three
algorithms: mean centering (MC), multiplicative scatter
correction (MSC) and standard normal transformation
(SNV). The MC is used for calculating the average spectrum
of the data set. The MSC is the extraction algorithm and
multiplied by the linear individual spectra with a mean score.
SNV is a mathematical transformation method of the log
(1/Intensity) spectra, used for removal of slope variations
and to correct scatter effects[11]. After spectral pretreatment, the PLS algorithm was applied for calculating the
content of three methylxanthines in the tea samples.
2.4 Statistical analysis
Pattern recognition techniques, such as Partial Least Squares
Discriminant Analysis (PLS-DA), and Principal Component
Analysis-Discriminant Analysis (PCA-DA) were applied for
classification purposes. Multivariate calibration of partial
least square (PLS) was performed using Matlab 2016a. The
values of coefficient of determination (R2) and root mean
square error of calibration (RMSEC) were used as
performance criteria for calibration model [16].
RMSEC =√
2
∑𝑛
𝑖=1(𝑎𝑐𝑡𝑢𝑎𝑙−𝑐𝑎𝑙𝑐𝑢𝑙𝑎𝑡𝑒𝑑)
𝑁−𝑓−1
The smaller RMSEC value, the less uncertainty of
calibration is [17]. Also, R2 values and root mean square
error of prediction (RMSEP) together can show how well the
developed model for quantitative analysis of new samples;
the lower the RMSEP value, the better the prediction
performance of the model.
2
∑𝑛
𝑖=1(𝑎𝑐𝑡𝑢𝑎𝑙−𝑐𝑎𝑙𝑐𝑢𝑙𝑎𝑡𝑒𝑑)
RMSEP = √
𝑀−1
The term “actual” means the concentrations (determined by
HPLC) of selected samples; and the term “calculated” refers
to the concentrations calculated by the model using spectral
data; N and M are the number of samples used in the
calibration and validation sets, respectively; f is the number
of factors used in the calibration model by PCA or PLS.
Tạp chí Khoa học & Công nghệ Số 6
35
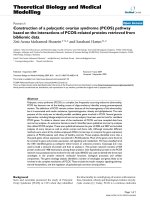
3 Results and discussion
3.1 Simultaneous analysis of three methylxanthines in tea
samples
3.1.1 Analysis of methylxanthines by RP-HPLC
Prior to quantitative analysis by IR spectroscopy, the HPLC
reference method has to be established. The contents of 3
methylxanthines in 32 tea samples (16 samples from Thai
Nguyen, 6 samples from Lam Dong and 10 samples from
other provinces) were quantified. The remaining amounts of
samples were kept for IR analysis. Figure 1 shows the typical
chromatograms of a standard solution and a tea sample. The
results obtained after analyzing the tea samples, expressed in
mg/g, on dry basis, are depicted in Table 1.
mAU(x100)
271nm,4nm (1.00)
4.0
4.0
mAU (x100)
271nm,4nm (1.00)
3.5
3.5
3.0
3.0
Theophyllin
e
Theobromin
e
2.5
2.0
2.5
1.5
2.0
1.0
0.5
1.5
Caffeine
0.0
1.0
-0.5
Standard solution
0.0
2.5
5.0
7.5
10.0
min
Tea sample
0.5
0.0
-0.5
0.0
5.0
10.0
15.0
20.0
25.0
min
Fig. 1 Typical Chromatograms of a standard solution and a tea sample
Table 1 The contents of caffeine (CAF), theophylline (TP), theobromine (TB) in the analyzed tea samples
(studied provinces: TN- Thai Nguyen; LD- Lam Dong; YB- Yen Bai; TQ- Tuyen Quang- HB- Hoa Binh)
No.
1
2
3
4
5
6
7
8
9
10
11
12
Contents (mg/g)
TB
TP
CAF
No.
Region
Sample
TN1
4.46
4.34
49.35
19
Hoa Ninh – LD
LD3
5.07
3.05
23.59
TN2
6.01
4.32
44.02
20
Tam Chau – LD
LD4
1.96
3.39
17.93
TN3
3.59
4.64
47.37
21
Tam Chau – LD
LD5
4.06
3.79
35.23
TN4
2.94
4.44
45.47
22
Tam Chau – LD
LD6
2.49
3.25
23.93
TN5
4.16
4.89
43.99
23
CTK1
4.20
5.48
63.51
TN6
3.34
4.43
56.26
24
Mu Cang Chai –
YB
Hong Ca – YB
CTK2
1.58
4.09
33.48
TN7
4.53
5.03
70.16
25
Tran Yen – YB
CTK3
3.35
3.56
26.98
TN8
4.52
4.95
68.00
26
Ham Yen- TQ
CTK4
2.93
5.27
61.77
TN9
4.92
5.55
54.95
27
Ha Giang
CTK5
5.49
2.70
58.06
TN10
5.12
6.79
77.72
28
Ha Giang
CTK6
3.31
2.38
79.39
TN11
4.19
4.95
62.52
29
Lac Son –HB
CTK7
2.85
3.70
50.56
TN12
3.36
6.92
77.01
30
Lac Thuy -HB
CTK8
3.20
4.35
50.73
Region
Sample
Tan CuongTN
Tan CuongTN
Tan CuongTN
Tan CuongTN
Tan CuongTN
Tan CuongTN
Tan CuongTN
Tan CuongTN
Tan CuongTN
Tan CuongTN
Tan CuongTN
Tan CuongTN
Contents (mg/g)
TB
TP
CAF
Đại học Nguyễn Tất Thành
Tạp chí Khoa học & Công nghệ Số 6
36
TN13
2.27
4.52
51.48
31
Lac Thuy –HB
CTK9
2.82
3.89
47.08
14
Tan CuongTN
Dai Tu-TN
TN14
4.00
5.17
53.00
32
Lac Thuy -HB
CTK10
4.62
4.76
56.47
15
Dai Tu-TN
TN15
4.18
4.70
45.33
16
Dai Tu-TN
TN16
3.42
5.14
64.46
LD1
3.61
1.34
21.78
LD2
3.66
2.66
24.62
13
17
18
Di Linh –
LD
Bao Lam–
LD
Results in table 1 revealed the significant differences in
methylxanthine’s contents in samples collected in the three
regions studied. Lam Dong tea tend to be distinguished by
lower contents of methylxanthines compared to those from
Northern Midlands. The methylxanthine contents of the
studied tea samples may be influenced by the difference of
climate, horticultural conditions.
3.1.2 Spectral pre-treatment
Figure 2-(a) shows FT-NIR spectra of 57 tea samples in
infrared reflectance region (10,000 cm-1 - 4,000 cm-1). The
spectral region from 9,000 cm-1 to 4,500 cm-1 is known as the
(a)
(b)
functional group signal (such as C-H, O-H and N-H) with the
intensive peaks that are caused by the stretch or deformation
vibration. Therefore, the spectral regions from 9000cm-1 to
4500cm-1 were chosen for further making calibration
models. Due to the changes of experimental conditions in IR
measurements, algorithms of pre-treatment spectra are
necessary to be applied.
The pre-treatment spectra obtained by three algorithms are
shown in Fig. 2- (b,c,d). The MC pre- treatment spectra gave
the better results in classification to SNV and MSC and
therefore can be used for making calibration models.
(c)
(d)
Fig. 2 IR spectra (Intensity versus wavenumbers) of green tea samples obtained from: (a) raw spectra,
(b) MC pre- treatment spectra, (c) SNV pre- treatment spectra, d) MSC pre-treatment spectra
3.1.3 PLS model for simultaneous quantitative analysis
The NIR spectra region contains bands that often overlap
making it difficult to extract spectral signal of individual
bands. Chemometrics has provided a way of overcoming
these problems through empirical models that relates the
multiple spectral intensities from many calibration samples
to known analytes in these sample. Despite the lack of
distinct speaks, it has been shown the PLS can extract
relevant information for quantitative determination [5].
Đại học Nguyễn Tất Thành
For the purpose of quantitative analysis, total 32 standard
samples were randomly divided into two subsets. The first
subset called calibration set (25 standard samples) was used for
building model, while the other called prediction set (7 known
samples) was used for testing the accuracy of model.
Optimization of spectral Data
The PLS multivariate regression for simultaneous
determination of CF, TB, TP in tea samples was based on the
content matrix of 3 analytes in 25 standard samples
determined by HPLC. The spectral signal of 25 samples at
Tạp chí Khoa học & Công nghệ Số 6
37
2334 wavenumbers were the IR intensity in the spectral
region of 9,000 -4,500cm-1.
The accumulated percent variance explained by components
in PLS is performed in Fig. 3. It is clear that first seven
components already explained for more than 95% of the total
variance. Hence the calculation will be started from 7
components only.
Fig. 3 Accumulated Percent variance explained by components for PLS calibration modelAs shown in Table 2,
the maximum value of R2 and minimum RMSEC, RMSEP values calculated with first 7 PLS components were better compared
to 8 principal components (PC). Hence the further PLS calibrations would conduct with first seven components.
Table 2 RMSEC, RMSEP and R2 values corresponding to 7 or 8 PLS components
R2
No. of
PC
7
8
TB
0.88
0.82
TP
0.95
0.95
CF
0.93
0.88
RMSEC
TP
0.54
1.25
TB
0.42
0.56
TB
0.59
0.64
RMSEP
TP
0.64
0.88
CF
0.45
0.83
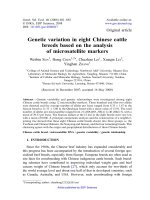
using multivariate models (correlation coefficients were
0.8893 to 0.9582 and intercepts were approximately to zero
showed no system error happened). Therefore, it is possible
to apply the PLS method to simultaneously quantify 3
methylxanthines in a tea sample without digestion and
separation before analysis.
6,00
R² = 0,8894
R² = 0,9582
3,00
Theobromin
Theophyllin
2,00
1,00
0,00
0,00
1,00
2,00
3,00
4,00
5,00
Property NIR (mg/g)
6,00
Property HPLC(mg/g)
4,00
Measured content (mg/g) (by HPLC)
80,00
5,00
Property HPLC(mg/g)
Measured content (mg/g) (by HPLC)
Validation of the quantitative model
The calibration models were further validated using 7 tea
samples having known concentrations by HPLC. The good
models also were evaluated through the highest R2 and
lowest RMSEP. Figure 4 shows that there is a good match
between three methylxanthine contents found in tea samples
by HPLC (measured contents) with predicted content found
CF
4.71
5.67
R² = 0,9303
70,00
60,00
50,00
40,00
Caffein
30,00
20,00
10,00
0,00
0,00
20,00
40,00
60,00
80,00
Predicted content
(mg/g)
(by NIR)
Property
NIR (mg/g)
Predicted content (mg/g) (by NIR)
Fig. 4 Linear regression plot of measured versus predicted content of methylxanthines
Đại học Nguyễn Tất Thành
Tạp chí Khoa học & Công nghệ Số 6
38
3.2 Geographical Classification of Tea samples
In Northern Midlands (Thai Nguyen, Ha Giang, Yen Bai, Tuyen
Quang, Hoa Binh), tea is grown on limestone Ferral soil, with
tropical monsoon climate. In a climate with long lasting cold (56 months/year), tea grows relatively slowly, contributes to the
slow accumulation of nutrients, making the tea in these provinces
always have a strong taste. Compared to tea in the Northern
Midlands Lam Dong tea is grown on fertile bazan soil so Lam
Dong tea grows faster than Northern tea.
For chemometric calculations, the tea samples were divided
into three groups: the green tea from Thai Nguyen (23
samples), Lam Dong (14 samples) and other provinces green
(20 samples). Pattern recognition procedures were applied to
these data sets, trying to classify the tea samples according to
their geographical origin.
In this study, the supervised classification algorithms: Principal
Component Analysis coupled with discriminate analysis-(PCADA) and PLS-DA were applied based on FT-IR spectra of 57
tea samples. The construction of the multivariate classification
models was performed using a training set (51 samples). Each
model was validated using the leave-one-out cross-validation
technique. A test set (6 samples) was then used for final data
evaluation and comparison to the classification models. The
performance of the models was evaluated by accuracy, which is
defined as the ratio of samples in the test set correctly assigned
into their respective classes.
3.2.1 Selection of principal components
PCA is a statistical method to transform multiple indicators into
several representative aggregative indicators. Redundancy
information is reduced from a high-dimensional space to a low
dimensional space by using PCA. The vectors obtained from
each principal component are orthogonal. As shown in Figure
5, the first principal component (PC1) accounts for 99.91% of
the variance. It is explained that the first component represented
99.91% of the information of the green tea samples and only the
first PC was used to setup the classification model.
Fig. 5 Accumulated Percent variance explained by components for
PCA classification model
Đại học Nguyễn Tất Thành
3.2.2 Selection of multivariate model
To highlight the good performance of the algorithm, two
supervised recognition algorithms, PCA-DA and PLS-DA
were performed with only first PC. Figure 6 represents the
recognition results obtained by the PCA-DA and PLS-DA
approaches in training and prediction sets. The prediction
set consists of six samples denoted by Thai Nguyen
samples (TN1, TN2), Lam Dong samples (LD1, LD2),
other province samples (CTK1, CTK2). PLS-DA typically
outperforms Soft Independent Modeling of Class Analogy
SIMCA in classification rates, provided that within-class
variability is low, as class-separation is maximized.
Compared with PCA-DA classification, the PLS-DA model
was better able to deal with imbalance training samples and
the prediction set. The ability to determine the origin of a
tea sample in the prediction set shows PLS-DA can
recognize tea’s origin of sample with 100% while PCA-DA
performed only 83.33%. Therefore, PLS-DA is the suitable
method to determine the origin of a tea sample.
Fig. 6 PCA-DA sample plot for classification of green tea
Fig. 7. PLS-DA sample plot for classification of green tea
Tạp chí Khoa học & Công nghệ Số 6
4 Conclusions
The reflectance IR nondestructive spectroscopy technique
coupled with the multivariate regression has a high potential
to quantitative analysis of three methylxanthines as well as
identify geographical origin of Vietnamese tea with the same
spectra profile. For the purpose of quantitative analysis, the
NIR spectral data are processed using a partial least squares
calibration designed with a series of tea samples in which
39
methylxanthine concentrations were determined by a HPLC
method. The statistical indicators for the prediction in
validation sets of samples were good. This study used PLSDA as a pattern recognition tool to develop an identification
model. The PLS-DA algorithm outperforms the PCA-DA
approaches in identifying the geographical origin of the tea
samples. Therefore, NIR spectra analysis coupled with the
multivariate regression can be used as an alternative
approach to traditional methods for tea quality evaluation.
References
1. Lin, J. K.; Lin, C. L.; Liang, Y. C.; Lin-Shiau, S. Y.; Juan, I. M. Survey of catechins, garlic acid, and methylxanthines in
green, oolong, pu-erh, and black teas. J. Agric. Food Chem, 1998, 46, 3635-3642.
2. Chen, Q.S., Z.M. Guo and J.W. Zhao. Identification of green tea’s (Camellia sinensis (L.)) quality level according to
measurement of main catechins and caffeine contents by HPLC and support vector classification pattern recognition. J.
Pharmaceut. Biomed., 2008, 48, 1321-1325
3. Yan, S.H. Evaluation of the composition and sensory properties of tea using near infrared spectroscopy and principal
component analysis. J. Near Infrared Spec, 2005, 6, 313-325
4. Horie, H.; Mukai, T.; Kohata, K. Simultaneous determination of qualitative important components in green tea infusions
using capillary electrophoresis. J. Chromatogr. A, 1997, 758, 332-335.
5. Arce, L.; Rı´os, A.; Valca´rcel, M. Determination of anticarcinogenic polyphenols present in green tea using capillary
electrophoresis coupled to a flow injection system. J. Chromatogr, 1998. A, 827, 113-120.
6. Wang, H.; Helliwell, K.; You, X. Isocratic elution system for the determination of catechins, caffeine and gallic acid in green
tea using HPLC. Food Chem, 2000, 68, 115-121.
7. Goto, T.; Yoshida, Y.; Kiso, M.; Nagashima, H. Simultaneous analysis of individual catechins and caffeine in green tea. J.
Chromatogr, 1996, A, 749, 295-299.
8. Kuhr, S.; Engelhardt, U. H. Determination of flavanols, theogallin, gallic acid and caffeine in tea using HPLC. Z.
Lebensm.Unters.-Forsch, 1991, 192, 526-529.
9. Bronner, W. E.; Beecher, G. R. Method for determining the content of catechins in tea infusions by high-performance liquid
chromatography. J. Chromatogr, 1998, A, 805, 137-142.
10. Shao, W.; Powell, C.; Clifford, M. N. The analysis by HPLC of green, black and pu’er teas produced in Yunnan. J. Sci.
Food Agric, 1995, 69, 535-540.
11. Quansheng Chen and Jiewen Zhao, Sumpun Chaitep, Zhiming Guo. Simultaneous analysis of main catechins in green tea
by Fourier transform near infrared reflectance (ET-NIR) spectroscopy. Journal of Food Chemistry, 2009, 113, 1272-1277.
12. Clímaco Álvarez, Elevina Pérez, Emile Cros, Mary Lares, Sophie Assemat, Renaud Boulanger and Fabrice Davrieux. The
use of near infrared spectroscopy to determine the fat, caffeine, theobromine and(−)-epicatechincontentsinunfermented and sun-dried
beans of Criollo cocoa. Journal of Near Infrared Spectroscopy, 2012, 20, 307-315.
13. Alessandro Bedini & Valentina Zanolli & Sandro Zanardi & Ugo Bersellini & Enrico Dalcanale & Michele Suman. Rapid
and Simultaneous Analysis of Xanthines and Polyphenols as Bitter Taste Markers in Bakery Products by FT-NIR
Spectroscopy. Food Analytical Methods, 2013, 6 (1), 17–27.
14. Paulo Henrique Gonçalves Dias Diniz & Adriano Araújo Gomes & Marcelo Fabián Pistonesi & Beatriz Susana Fernandez
Band & Mário César Ugulino de Araújo. Simultaneous Classification of Teas According to Their Varieties and Geographical
Origins by Using NIR Spectroscopy and SPA-LDA. Food Analytical Methods, 2014, 7, 1712–1718.
15. Xi Wang, Jianhua Huang, Wei Fana and Hongmei Lu. Identification of green tea varieties and fast quantification of total
polyphenols by near-infrared spectroscopy and ultraviolet-visible spectroscopy with chemometric algorithms. Anal. Methods,
2015, 201, pp 787-792.
16. D. Pavia. Introduction to spectroscopy : a guide for students of organic chemistry. Brooks Cole: South Melburne, 2001.
17. D. Ami, P. Mereghetti, S. M. Doglia. Multivariate Analysis for Fourier Transform Infrared Spectra of Complex Biological
Systems and Processes. Multivar. Anal. Manag. Eng. Sci, 2012, pp.189-220.
Đại học Nguyễn Tất Thành