Summary of material science doctoral thesis: Research on the ion exchange of manganese oxide based electrolyte in alkaline ion battery
Bạn đang xem bản rút gọn của tài liệu. Xem và tải ngay bản đầy đủ của tài liệu tại đây (1.09 MB, 27 trang )
MINISTRY OF EDUCATION
AND TRAINING
VIETNAM ACADEMY OF
SCIENCE & TECHNOLOGY
GRADUATE UNIVERSITY OF SCIENCE AND TECHNOLOGY
-------------------
TA ANH TAN
RESEARCH ON THE ION EXCHANGE OF MANGANESE
OXIDE BASED ELECTROLYTE IN ALKALINE ION
BATTERY
(SPECIALITY) MAJOR: ELECTRONIC MATERIALS
Code: 9440123
SUMMARY OF MATERIAL SCIENCE DOCTORAL THESIS
HANOI - 2018
1
The work was completed at:
Institute of Materials Science - Academy of Science and Technology
Science instructor:
1. Assoc. Prof. Pham Duy Long
2. Ph. D. Truong Thi Ngoc Lien
2
BEGINNING
Recently, energy security and sustainable developments are global
challenges that need to be addressed by all nations for their present and future
lives. Energy sources based on fossil fuels (oil, coal, gas, ...) and even nuclear
power are now at risk of exhaustion. Moreover, the use of fossil fuels also
emits CO2 that causes catastrophic climate change and environmental
pollution. The challenge now is to find, exploit and use clean, renewable and
energy sources, which is harmless to the environment to replace these
sources of energy. Among the clean energy sources having the capability of
renewable, wind energy, solar energy has been considered as an alternative
energy source with great potential. However, these kinds of energy have a
huge limitation: often discrete and depending on weather conditions. For
overcoming these disadvantages and using these energy sources effectively,
it is necessary to have the storage device to store these energies for use when
necessary.
In the field of research and manufacture of lithium-ion batteries, the three
most important basic materials are i /Group of layer-structure LiCoO2 (LCO)
material; ii/Group of spinel structure materials of LiMn2O4 (LMO); iii/Group
of olivine structural material of LiFePO4 (LFP). These are materials have
high-ability of exchanging and storing H+ and Li+ ions, and they are the basic
element for making positive poles in lithium-ion batteries (LIBs).
Over the last two decades, the spinel material of transition metal oxides,
particularly the LiMn2O4 compound, has received great attention in the field
of lithium-ion battery research (LIBs). With its popularity, non-toxic spinel
material LiMn2O4 has more advantages over LiCoO2 materials.
The main problem of LiMn2O4 is the quick reduction in capacity after the
first cycle at both room temperature and high temperature. Decreasing in
storage process or during charge cycle is not well-defined, several causes
could be suggested as structural rigidity; lattice distortion effect Jahn-Teller;
Mn dissolved in the electrolyte solution. To solve this problem, the research
focuses on partially replacing the metal ions such as Co, Ni, Al, Mg, Cr, Fe
3
for Mn to improve capacity as well as stability in the charge cycle. Among
the doped materials, LiNixMn2-xO4 shows the best stability in
discharging/charging process.
Another interesting issue attract attention recently is the replacement of
conductive material and the charge/discharge of Li+ with conductive
materials and the charge/discharge of Na+ in the compound with either MnO2
or V2O5 oxides, which could be used in the manufacture of sodium ion
batteries (NIBs: Natrium ion batteries), also known as sodium ion batteries.
This is a new research direction and the NIBs battery is a candidate for
replacing lithium-ion batteries in many areas, especially in the field of largescale energy storage. NIBs battery has many advantages, such as low cost,
due to the large capacity of sodium in the Earth's crust, easy to manufacture
and environmentally friendly.
In Vietnam, the study of lithium-ion battery materials and components
has also been studied in a number of institutes such as Institute of Materials
Science; Vietnamese Academy of Science and Technology; Hanoi
University of Science and Technology; Hanoi Pedagogical University 2;
University of Science, Vietnam National University Ho Chi Minh City.
These research are usually based on a number of specific subjects such as the
LiCoO2 positive; Solid Li2 / 3-xLa3xTiO3 solid electrode material. Studying
materials that can store and conduction has been carried out, achieved many
positive results on materials that can store and conduction such as conductive
ionic materials LiLaTiO3, LiMn2O4 and started investigating ion battery. On
that basis we perform:
"Research on the ion exchange of manganese oxide based electrolyte in
alkaline ion battery".
The purpose of the thesis:
Understanding and building manufacturing technology for positive
material, which has the ability to exchange and storage of Li+, Na+
on manganese oxide substrate.
Study the structure, morphology, ionic conductivity, ion exchange
and storage of materials depends on technological factors.
4
Investigating the variation of electrical and electrochemical
properties of material systems dependent on technological factors.
Therefore, determining the suitable technology for making
conductor material and charge/discharge Li+, Na+ ion with high
capacity, energy density, and structural stability.
Initial testing of ion-alkaline batteries, investigate the capability of
charging and discharging, capacity and charge cycle of the battery.
Research object of the thesis:
LiNixMn2-xO4 conductivity, charge/discharge Li+ ion spinel structure
material and conductive, charge/discharge Na+ ion on the basis of MnO2
material, V2O5 was selected as the object of study of the thesis.
The composition of the thesis:
Preamble
Chapter 1: Overview
Chapter 2: Fabrication of samples in experiment and materials research
methods
Chapter 3: Structural characteristics and morphological of positive
materials
Chapter 3: Electric and electrolytic properties of positive material systems
General conclusion
The results of the thesis:
The main results of the thesis have been published in 8 works, including
articles in journals and scientific reports at national and international
scientific conferences.
Chapter 1: OVERVIEW
1.1. Concepts and classification of battery
Battery (French: pile) is a component - an electrochemical cell, which
converts chemical energy into electrical energy. Since its inception in 1800
by Alessandro Volta, the battery has become a popular energy source for
many household items as well as for industrial applications.
5
According to the mechanism of operation, we can summarize the two
main types of batteries are chemical (electrochemical) and physical batteries.
The chemical batteries are further divided into primary and secondary
batteries. The alkaline battery is a rechargeable battery or secondary battery.
1.2. A brief history of battery development
In 1938, archaeologist Wilhelm Konig discovered a few clay pots that
looked strange when he was excavating in Khujut Rabu, a suburb of
Baghdad, Iraq today. Vessels of about 5 inches (12.7 cm) contain a coppercoated iron rod dating back to the 200 BC. Tests have shown that these vases
could previously have contained acidic compounds such as vinegar or wine.
Konig believes these vases could be ancient batteries.
In 1799 Italian physicist Alessandro Volta created the first battery by
stacking layers of zinc, cardboard or cloth that had saturated silver and silver.
Although not the first device that can generate electricity, it is the first to
produce long lasting and stable electricity.
The battery came in 1859, when French physicist Gaston Plante invented
the lead-acid battery. With the cathode being a lead metal, the anode is lead
dioxide and uses sulfuric acid as an electrolyte.
1.3. History of rechargeable lithium-ion batteries
In June 1991, Sony introduced lithium-ion batteries (LIBs) to the market,
and since then LIBs has dominated the small rechargeable battery market. In
2002, small-volume LIBs were produced in the world of 752 million units.
The market has an overall growth rate of about 15% per year. LIBs currently
have an energy reserve of between 200 ÷ 250 Wh/l and 100 ÷ 125 Wh/kg
and are proven to be extremely safe in bulk shipments, with very few safety
incidents.
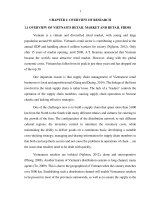
1.4. Composition, principle of operation of ion battery - Lithium.
Figure 1.4 illustrates the working principle and basic structure of the
Li-ion battery. The reversible reactions occurring in the electrodes are
described as equations (1.1) and (1.2).
The reaction occurs at the poles:LiCoO2 Li1-x CoO2 +xLi+ + xe(1.1)
+
The reaction occurs at the cathode:
xLi + xe + C6 Li
(1.2)
6
During
the
discharge process,
the lithium ions
move
to
the
positive electrode
through
the
conductor and fill
in the positive
electrode, which is
usually made from
Figure 1.4: Illustrates the working principle and basic
structure of the Li-ion battery.
+
Li
containing
LiCoO2, LiMn2O4, LiNiO2 or V2O5. At the same time, the electrons move in
the external circuit through the load resistor. The electromotive force is
determined by the difference in electrochemical potential between the
lithium in the cathode and the lithium in the polarity. When charged to the
battery, the positive potential on the positive electrode causes the lithium ion
to escape from the electrode. If the ion injection/exiting process is reversible,
lithium batteries have a high number of cycles.
1.5. Materials for Li-ion batteries.
The structure of the rechargeable Li-ion battery consists of three main
parts: positive electrode (cathode); negative electrode (anot); electrolyte
system.
Cathode material
With the advantages of cost, availability and good electrochemical properties,
carbon is the perfect cathode material for Li-ion batteries. In addition, some other
electrodes have been studied such as polar silicon, polar silicon, etc. However,
due to some limitations, they are rarely applied.
Electrolyte
It is easy to see that the electrolysis of the battery is highly dependent on
the electrolyte solution because it can support the highly active electrode.
Accordingly, the use of electrolyte solution must be based on the
7
interdependence between the activity of the material and the electrolyte
solution.
Anode materials
Most studies of
positive materials
for lithium ion
batteries focus on
three types of
materials. The first
is a group of
materials with a
structure of LiMO2 Figure 1.5 Crystalline structure of basic materials for Li-ion
batteries.
(M = Co, Mn, Ni)
with an anionic or nearly tightly packed anion structure in which the
alternating layers between the anion plates are occupied by a transition metal
Next the oxidation activity is reduced and then lithium inserted. The
remaining layers are mostly empty (Figure 1.5).
1.6. General
information
about
lead
material
and
ion
accumulation/discharge.
Only subunits are ionic or molecular guest
Indicates the empty position in the host structure.
Directional input / output of ion.
Figure 1.8: Illustrate the formation of host-guest compound.
Families of materials that are capable of exchanging and storing lithium
ions are usually oxide materials or compounds of these oxides with lithium.
A fundamental characteristic of this family of materials is that in their
8
structure there exist channels (in one dimension or in many dimensions) with
sufficiently large dimensions that allow small ions such as Li +; H+ easily
injected into or out of the crystal lattice. Then the penetration of small "guest"
particles (ions, molecules) into a solid "host" in which the network structure
exists vacant positions. It is possible to illustrate the formation of host-guest
compound by shape. 1.8.
1.7. Li + ion positive electrode
Spinel material LiMn2O4
LiMn2O4 is a spinel family
structure A[B2]O4, belonging
to the space group Fd-3m. The
oxygen anion occupies the 32e
position of the space group; the
cations Mn occupy the
octahedral position Oh (16d),
Figure 1.11: Fd3m field variable spinel
the positions Oh (16c) are
structure.
empty, and the tetrahedral sites
T (8a) are the occupying cations (Figure 1.11). Each tetrahedron 8a has the
same faces with 4 octahedral octagonal positions, thus forming the channel
for the diffusion of the cationic Li as follows:
8a 16c 8a 16c (hình 1.11b)
When Li+ ion accumulation/discharge occurs in λ - MnO2, electrons are
also input/output to ensure electrical neutralization.
The Li+ ion charge on λ - MnO2: Mn4+ + e Mn3+
(1.16)
+
3+
4+
The Li ion process escapes λ - MnO2: Mn - e Mn
(1.17)
Material LiNixMn2-xO4
The problem that hinders the practical application of spinel-Mn is the
cyclic capacity reduction in both spinel/lithium and spinel/carbon batteries,
especially at high temperatures. It has been found that replacing part of Mn
in LiMn2O4 with metal cations such as Li, Co, Ni, Al, Mg, Cr, Fe, ... can
improve the battery's endurance. Furthermore, replacing F and S in the
9
oxygen position is also an effective way to improve storage time and release
stability.
Among LiMn2O4's doped materials, the LiNixMn2-xO4 spinel is one of the
most potent polar materials for the development of high-energy lithium-ion
batteries. The high voltage of LiNixMn2-xO4 is due to the reversible oxidation
of Ni2+/Ni3+ and Ni3+/Ni4+ occurring respectively at 4.70 and 4.75 volts
during Li+ ion injections. The high operating voltage and theoretical capacity
of the LiNixMn2-xO4 (146.7 mAh/g) allows for the highest energy density of
commercially available materials such as LCO, LMO, LFP and NMC.
1.8. Na+ ion electrode material.
Currently, sodium ion battery (NIBs) are emerging as a candidate for
replacement of lithium ion batteries in many areas, especially in the field of
large-scale energy storage. NIBs have the advantage of being cheap because
of the high volume of sodium in the earth's crust (2.6% of the crust), simple
manufacturing methods and environmental friendliness.
1.9. Na+ ion electrode material on MnO2 substrate.
Many positive materials for NIBs have been published as NaMO2 (M =
transition metal), tunneling material Na0,44MnO2, NaMnO4 material, etc. In
objects The nanoparticles Na0,44MnO2 are very interesting materials.
1.10. Na+ ion electrode material on V2O5.
Vanadium pentoxide (V2O5) has been reported as an attractive material
for LIBs because of its theoretical capacity (around 400 mAh/g), not air
sensitive, and low cost materials. Previous studies have described the
electrical performance of V2O5 as the positive material for LIBs. Recently,
V2O5 material has also been reported as a potential positive material for
NIBs.
Chapter MANUFACTURING OF METHODS AND
METHODS OF RESEARCHING OF LONG-TERM MATERIALS
2.1. Modeling methods
There are many different methods of making materials. Within the
framework of this thesis, we selected solid phase reaction method, sol-gel
method for making LiNixMn2-xO4 material and hydrothermal method for
10
making Na0.44MnO2 material. These are simple technological methods,
highly economical and can be produced in large quantities, so we chose to
make LiNixMn2-xO4 and Na0,44MnO2 materials.
2.2. Experimental production of positive materials
Experimental production of materials LiNixMn2-xO4
Material samples of LiNixMn2-xO4 made with sol-gel and solid phase
reaction are denoted in table 2.1 and 2.2.
Table 2.1: Table of LiNixMn2-xO4 doped Ni with concentration x = 0; 0,05; 0.1 and 0.2 are
synthesized by sol-gel at 300 ° C; 500 ° C; 700 ° C and 800 ° C.
Temperature (C)
Sample symbol
LiNixMn2-xO4
x=0
300
G0-300
x=0
500
G0-500
x=0
700
G0-700
x=0
800
G0-800
x = 0,05
300
G1-300
x = 0,05
500
G1-500
x = 0,05
700
G1-700
x = 0,05
800
G1-800
x = 0,1
300
G2-300
x = 0,1
500
G2-500
x = 0,1
700
G2-700
x = 0,1
800
G2-800
x = 0,2
300
G3-300
x = 0,2
500
G3-500
x = 0,2
700
G3-700
x = 0,2
800
G3-800
Table 2.2: Table of LiNixMn2-xO4 doped Ni with concentration x = 0; 0,05; 0.1 and 0.2 are
synthesized by solid phase reaction at 800 ° C; 850 ° C and 900 ° C.
LiNixMn2-xO4
Temperature (C)
Sample symbol
x=0
800
S0-800
x=0
850
S0-850
x=0
900
S0-900
x = 0,05
800
S1-800
x = 0,05
850
S1-850
x = 0,05
900
S1-900
x = 0,1
800
S2-800
x = 0,1
850
S2-850
x = 0,1
900
S2-900
x = 0,2
800
S3-800
x = 0,2
850
S3-850
x = 0,2
900
S3-900
11
Experimental production of Na0.44MnO2 material by hydrothermal
method
Table 2.3: Summary table of NaxMnO2 material by hydrothermal method at 185 °C, 1900
°C, 195 °C, 200 °C and 205 °C.
Temperature
185 C 190 C 195 C 200 C 205 C
Sample symbol
T185
T190
T195
T200
T205
2.3. Experiment on making thin films of positive materials
Materials LiNixMn2-xO4 (Na0,44MnO2; V2O5) was mixed with carbon
black (super P and KS4) and polyvinylidenefluoride (PVDF) in N-methylpyrolidone (NMP) in a 70:20:10 mass ratio. Crushed marbles to form a
muddy solution. This solution is coated on a thin aluminum foil with a
thickness of 15 μm and then dried at 100 ° C by vacuum furnace for 12 hours
to obtain a polar leaf.
STRUCTURAL CHARACTERISTICS AND
EFFICIENCY OF MATURATED MATERIALS MANUFACTURED
3.1. Structural and morphological characteristics of LiNixMn2-xO4
material.
Morphological characteristics of the LiNixMn2-xO4 material system.
The morphology of the LiNixMn2-xO4 material synthesized by both solidphase and sol-gel methods showed that the laws of variation had distinct
similarities and differences.
a) Similar
By increasing the incubation temperature during synthesis, the crystalline
grain sizes for both non-Ni and Ni substitution materials increased.
According to the increase in the ratio of Ni atoms to Mn, the particle size
decreases slightly, while the grain change varies from round to sharp.
b) difference:
A distinct morphological difference of the LiNixMn2-xO4 composite by the
two methods is:
+ The size of synthetic particles by solid phase method is much larger
than the size of synthetic granules by sol-gel.
12
+ The change in grain size from round to sharp is also significantly
different. Solid-phase materials, when increasing the substitution rate of Ni,
produce significantly more granular particles than sol-gel particles.
The structure of the material LiNixMn2-xO4
Figure 3.14: XRD schema of LiNixMn2-xO4 with Ni substitution rate (x = 0 and 0.05) by
solid phase method at 800 ° C, 850 ° C and 900 ° C.
Figure 3.15: XRD diagram of LiNixMn2-xO4 material with Ni x = 0.1 (a) and x = 0.2 (b)
synthesized by solid phase modification at 800 ° C, 850 ° C and
Figure 3.16: XRD diagram of LiNixMn2-xO4 material with Ni substitution x = 0 (a) and
0.05 (b) synthesized by sol-gel method at 300 ° C; 500 ° C; 700 ° C and 800 ° C.
13
Figure
3.17:
XRD
diagram of LiNixMn2-xO4 material with Ni substitution x = 0.1 (a) and 0.2 (b)
synthesized by sol-gel method at 300 ° C; 500 ° C; 700 ° C and 800 ° C.
The X-ray diffraction patterns (Fig.
3.14 ÷ 3.17) of samples S0, S1, S2 and
S3 were synthesized by solid phase
reaction at 800 ° C, 850 ° C and 900 °
C, G1, G2 and G3 synthesized by solgel method at 300 ° C, 500 ° C, 700 ° C
and 800 ° C completely give us
diffraction peaks in accordance with a
single standard tag, JPCDS No. 35-072 Figure 3.19: Raman scattering
patterns G0-700 (a) and G2-700 (b)
of the cubic-spinel structure of space
Fd-3m. Combined with the Raman scattering spectra shown in Fig. 3.19, it
was found that LiNixMn2-xO4 material was synthesized by doping Ni with a
rate of x = 0 ÷ 0.2 by both sol-gel and solid-phase methods. has successfully
replaced the positions of Mn.
Effect of tempering temperature on the structure of the LiNi xMn2-xO4
material system.
3.1.3.1. Effect of incubation temperature on the network constants of LiNi xMn2xO4 material.
Figure 3.20, the constant-change of LiNixMn2-xO4 material produced.
Symbols S0; S1; S2 and S3 correspond to samples with Ni substitution rates
(x = 0, 0.05, 0.1 and 0.2) synthesized at different temperatures. Same as
samples G0; G1; G2 and G3 are made by sol-gel method. The graph shows
that the network constant of the material system increases slightly as the
14
tempering
temperature
increases in both
methods
of
manufacture. For
the
solid-phase
method, the net
increase was 0.007 Figure 3.20: Graph of the dependence of crystalline lattice
Å
when
the
constants of solid and liquid phase (a) and sol-gel (b)
materials on tempering temperature.
tempering
temperature increased from 800 ° C to 900 ° C, and for the average sol-gel
method the net increase was 0.015 Å as the tempering temperature
increased from 300
° C to 800 ° C. The
increase
in
crystalline lattice
constant for the
LiNixMn2-xO4
material system can
.
be explained by the Figure 3.21: The dependence of crystalline lattice constants of
solid and liquid phase (a) and sol-gel (b) materials on the
migration
from
replacement ratio of Ni
Mn4+ to Mn3+ (LS
or HS) and the migration from Mn3+ (LS) to Mn3+ (HS) when the tempering
temperature increases.
3.1.3.2. Effect of substitution rate Ni on lattice constant of LiNixMn2-xO4 material.
Figure 3.21 shows that the crystalline lattice constants of the fabrication
material are reduced as the Ni phase ratio increases. For the solid-phase
method, the network constant decreases to 0.022 Å when the replacement
rate of Ni increases from x = 0 to 0.2, and for the average sol-gel method the
network constant decreases to 0.023 Å When the replacement rate of Ni
increases from x = 0 ÷ 0.2. LiNixMn2-xO4 has a more stable crystalline
15
structure order and Ni doped material promises better electrochemical
properties than non-doped materials.
3.2. Structural and morphological characteristics of NaxMnO2 material.
Influence of temperature during hydrothermal to the structure and
morphology of NaxMnO2 material.
3.2.1.1. Influence of temperature during hydrothermal to morphology of
NaxMnO2 material.
As the temperature increases, the samples change from granular to
nanowire. At 205 ° C the material obtained is completely nanosized in the
form of approximately ~ 30 ÷ 50 nm and long from several hundred nm to
tens of μm.
3.2.1.2. Effect of temperature during hydrothermal to the structure of NaxMnO2
material.
.
.
Figure 3.29: XRD scheme of Na0.44MnO2
hydrothermal at 185 ° C for 96 hours.
Figure 3.33: XRD scheme of Na0.44MnO2
hydrothermal at 205 ° C for 96 hours.
Figures 3.29 and 3.33 are the X-ray diffraction patterns of the samples
T185 and T205. The observation in Figure 3.29 shows that even at 185 ° C
hydrothermal temperature, diffraction peaks of the Na0.44MnO2 phase exist
along with the diffraction peaks of the Mn3O4 precursor material. The content
of Na0.44MnO2 and Mn3O4 were respectively 34.4% and 65.6%. As the
temperature rises, the Na0.44MnO2 content in the material is also increased.
At an incubation temperature of 205 ° C, the XRD spectrum of the sample
obtained showed no presence of the manganese oxide material (Figure 3.33).
16
Instead, a rich Na-phase was obtained with the formula Na0.7MnO2.05. This
phase appearance may be due to excess Na diffusion into the Na0,44 MnO2
network.
Figures 3.34, 3.35 and 3.36, hydrothermal materials at 205 ° C for 72 h;
48 h and 96 h then heat up. The absence of both the precursor phase and the
product phase clearly indicates that the hydrothermal process has occurred
in several steps before the final product is Na0,44MnO2.
Figure 3.34: Nuclear model
XRD NaxMnO2 hydrothermal
at 205 ° C for 72 hours.
Figure 3.35: Nuclear model
XRD NaxMnO2 hydrothermal
at 205 ° C for 48 hours.
Figure 3.36: Nuclear XRD
pattern
of
NaxMnO2
hydrothermal at 205 ° C for
96 hours and incubation of
600 ° C for 6 hours.
3.3. Structural and morphological characteristics of V2O5 powder
material.
V2O5 powder (99.7%, Alfa
Aesar) was used with the X-ray
diffraction pattern in Fig. 3.42d. The
diffraction peaks indicate that it
belongs to the JPCDS card number
41-1426 with the orthogonal crystal
structure of the Pmmn space group.
X-ray diffraction showed that V2O5
powder was single phase. The
lattice parameters of V2O5 are
3.39 (d): V2O5 X-ray diffraction
calculated by the Unitcell software Figure
pattern.
based on the diffraction peaks
17
marked by Miller indices in Figure 3.42d. The volume of the elemental cells
and the network constants a, b, and c of V2O5 are respectively 179.3315 (Å)
3; 11.5121 Å; 3.5644 Å and 4.3704 Å.
Chapter 4: ELECTRIC AND ELECTRICITY
MATERIALS OF MANUFACTURED ORGANIC MATERIALS
4.1. The ionic conductivity of the positive material system
In Figure 4.4, the typical Nyquist
graph in the planar plane represents
the virtual part Z dependence on the
real part Z of the synthetic material
LiNixMn2-xO4 at 700 ° C, measured
at room temperature. The total
spectrum is only two semicircles. A
semicircle in the high frequency
region from 1 MHz to a few tens Hz,
they are attributed to the lithium ion Figure 4.4: Nyquist graph of LiNixMn2xO4 with Ni (x = 0; 0.1 and 0.2)
conductance in the particle and a
synthesized by Sol-gel at 700 ° C (a)
semicircle in the low frequency
and the intercept of a semicircle on the
Nyquist graph (b).
region is attributed to the ionic
conductivity at the grain boundary. The total resistance (Rb + Rgb) and the
block resistance (Rb) of the samples are thus obtained correspondingly from
the right and left stop points of the semicircle to the actual axis.
Li+ ionic conductivity of the material LiNixMn2-xO4
4.1.1.1. Effect of Ni replacement ratio and tempering temperature on ion
conductivity of the composite material by sol-gel.
Figure 4.11 shows that the lithium ion conductance of the sol-gel
synthesized LiNixMn2-xO4 material depends on the nickel replacement ratio
as well as the composite temperature. LiNixMn2-xO4 substitute Ni x = 0.1
yields the best lithium ion conductivity improvement: G2-700 is annealed at
700 °C with the largest total conductivity σtp = 19,773 × 10-5 S.cm-1 while
18
sample G0-500 (unmixed and tempered at 500 °C) had the smallest total
conductance σtp = 0.111 × 10⁻⁵ S.cm-1.
Similarly,
Figure 4.12 of the
LiNixMn2-xO4
material
is
synthesized
by
solid
phase
reaction.
The Figure 4.11: The influence of Ni phase to Ion conductivity of
LiNixMn2-xO4 composite by sol-gel method (G300, G500,
conductance of the
G700, and G800 are symbols of the samples with
incubation at the same temperature. 300 ° C, 500 ° C, 700
particle increases
° C and 800 ° C).
with
increasing
nickel replacement,
the
marginal
conductance
increases
with
increasing nickel
replacement
but Figure 4.12: Influence graph of Ni phase to Ion conductivity of
LiNixMn2-xO4 composite by solid phase method (S800; S850
reaches the extreme
and S900 are samples of incubated samples at 800 ° C
at x = 0.1 and then
850 °C and 900 °C.
decreases.
The
influence of the ionic conductivity of the material on the incubation
temperature is not clear. The maximum conductance value for the S3-850
sample is σtp = 2,237 × 10-5 S.cm-1 and the smallest value belongs to the
sample S2-800 with the magnitude σtp = 0.753 × 10⁻⁵ S. cm-1.
4.1.1.2. Na + ion conductivity of the positive material NaxMnO2.
Figure 4.15 shows that the grain conductance and grain conductance are
dependent on the temperature of the hydrothermal process (Table 4.3). The
results show that the grain conductance of the material is not significantly
different according to the temperature of the hydrothermal process (from
0.319.10-3 S.cm-1 to 0.703.10-3 S.cm-1). changed quite a bit (from 6,757.105 S.cm-1 to 31,068.10-5 S.cm-1). Total conductivity reached maximum value
19
at σtp = 19,707.10-5 S.cm-1 belongs
to form T205. This sample of T205
after re-crystallization at 600 ° C for
6 hours gave rise to ion conductivity
σtp = 31,661.10-5 S.cm-1.
4.2. Electrochemical Properties of
Positive Materials.
The
electrochemical
characterization of the conduction
Figure 4.1: Nyquist plot of the NaxMnO2
system and Li+ ion charge/discharge
composite system by hydrothermal
method at 185 ° C; 190 ° C; 195 ° C;
using LiNixMn2-xO4 is positive.
200 ° C and 205 ° C.
4.2.1.1. The electrochemical nature of
lithium ion batteries using LiNixMn2-xO4 is positive
Load measurements of LiNixMn2-xO4 electrode materials were carried out
with a cathode-component configuration of the SnO2 tin oxide electrode, an
electrolyte solution used as 1 M NaClO4 in a PC (propylene carbonate ).
Measurement of the load is measured by the Autolab PSGTAT30
electrochemical system with a voltage in the range of 2 V ÷ 4 V with the
discharge current at 0.5 C. The charge/discharge curves of the samples are
shown in the capacitive representation. The maximum discharge was 79.7
mAh/g for G2-700 (LiNixMn2-xO4
doped Ni with x = 0.1 synthesized by
sol-gel at 700 ° C) at most 44.9 mAh/g
for the S0-900 (LiNixMn2-xO4 doped Ni
with x = 0 synthesized by solid phase at
900 ° C). The electrochemicality of the
lead system and the Na+ ion
charge/discharge using Na0.44MnO2 are
Figure 4.17: Load line of solidified
positive.
LiNixMn2-xO4 material at 900 ° C.
20
Injection/discharge of Na+ ion of Na0,44MnO2 material.
Figure 4.20. The
C-V spectra of the
electrode exhibit a
distinct reduction in
the oxidation peak
corresponding to
the
Na+
ion
Figure 4.20: C-V spectra of untreated T205 (a) and T205U600
injection
and
with 600 ° C incubation for 6 hours (b)
discharge from the
electrolyte solution into and out of the electrode material. Figure 4.20b is the
C-V characteristic spectrum of the electrodes from the T205 after recrystallization, suggesting better ion exhalation.
4.2.2.1. Injection/discharge of Li+ ion of Na0,44MnO2 material
Figure 4.22 shows the C-V
spectrum of the T205U600 using an
electrolyte solution of 1M lithium salts,
dissolved in deionized water (Li + ion
electrolyte). Thus we can conclude that
the Na0.44MnO2 material synthesized by
hydrothermal method at 205 ° C not
only has good Na + ion repellency, but
Figure 4.22: C-V spectra of T205U600
also Li+ ion exiting ability.
with LiNO3 Li-ion electrolyte
4.2.2.2. The electrochemical nature of
solution.
lithium ion batteries using Na0,44MnO2 is
positive.
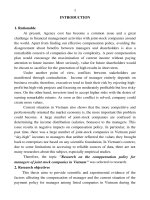
Figure 4.23, illustrates the charge/discharge curves in cycles 1, 10, and
the 20 th cycle with a speed of 0.1 C; Voltage 2.0 ÷ 4.0 V. The discharge
capacity of cycle 1; 10 and cycle 20 are 62.7 mAh/g, 64.0 mAh/g and 65.8
mAh/g respectively. It can be seen that both charge and discharge curves
exhibit voltage stabilization demonstrations that the Na0.4MnO2 material has
been phase-shifted during the sodium ion injection into the material
21
structure. A careful observation of the
discharge curves reveals five voltage
stabilization positions at 3.4; 3,2; 2.9;
2.6 and 2.4 V, which corresponds to the
phase change during the sodium ion
penetration of the Na0,44MnO2 material.
The charge curve (load) displays 5
constant voltage values at 3.5; 3,25;
3.0; 2.7 and 2.5 V, corresponding to the Figure 4.23: First, 10th, and 20rd
load/discharge curves of positive
process of sodium ions break off the
material Na0.44MnO2 at 0.1C;
Voltage 2.0 ÷ 4.0 V.
structure of Na0.44MnO2. In addition,
the charge and discharge curves are similar in shape and superimposed on
each other. From this result it can be predicted that material Na0,44MnO2 has
a large charge/discharge cycle.
Figure 4.24 describes the change in
battery
capacity
by
the
charge/discharge cycles and the
coulombic efficiency of the positive
material Na0.44MnO2 at line 0.1C;
Voltage in the range of 2.0 ÷ 4.0 V.
Charge/discharge capacity increased
from 66.2/62.7 mAh/g to 68.4/64.0 Fig. 4.24: Charge/discharge cycles and
coulombic performance of positive
mAh/g in the first 10 cycles. Capacity
material Na0.44MnO2 at 0.1 C;
voltages 2.0-4.0 V.
was maintained steady for the next 30
cycles and then slowly decreased to 46.9/41.1 mAh/g after 70 cycles. The
coulombic performance of the material reached 90% and this value was
stable throughout 70 cycles.
The electrochemical characterization of the lead material and the
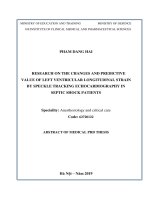
sodium ion accumulation/discharge using V2O5 is positive.
In this study, the first commercial V2O5 crystals were used together with
carbon black (super P and KS4) as conductors to make positive pole for NIBs
batteries. Figure 4.26a shows that the first discharge curves of the V2O5 cell
22
were obtained at 0.1
C between 1.0 V
and 3.5 V. During
the first Na + ion
intercalation, the
discharge capacity
was approximately
208 mAh/g. In the
first stage, the two
voltage positions
observed at the
discharge
curve
indicate
the
formation
of
NaxV2O5 by the Na Figure 4.26: First cycle discharge/discharge curve of V2O5
battery with current 0.1 C (a); Charge/discharge curves
ions intermingled
from second to fourth cycles of V2O5 with 0.1 C (b); The
with the V2O5
capacity of the V2O5 battery (c) and the cyclical efficiency
of the V2O5 battery at the 0.1 C (d) charge/discharge line.
structure.
The
electrochemical profiles of the second to fourth cycles of the V 2O5 cell are
shown in Figure 4.26b. Figure 4.26c illustrates the electrochemical
configuration of a V2O5 cell at different discharge rates. The second cell
cycle cell mass at 0.1 C is 85.9 mAh/g and the discharge capacity at the initial
cell cycle at 0.2C; 0.5 C and 1.0 C respectively 66.2 mAh/g; 55.1 mAh/g and
42.2 mAh/g. Operating cell showed that when the discharge current rate from
1.0 C back to 0.1 C, the discharge capacity returned to the initial value, which
shows that the NaxV2O5 structure is very stable for good Rapid application
of Na + ion. The efficiency of the loading/unloading process starts from the
second to the 40th cycle of the V2O5 cell at 0.1 C at a voltage range of 1.0 V
to 3.5 V as shown in Figure 4.26d. . Secondary discharge capacity is 97.2
mAh/g and decreases to 59.5 mAh/g after 40 cycles. Electrochemical
efficiency retained after 40 cycles was 61.2%.
Figure 4.28 is the X-ray diffraction pattern of the original positive and
positive polarizer emitted up to 1.0 V compared to the X-ray plot of the V2O5
23
powder. The diffraction peaks are
marked (•) corresponding to the
aluminum phase of the positive pole.
On the X-ray diffraction pattern of the
positive poles when discharged to 1.0 V
(Figure 4.28c), all vertices of the V2O5
phase disappeared, X-ray diffraction
pattern indicating peak vertices of
NaxV2O5 phase and substrate This
shows that the V2O5 phase completely
changes into phase NaxV2O5 (JCPDS
No. 24-1157).
4.3. Tested for Lithium ion battery
Figure 4.28: Diffraction diagram of
powder
V2O5
(a);
positive
preparation (b); positive pole after
discharge to 1.0 V (c).
Figure 4.29: LiMn2O4 electrodes (a), Li-ion battery configuration (b)
From the LiNixMn2-xO4 material, we
have conducted experiments on making
lithium ion batteries. The poles and
poles are selected as follows:
+ cathode is made of SnO2 material.
+ Electrolyte is a solution of 1M
LiClO4+PC
impregnated
with
absorbent paper. The diagram is shown
in Figure 4.29b. The electrode has an
Figure 4.3: Use the battery to light up
area of 2 cm × 1.5 cm.
the LED bulb.
To test the performance of the
battery, we used a battery to power a 3V LED bulb. As a result, the bulb is
bright and maintained for quite a long time (Figure 4.30).
24
CONCLUSION
1. Successfully fabricated the positive electrode system for LiNixMn2-xO4
lithium ion battery (with x = 0, 0.05, 0.1 and 0.2) in the form of nanoparticles
in both directions. The method is a solid phase reaction of the MnO2, NiO
and Li2CO3 salts and the sol-gel method from the corresponding acetate salts.
The results show that the LiNixMn2-xO4 system is single phase and the
structural and morphological characteristics of the material are strongly
dependent on the technological conditions such as reaction temperature,
tempering temperature and both the component of Ni replaced (x from 0 ÷
0.2). By increasing the Ni content of LiNixMn2-xO4 crystalline nanoparticles
for sharper edges or higher structural stability. For sol-gel the size of the
nanoparticles varied from about 30 ÷ 60 nm when the incubation temperature
was below 700 ° C and increased markedly when the heat was increased and
reached a value of 500 nm at 800 °. C. Whereas in the case of manufacture
by solid phase reaction the particle size is much larger from 2 μm to 5 μm.
The solgel method is superior due to the ease of fabrication and adjustment
of fabrication conditions to obtain single-phase LiNixMn2-xO4 materials. The
control of Ni content replaced the Mn in the range of x = 0.05 ÷ 0.2 and the
tempering temperature was above 700 C for higher structural stability.
The results of electrochemical characterization and discharge capacity of
the LiNixMn2-xO4 electrode material system showed that the material was
shown to be well reversed during lithium ion exiting. Tolerance of lithium
ion of sample G2-700 (corresponding to x = 0.1 and tempering temperature
T = 700 ° C) synthesized by sol-gel method for highest ion conductivity σtp
= 19,773.10-5 S.cm-1 also gives the highest discharge capacities of 85.5
mAh/g and 79.7 mAh/g, respectively. This value is about 70% of the
theoretical capacity, suggesting that the fabrication material could be used as
a positive electrode in lithium ion batteries later.
2. The conductivity of the material system and NaxMnO2 increases as the
temperature of the hydrothermal process increases and depends on the
incubation process. The ionic conductivity value of the hydrothermal sample
is 205 °C and then incubated at 600 °C in 6 hours for the highest ionic
conductivity is σtp = 31,661.10-5 S.cm-1. Results of the discharge test of the
25