Summary of science materials doctoral thesis: Abrication and investigation of characteristics of photonic microcavity 1D for optical sensors
Bạn đang xem bản rút gọn của tài liệu. Xem và tải ngay bản đầy đủ của tài liệu tại đây (1.53 MB, 28 trang )
MINISTRY OF EDUCATION
VIETNAM ACADEMY
AND TRAINING
OF SCIENCE AND TECHNOLOGY
GRADUATE UNIVERSITY SCIENCE AND TECHNOLOGY
NGUYEN THUY VAN
FABRICATION AND INVESTIGATION OF
CHARACTERISTICS OF PHOTONIC MICROCAVITY 1D
FOR OPTICAL SENSORS
Chuyên ngành: Materials for Optics Optoelectronics and Photonics
Code: 62.44.01.27
SUMMARY OF SCIENCE MATERIALS DOCTORAL THESIS
Hanoi - 2018
The thesis was completed at Key Laboratory for Electronic
Materials and Devices, Institute of Materials Science, Vietnam
Academy of Science and Technology.
Supervisors:
1. Assocc. Prof. Dr. Pham Van Hoi
2. Assocc. Prof. Dr. Bui Huy
Reviewer 1:
Reviewer 2:
Reviewer 3:
The dissertation will be defended at Graduate University of
Science and Technology, 18 Hoang Quoc Viet street, Hanoi.
Time:...........,............., 2018
The thesis could be found at:
- National Library of Vietnam
- Library of Graduate University of Science and Technology
- Library of Institute of Science Materials
9.
LIST OF PUBLICATIONS
LIST OF PUBLICATIONS USED FOR THE THESIS
1. Huy Bui, Van Hoi Pham, Van Dai Pham, Thanh Binh Pham, Thi
Hong Cam Hoang, Thuy Chi Do and Thuy Van Nguyen,
Development of nano-porous silicon photonic sensors for
pesticide monitoring, Digest Journal of Nanomaterials and
Biostructures, volume 13, No.1, January – March 2018.
2. H. Bui, V. H. Pham, V. D. Pham, T. H. C. Hoang, T. B. Pham, T.
C. Do, Q. M. Ngo, and T. Van Nguyen, “Determination of low
solvent concentration by nano-porous silicon photonic sensors
using volatile organic compound method,” Environ. Technol., pp.
1–9, May 2018.
3. Van Hoi Pham, Huy Bui, Thuy Van Nguyen, The Anh Nguyen,
Thanh Son Pham, Van Dai Pham, Thi Cham Tran, Thu Trang
Hoang and Quang Minh Ngo, “Progress in the research and
development of photonic structure devices”, Adv. Nat. Sci.:
Nanosci. Nanotechnol. 7, 015003, 17pp, 2016.
4. Van Hoi Pham, Thuy Van Nguyen, The Anh Nguyen, Van Dai
Pham and Bui Huy, “Nano porous silicon microcavity sensor for
determination organic solvents and pesticide in water”, Adv. Nat.
Sci.: Nanosci. Nanotechnol. 5, 045003, 9pp, 2014.
5. Bui Huy, Thuy Van Nguyen, The Anh Nguyen, Thanh Binh
Pham, Quoc Trung Dang, Thuy Chi Do, Quang Minh Ngo,
Roberto Coisson, and Pham Van Hoi, “A Vapor Sensor Based on
a Porous Silicon Microcavity for the Determination of Solvent
Solution”, Jounal of the Optical Society of Korea, Vol. 18, No. 4,
pp. 301-306, 2014.
6. Van Hoi Pham, Huy Bui, Le Ha Hoang, Thuy Van Nguyen, The
Anh Nguyen, Thanh Son Pham, and Quang Minh Ngo, “Nanoporous Silicon Microcavity Sensors for Determination of Organic
Fuel Mixtures”, Jounal of the Optical Society of Korea, Vol. 17,
No. 5, pp. 423-427, 2013.
7. Nguyen Thuy Van, Pham Van Dai, Pham Thanh Binh, Tran Thi
Cham, Do Thuy Chi, Pham Van Hoi and Bui Huy, “A microphotonic sensor based on resonant porous silicon structures for
liquid enviroment monitoring”, Proc. of Advances in optics
Photonics Spectroscopy & application, Ninh Binh city, Vietnam.
November 6 - 10, 2016, ISBN 978-604-913-578-1, pp. 471-475,
2017.
8. Phạm Văn Hội, Bùi Huy, Nguyễn Thúy Vân, Nguyễn Thế Anh,
“Thiết bị cảm biến quang tử và phương pháp để đo nồng độ dung
môi hữu cơ và chất bảo vệ thực vật trong môi trường nước” sáng
chế số: 16527, cấp theo quyết định số: 5424/QĐ-SHTT, ngày
24.01.2017.
LIST OF PUBLICATIONS RELATED TO THE THESIS
1. Pham Van Dai, Nguyen Thuy Van, Pham Thanh Binh, Bui Ngoc
Lien, Phung Thi Ha, Do Thuy Chi, Pham Van Hoi and Bui Huy,
“Vapor sensor based on porous silicon microcavity for
determination of methanol content in alcohol”, Proc. of Advances
in optics Photonics Spectroscopy & application, Ninh Binh city,
Vietnam. November 6 - 10, 2016, ISBN 978-604-913-578-1, pp.
404-408, 2017.
2. Nguyen Thuy Van, Nguyen The Anh, Pham Van Hai, Nguyen
Hai Binh, Tran Dai Lam, Bui Huy and Pham Van Hoi, “Optical
sensors for pesticides determaination in water using nano scale
porous silicon microcavity ”, Proc. of Advances in Optics,
Photonics, Spectrscopy & Applications VIII, ISSN 1859-4271,
pp.603-608,2015.
3. Thuy Van Nguyen, Huy Bui, The Anh Nguyen, Hai Binh
Nguyen, Dai Lam Tran, Roberto Coisson and Van Hoi Pham,
“An improved nano porous silicon microcavity sensor for
monitoring atrazine in water”, Proc. of The 7th International
Workshop on Advanced Materials Science and Nanotechnology
(IWAMSN2014)- November 02-06, 2014- Ha Long City,
Vietnam, ISBN: 978-604-913-301-5, pp.173-179, 2015.
1
INTRODUCTION
1. The urgency of the thesis
In recent years, photonic sensors have generated an increasing
interest because of their already well-known advantages, as immunity
to electromagnetic interferences, high sensitivity, no impact noise
and working in harsh environment. Photonic sensors are generally
classified according to the physical principle including endogenous
sensors and exogenous sensors. Exogenous sensors often use the
physical principle that light is altered in intensity of spread; reflex;
scattering; refraction; or wavelength conversion due to interaction
with the external environment. These sensors are relative easiness of
fabrication, but the processing of light signals varies due to the
complexity of the external environment requiring high sensitivity.
The endogenous photonic sensor uses the physical principle that the
optical properties of sensor structure is changed when interacting
with the environment. Therefore, they have very high sensitivity,
easiness of signal processing and compact device size. However, the
disadvantage of endogenous photonic sensor is the ability to reuses
and selectivity. Endogenous photonic sensors are being promoted in
research because of their extremely high sensitivity which can be
combined with many specializations in chemistry and biology. At
present, the sensitivity and selectivity of endogenous photonic
sensors can be enhanced and have had some very good results.
In general, scientists and technologists have proposed the standard
approach of quantitative analysis of components with extremely
small concentrations by using gas chromatography or liquid
chromatography (GC / MS, LC / MS or HPLC / MS-MS) [1]-[4],
2
liquid chromatography combined with UV-Vis [5]. These methods
have played a key role in the analysis of residues of low organic
dissolved organic substances in the process of controlling or
controlling the environment. However, these methods suffer some
drawbacks since thay require professional laboratories with
specialized personel and expensive equipment.
In the field of electrochemical sensors [6-7], the enzyme-linked
immunosorbent assay (ELISA) has been developed for determination
of residues of organic matter based on the principle of antigen antibody. The ELISA technique has high sensitivity, easiness of
manipulation and rapid analysis time, so there are many models of
sensor devices using the ELISA principle. The disadvantage of the
ELISA approach is the low accuracy in harsh environment, inflexible
due to the dependence on the chemicals of the manufacturer. Thus,
finding new analytical methods is more convenient than the goal of
many sensing laboratories in the world.
Endothelial photonic sensors based on the principle of changing the
refractive index of the sensor environment due to the interaction with
environment are being extensively studied for the development of
sensors in the world. Principles of transmission, interference,
scattering and refraction of light is studied and applied radically in
the photonic sensor based on changing the refractive index of the
environment. The most recent publish reported that the optical fiber
Bragg grating is capable of detecting the refractive index change to as
low as 7.2x10⁻⁶ in liquid environment [8]. which allows the
determination of solution at low concentration. Endothelial photonic
sensors based on the 1D – nanoporous silicon microcavity (1DNPSMC) have high sensitivity, low cost and ability to analyse
3
substances quickly and easily [9]. In recent years, scientists have
promoted research on endogenous photonic sensors for determining
concentrations of solvents, biological antibodies [10], cadavers
petroleum contamination norms and petroleum products [11],
determination of pesticide residues in water and sludge (recorded
pesticide
concentration
at
1
ppm)
[12],
determination
of
concentration DNA level (0.1 mol / mm2 DNA concentration) [13],
chemical sensor [14]. Current trends in the development of
endogenous photonic sensors in the world are enhancing the
sensitivity of the sensor (down to ppm), the selectivity of closeoptical properties and portable sensor devices.
In addition, the nano porous silicon with different porosity have
different refractive indexes, so that the multilayer porous silicon can
easily form an optical resonance cavity with cost low, durable in the
environment for application in photonic sensor technology. The
research results show that photonic sensors based on resonant cavity
have the ability to measure the concentration of solvents and
pesticides in the aqueous medium at extremely low concentrations.
So that PSMC devices show promise for a simple and portable
instruments for measuring the level of water pollution caused by
organic solvents from industrial production or agricultural protective
substances. Based on the large surface area of the porous silicon, the
porous silicon material has become the ideal material for liquid and
vapor phase sensors. The principle of pSi-sensors is a determination
of the optical spectral shift caused by refractive index change of the
porous silicon layers in the device due to the interaction with liquid
and/or gas. The advantages of photonic sensors are highly sensitivity,
so that they are suitable for determination of organic solvents or
4
pesticides at low concentrations. Therefore, “Fabrication and
investigation of characteristics of photonic microcavity 1D for
optical sensors” has been selected as a research topic of the thesis.
2. The objectives of the thesis
i) Research and fabricate the one-dimensional (1D) – nanoporous
silicon microcavity (1D-NPSMC) structures by using electrochemical
etching method with the selectivity of wavelength in visible range
from 200 nm to 800 nm. The 1D-NPSMC structures has high
reflectivity, narrow linewidth of the pass-band and homogeneous
pores ii) Design the photonic sensor device based on 1D-NPSMC
structure which is capable of measuring in two modes: liquid phase
(used for determination pesticides) and vapor phase (used for
determination
organic
solvents)
iii)
Determinate
the
low
concentrations of pesticides and organic solvents in aqueous medium.
3. The main contents of the thesis
i) Research and fabricate 1D-NPSMC structures based on porous
silicon ii) Calculate and simulate optical characteristics of 1DNPSMC structures by using Transfer Matrix Method (TMM) iii)
Design the photonic sensor device based on 1D-NPSMC structure
which is capable of measuring in two modes: liquid phase (used for
determination pesticides) and vapor phase (used for determination
organic solvents) iv) Determinate the low concentrations of
pesticides and organic solvents in aqueous medium.
4. Thesis structure: This thesis consists of 148 pages: introduction,
five chapters in content, conclusion. The main results were published
5
on 06 articles was published on international journal, 01 presentation
at an international workshop and 01 patent.
Chapter 1: OVERVIEW ABOUT PHOTONIC MICROCAVITY
1D AND POROUS SILICON:
In this chapter, we introduce photonic crystals from the concept to
the structure of all 1D, 2D and 3D photonic crystals. Particularly, this
chapter details the structure of the 1D photonic resonator and the
formation of silicon by electrochemical etching method. The
advantages of silicon and its application in the field of sensing are
detailed in this chapter.
Chapter 2:
DESIGN AND SIMULATUION OF THE 1D MICROCAVITY
STRUCTURES BASED ON POROUS SILICON
This chapter describes the basic physics theory of one dimensional
photonic crystals and the transmission of optical waves in layered
media. The Kronig-Penny model is reviewed as a rigorous model for
one dimensional periodically layered dielectric media. Next, the
Transfer Matrix Method (TMM) is developed and its uses in
calculating the band gaps of the non-defect PhCs and the reflection
properties of defects introduced PhC structures are presented. This
simulation work explored the effect of the refractive indices
variation, the thickness of each layer and the number of layers on the
formation of band gaps and on resonant transmissions in 1-D PhC
microcavities. The obtained band gap was compared with the
6
simulation result based on the Kronig-Penny model, and the structure
parameters defined from the simulated reflection spectra laid the
foundation for the following fabrication work. Parameters affecting
the sensitivity of the optical sensor based on the 1D microcavity
structure on the silicon wafer are also detailed.
Chapter 3:
FABRICATION OF THE 1D – MICROCAVITY BASED ON
POROUS SILICON
3.1. Principle, process of fabrication of the 1D microcavity based
on porous silicon
3.1.1. Fabricating principles
This part introduces the principle of fabricating 1D microcavity based
on porous silicon by using electrochemical etching method.
3.1.2. Process of fabricating 1D microcavity structure
This section details the steps of fabrication of 1D microcavity
structure.
3.2. Design and fabrication of 1D microcavity structure
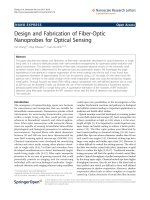
The microcavity structure
consists
of
two
parallel
reflectors separated by a
spacer layer. Usually the
reflectors used are λ/4 DBR
with optical thickness of the
layers
λ/4.
The
optical
thickness of the spacer layer
can be either λ or λ/2.
Porous
silicon
microcavities are formed
Figure 3.5. (a) Schematic illustration of microcavity
structure represented by a half-wave optical
thickness defect layer between two Bragg mirrors.
The Bragg mirrors consist of alternating layers of
high and low refractive index quarter-wave optical
thickness layers. (b) Reflectance spectrum of
microcavity. The defect layer introduces a narrow
resonance in the middle of the high reflectance
stopband.
7
by first etching a top Bragg mirror with alternating quarter
wavelength optical thickness layers of low and high porosities (high
and low refractivve indices, respectively), then etching a half
wavelength optical thickness defect layer with the same refractive
index as the high porosity mirror layers, and finally etching a bottom
Bragg mirror with the same conditions as the top mirror. Detailed
electrochemical etching conditions are provided in Table 3.1.
The characteristics of the microcavitity structures were determined
by field-emission scanning electron microscopy (FE-SEM; S-4800)
and the reflectance spectra of samples were studies by a UV-VISNIR spectrophotometer (Varian Cary-5000) and USB 4000
spectrophotometer.
3.3.
Some methods of studying the structure and optical
properties of porous silicon materials
The optical properties and quality of the 1D photonic resonator
structure depend greatly on the size of the porous holes, the thickness
of the layers. Therefore, the identification of these factors is of
particular importance in understanding the relationship between the
structure and optical characteristics of microcavites made of silicon.
In this section, we present some of the methods used in this thesis to
observe the morphology, size, structure and optical characteristics of
1D microvities such as scanning electron microscopy SEM, Metricon
Prism 2010 Model, Varian Carry 5000 Spectrum Analyzer, USB
4000
3.4. The 1D microcavity structures
Table 3.3. Parameters of fabrication of 1D-PCs structure in
visible range with 12 periods
8
Sample
Layers
Periods
M03
nH
nL
12
Current Density
(mA/cm2)
15
50
Time (s)
4,47
2,3
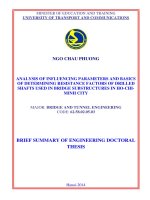
Figure 3.18
shows FESEM
images
of
the 1D-PC
in
visible
the
range
Figure 3.18. FE-SEM images of the 1D-PC in the visible range with 12
periods
with
12
periods.
Figure
presents
the
3.19
reflection
spectra of 1D-PC structure
in visible range.
Detailed
electrochemical
etching
conditions of microcavity
structure in visible range.
are provided in Table 3.4. The
porous silicon microcavities
Hình 3.19. The reflection spectra of 1D-PC
structure in visible range at 608 nm centre
wavelength.
used in this thesis typically
consist of 4.5/5 period upper/lower Bragg mirrors. Each period
consists of one low porosity and one high porosity layer. Therefore, a
half period means that there is an additional low porosity layer
formed. Increasing the naumber of mirror periods enables higher Qfactor microcavities.
9
Bảng 3.4. Electrochemical etching conditions for a porous
silicon microcavity at 650 nm resonant wavelength
Current density
(mA/cm2)
Etching time
(s)
15
5,16
50
2,65
1
15
5,16
1
50
5,31
15
5,16
50
2,65
Descriptionả
Period
DBR1
4
Spacer layer
DBR2
5
Figure
3.20
shows
cross-section and planview
images
of
the
microcavity based on
(HL)4.5LL(HL)5 porous
silicon
multilayer
structure, where H and L
labels
correspond
to
Figure 3.20. (a) Cross-section and (b) SEM plan-view
images of a porous silicon microcavity design in the
(HL)4.5LL(HL)5.
Figure 3.23. The reflection spectrum of
1D microcavity structure at 654 nm
resonant wavelength.
Figure 3.23. 04 samples of microcavity
structure in the visible range
10
high and low refractive index layers, respectively, 4.5 and 5.0 mean
four and half and five pairs of HL, because this gives a good
reflectivity spectrum, possibly controlling the porosity of layers, and
easily repeatable electrochemical etching method. Figure 3.23
presents images of 4 microcavity structure samples in the visible
range.
3.5. Design of photonic sensor device based on 1D-porous silicon
microcavity
Figure 3.34 is a block diagram of a photonic sensor device used in a
thesis including a liquid method (application of non-volatile
analytical substance) and vapor organic compounds (application for
volatile compounds).
Figure 3.26. The schematic of photonic sensor device
Hình 3.23. Phổ phản xạ của cấu trúc vi cộng
hưởng quang tử 1D sau khi chia cho cường độ
phản xạ của mẫu nền.
Figure 3.27. Schematic of the pesticide concentration
measurement by liquid-drop method using the porous
silicon microcavity sensor.
Figure 3.28. Schematic of the
concentration measurement for VOC
using a sensor based on the porous
silicon microcavity
11
Figure 3.33. Overall drawing of equipment and
sensor systems
Figure 3.29. The image of photonic sensor
device
Chapter 4:
DETERMINATION OF PESTICIDE RESIDUES IN
AQUATIC ENVIRONMENT BASED ON POROUS SILICON
MICROCAVITIES
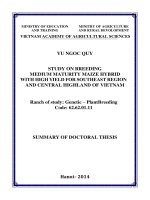
4.1. Principle of optical sensing
Principle
of
interferometric
transduction is used, in
which
the
molecular
recognition events are
converted into optical
signals via the change of
Figure 4.1. Schematic Diagram of Sensor Principle
the refractive index. As
shown in the schematic
diagram (Fig. 4.1), light
reflected from the top
interface
(air-PS)
and
bottom interface (PS-Si
substrate) interfere with
Figure 4.2. Wavelength shift in the reflectance
spectra of sensor device before and after analyte
substance absorption
12
each other and form the typical Fabry-Perot fringes in the reflectance
spectrum.
For bare 1D-NPSMC structure (without any analyte), the refractive
index of the structure is n. When the pores are filled with an analyte
(e.g., chemicals or bio-chemicals), the effective refractive index of
the structure increases from n to n+Δn with shift in wavelength from
λ+Δλ in the reflectance spectra due to increased optical thickness of
the structure. Hence, by analyzing the wavelength shift in the
reflectance spectra, capture and detection of the analyte is done.
Figure 4.2 shows principle of optical sensing based on porous silicon
microcavity.
4.2.
The optical sensing applications based on the 1Dnanoporous silicon microcavity
For converting the surface of
the silicon nano-crystals from
hydrophobic to hydrophilic, the
as-prepared sample was oxidized
in an ozone atmosphere for 45
min by using the ozone generator
(H01 BK Ozone with a capacity
of 500 mg/h). Futhermore, the
controlled process of pSi oxidation
Figure 4.3. The reflection spectra of the
microcavity before (curve 1) and after
oxidization (curve 2)
improved the durability of skeletal
structure and for long life time of ageing pSi. Figure 4.3 shows the
reflection spectra of the microcavity before and after oxidization. The
reflection spectra were carried out on a spectrometer (USB-4000,
Ocean Optics) and a halogen light source (HL-2000 Ocean Optics).
The blue shift of the resonant wavelength after oxidization is due to a
13
decrease in the effective index of the porous layers in the
microcavity.
4.3. Determination of solvent solutions using 1D-nano porous
silicon microcavity
4.3.1. Characteristics of liquid-phase photonic sensors
Table 4.1. Various organic solvents with known refractive index and resonant wavelength of
sensors based on porous silicon microcavity dipped in corresponding solvent
Refractive
Resonant
index
wavelength (nm)
Air
1.0003
504.75
Methanol (99.5%)
1.3280
572.05
Ethanol (99.7%)
1.3614
579.00
Isopropanol (99.7%)
1.3776
583.17
Methylene chloride (99.5%)
1.4242
592.85
Organic solvent
Sensitivity (Δλ/Δn) is one of the most important parameters to
evaluate the performance of the sensors. Using the experimental data
in Table 1, we calculate the sensor sensitivity of about 200 nm/RIU.
The Spectrophotometer Varian Cary 5000 is able to detect a
wavelength shift of 0.1nm, corresponding to the minimum detectable
refractive index change in the porous silicon layer of less than 10 -3 .
Experiment shows that after complete evaporation of organic solvent,
the reflectance spectra of the sensors return to their original
waveform positions (as in the air). In our case the evaporation of
organic solvents in open air at room temperature was carried out for
40-50 minutes, but this process can occur in 20 seconds when the
samples are in a vacuum chamber with 10 -1 torr. That means, the
14
change of sensor reflectance spectra are temporary, and it is useful
for reversible optical sensing..
4.3.2. Determination of concentrations of organic solvents in the
gasoline
The
based
been
microcavitysensors
applied
determination
have
to
of
different solutions of
ethanol and methanol
in
the
commercial
gasoline A92. Figure 4
shows the measured
results of the resonant
wavelength shift of the
microcavity
sensor
Figure 4.8. Response characteristics of the sensor
wavelength shift for mixture of methanol and ethanol in
different concentrations and commercial gasoline A92.
immersed into gasoline
A92 with different concentrations of ethanol and methanol. In the
case of a mixture of ethanol/A92, a resonant wavelength shift is 3.6
nm, when ethanol concentration changed in the range from 5% to
15% in the gasoline. With the sensitivity of the sensor as described
above, the minimum determination of ethanol concentration change
in the gasoline is about 0.4%. In the case of methanol/A92,
wavelength shifts are 7.2 nm between the 5% and 15% methanol
mixtures,. From these experimental data, we suppose that the
enhanced sensor can distinguish change of about 0.2% in
concentration of methanol in the gasoline.
15
4.4.
Determination of pesticides residues in the aquatic
environment
Figure 4.9 demonstrates
the reflection spectra of
pSi-microcavity sensor in
the air and in pure water.
The
wavelength
shift
measured by spectrometer
USB-4000 is of 39.8 nm in
water and this value is
kept for referent data of
used sensor for liquiddrop
Figure 4.9. The reflection spectra of pSi-microcavity
sensor in air (curve 1) and in pure water (curve 2). Inset:
Image of pSi-sensor with surface area of about 0.8 cm2.
measurement
method.
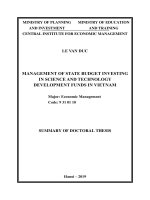
Fig.4.11 shows a linear relation
between the different concentrations
of atrazine and the wavelength shift.
Each experimental point was the
average
on
five
measurements,
the
representing
the
independent
error
Figure 4.11. Peak shift of PSMC as a
function of Atrazine concentration in
both aqueous and humic solutions
bar
standard
deviation. The calibration plot of
obtained sensor device indicates a
good and
linear response
to
atrazine within the concentration
range from 2 to 22 pgmL-1. We
could calculate the sensitivity of the
Figure 4.12. Wavelength shift of pSi-sensor
as a function of atrazine concentration in
water and humic acid solutions at different
times
16
sensor device as the slope of the linear curve interpolating the
experimental points. Thus, we obtained the value of 0.3 and 0.6
nm/pgmL-1 for Atrazine queous and humic solution, respectively.
From these numbers, we also estimated the limit of detection (LOD),
as the ratio between the instrument resolution and sensitivity. LOD
numerical value is 1.4 and 0.8 pgmL-1 for Atrazine queous and
humic solution, respectively. Also, it was observed that the higher
wavelength shift was observed in the case of atrazine in HA because
atrazine with HA contains dissolved organic matter as component
which have higher refractive index compare to water.
Fig. 4.13 presents the
results of detection of αand
β-
endosulfan
concentration in water.
The endosulfan of α- and
β-
isomers
can
be
specified by the different
slope of the dependence
between
wavelength
shift
endosulfan
and
concentrations. The LOD
of pSi-sensor is obtained of
Figure 4.13. Wavelength shift of pSi-sensors as a
function of α- and β-endosulfan concentrations in
water
0.32 µg.mL-1 and of 0.21 µg.mL-1 for α- and β-endosulfan,
respectively. This LOD is still low level of detection in comparison
with gas chromatography method [25] (about 0.12 - 0.15 ng.mL-1),
but the pSi-sensor method has advantage in the low cost, simple
sample preparation process and that is suitable for detection of
endosulfan in the out-door field work.
17
Chapter 5
DETERMINATION OF SOLVENT CONCENTRATION BY
USING 1D NANO-POROUS SILICON PHOTONIC SENSORS
5.1. Experimental setup for VOC method
5.1.1. Theoretical basis
The capillary deposition of vapour in the pores which caused an
increase in the effective refractive index of the porous layer and a
shift of the reflection spectra of the sensor is represented by the
following Kelvin equation:
rK
2 M
RTSe ln(
(5.1)
P
)
P0
where γ, M, and ρ are the surface tension, molecular weight and
density of vapour molecules, respectively, P is the observed vapour
pressure, and P0 is saturation vapour pressure of analyte, R is ideal
gas contant, TSe is the temperature of the sensor chamber, rK is the
Kelvin radius that characterizes the process of capillary deposition.
5.2. Determination of solvent concentration by VOC method
Table 5.1. Some relevant physical-chemical properties of organic solvents used in
sensing experiment
Substances
n
ρ
(g/cm3)
VP
(kPa)
BP
(0C)
Ethanol
1,3614
0,785
5,9
78,5
Methanol
1,3284
0,791
12,8
64,6
Acetone
1,3586
0,791
24
56,2
Water
1,3330
0,998
1,75
100
18
5.2.1. The dependence of the sensor response on temperature of
the solution and velocity of the air stream flowing through the
solution
Figure 5.4. The dependence of the
Figure 5.3. The dependence of the wavelength wavelength shift on the airflow velocity in
shift on ethanol concentration when the velocity
the range 0-2.5ml.s-1.
of air flow (V) and temperature of solution (T)
work as parameters in the measurements. The
Figure
5.3
shows
the
curves 1-3 received from measurements with
pairs of these parameters such as V= 0.84ml.s-1 dependence of the resonant
and T=30℃, V=0.84 ml.s-1, T=45℃,
wavelength shift Δλ(C) on
V=1.68ml.s-1 and T=30℃, respectively.
ethanol
concentration,
when
velocity of the airflow (V) and temperature of the solution (T) work
as parameters in the measurements. It can be seen in Figure 5 that the
curve described by Δλ(C) is linear and its slope, i.e. sensitivity of the
measurement, increases as V and T increase.
Figure 5.4 shows the dependence of Δλ on V, Δλ (V), at a
temperature of 300C when concentration of ethanol and acetone work
as the parameters. It can be seen in Fig. 6 that curves describing Δλ
(V) are separate straight lines with different concentrations of acetone
and ethanol. This shows that empirical function ϑ (V) is a linear
function of V.
19
5.2.2.
Comparative sensitivity of the three methods (volatile
organinc compound (VOC), liquid drop and saturated vapour
pressure)
Parameters TSo and V had been changed from 30oC to 100oC and
from 1.68 mL.s-1 to 2.22 mL.s-1, respectively.
Figure 5.4. The dependence of the resonant wavelength shift (a), Δλ, and the sensitivity (b), S,
on the volume concentration of ethanol in water, C, from the liquid, saturated vapour
pressure and VOC measurements when solution temperature, T, and velocity of the air flow,
V, work as parameters
Fig. 5.4 shows the dependence of the resonant wavelength shift, Δλ,
and the sensitivity, S, on the volume concentration of ethanol in
water, C, from the liquid drop, saturated vapour pressure and the
VOC methods when solution temperature, TSo, and velocity of the air
flow, V, work as parameters. Among those, the VOC method
provides the highest sensitivity at low solvent volume concentrations
because it can create a high vapour pressure of the analyte on the
sensor surface owing to the capillary deposition of organic solvent
into the silicon pores.
5.3. Determination of methanol content in alcohol based on 1DNPSMC
20
5.3.1. Determination of methanol concentrations in alcohol
The prepared solution samples
to
simulate
contaminated
beverages (for example, vodka)
with total alcohol content of
30% v/v
(CE = 30%)
45% v/v
and
of
(CE = 45%).
Contamination was simulated by
adding methanol to the samples
in proportions ranging from 0 to
5% v/v.
Fig.
5.8
shows
the
dependence of the wavelength shift,
Δλ, on methanol concentration, Cm,
Figure 5.8. Dependence of wavelength
shift on methanol concentration in the
drinking alcohol with ethanol
concentration of 30% and 45%v/v at the
temperature of sensor chamber TSe=
22oC and the temperature of solution
changed.
in 45% and 30% alcohol at sensor
temperature of 22 oC when the solution temperature, Tso, works as a
parameter. Note that the dependence of the wavelength shift on
methanol concentration can be described as a linear curve whose
slope increases with the concentration of ethanol in solution and the
solution temperature. Normally, with the increase of pressure, the
curve describing the dependence of the wavelength shift on vapor
pressure shows alternately the low slope in the mechanism of
physisorption, the high slope in the capillary deposition and then the
significantly reduced slope in the wetting regime [13]. In our case,
the relatively large wavelength shift at methanol concentration of 0%
shows that the capillary deposition has occurred at the solution
temperature from 45o to 55oC for both ethanol solutions. Working in
the capillary deposition, response of sensor is linear in the narrow
21
range of concentrations. It is evident that the sensitivity calculated as
slope of the curve interpolating the experimental points is
proportional to the solution temperature.
Fig. 5.9 depicts the dependence
of the wavelength shift, Δλ, on
methanol concentration, Cm, in
the ethanol-water at the solution
temperature of 550C when the
sensor
temperature
TSe
0
decreased from 28 to 14 C.
Obviously, curves from 1 to 7
describing the dependence of Δλ on
Cm are linear and their slope
increases with the increase of the
concentration of ethanol in solution
Figure 5.9. The dependence of the
wavelength shift on methanol
concentration in 45% and 30% alcohol
at the solution temperature of 550C
when the sensor temperature, TSe, works
as a parameter
and with the decrease of the sensor
temperature. In curve 8, the response of sensor is linear for methanol
concentrations lower than 3% and then the shift increases slowly with
concentration until saturation at about 5%. At this concentration, as
mentioned above, the sensor works in the wetting regime with a
significant reduction in sensitivity.
5.3.2. Determination of methanol and ethanol in industrial alcohol
At present, there are many types of counterfeit wine mixed with
industrial alcohol with high methanol content. These counterfeit
drinks cause poisoning to drinkers that can lead to death. Therefore,
the purpose of this section is to determine the content of methanol
contained in vodka prepared from industrial alcohol. As in the