Studies on combining ability and panicle mite resistance in hybrid rice (Oryza sativa L.)
Bạn đang xem bản rút gọn của tài liệu. Xem và tải ngay bản đầy đủ của tài liệu tại đây (792.68 KB, 14 trang )
Int.J.Curr.Microbiol.App.Sci (2019) 8(6): 390-403
International Journal of Current Microbiology and Applied Sciences
ISSN: 2319-7706 Volume 8 Number 06 (2019)
Journal homepage:
Original Research Article
/>
Studies on Combining Ability and Panicle Mite Resistance
in Hybrid Rice (Oryza sativa L.)
Sameena Begum*, B. Srinivas, V. Ram Reddy and Ch. ArunaKumari
Agricultural College, Jagtial, Professor JayashankarTelangana State Agricultural
University, Hyderabad, India
*Corresponding author
ABSTRACT
Keywords
Combining ability,
Panicle mite, Grain
yield, Rice (Oryza
sativa L.)
Article Info
Accepted:
04 May 2019
Available Online:
10 June 2019
Studies were conducted on the combining ability and relative resistance of rice hybrids
against panicle mite (Steneotarsonemus spinki) during Kharif, 2017. Six cytoplasmic male
sterile lines were crossed to seven testers in Line X Tester mating design to produce 42
hybrids. The parents and hybrids along with two checks were evaluated. The analysis of
variance for combining ability showed that mean sum of square due to lines, testers and
the interaction between lines and testers was significant for most of the characters under
study. The result revealed that peak incidence of mite occurred at the ripening stage but
significantly higher number of mite population and damage symptoms in all plants were
observed at the panicle emerging to ripening stage. Out of 42 rice hybrids and 13 parental
lines evaluated, based on GCA and SCA effects two parental lines viz., JMS 20B and JR
80 and fifteen hybrids were of good yield potential and resistant against panicle mite with
no damage symptoms. The results on categorization of resistance revealed that, five
parental lines and eleven hybrids contribute for moderate resistance. Six parents and
sixteen hybrids were found susceptible against Steneotarsonemus spinki.
still lower with regard to per hectare yield or
productivity. Development of new varieties
with high yield and quality parameters is the
prime objective of all rice breeders. The first
step in a successful breeding program is to
select appropriate parents. Combining ability
analysis is one of the powerful tools available
to estimate the combining ability effects and
aids in selecting the desirable parents and
crosses for the exploitation of heterosis
(Sarker et al., 2002; Muhammad et al., 2007).
Traditionally, insect pests, diseases and weeds
are the triple evils responsible for low yields
of rice in India. Introduction and wide
Introduction
Rice (Oryza sativa L.) is the major source of
calories for a large portion of the world’s
population, particularly in Asia, where more
than 90 per cent of all rice is grown and
consumed by about 60 per cent of the world’s
population. India is number one in area with
approximately 44.5 million hectares of rice
and it ranks second in production with
approximately159.02 million tones. But the
productivity of 3570 kg per hectare (IRRI,
2017) is far below the world’s average
productivity. India ranks approximately15th or
390
Int.J.Curr.Microbiol.App.Sci (2019) 8(6): 390-403
adoption of high yielding varieties has led to
severe incidence of different insect pests. Of
late, mites are also assuming major pest
status. Among different species of mites
associated with rice crop, the sheath mite or
panicle mite and the leaf mite are most
important. The sheath mite, Steneotarsonemus
spinki in association with the sheath rot
fungus, Acrocylindrium oryzae causes grain
discolouration, ill-filled and chaffy grains and
often inflicts heavy losses in rice, in almost all
Asian countries.
Materials and Methods
To generate information on combining ability
and resistance to panicle mite, 42 rice hybrids
and 13 parental lines along with two highly
susceptible checks BPT 5204 and JGL-3855
were evaluated under natural field conditions
at RARS, Polasa, Jagtial. The experiment was
laid out in RB D (Randomized Block Design)
having 2 replications. Each entry was planted
in two rows of four meters length with a
spacing of 20 x 15 cm. Irrigation, fertilizers
and intercultivation operations were taken up
at regular intervals. Data was collected from
an average of five plants from each entry in
each replication on the following traits: Days
to 50 per cent flowering, plant height (cm),
panicle length (cm), number of productive
tillers per plant, number of grains per panicle,
spikelet fertility percentage, 1000- grain
weight (g), grain yield per plant (g), hulling
percentage, milling percentage, head rice
recovery, kernel length, kernel breadth, kernel
L/B ratio, paddy length, paddy breadth and
paddy L/B ratio. Analysis of variance for
grain yield and other traits were performed
using the model described by (Kempthorne
1957). The entries were screened for rice
panicle mite based on the preliminary or
composite scale, developed at Rice Research
Centre, ARI, Rajendranagar after the check
entries showed panicle mite incidence on leaf
sheath and more than 50 per cent grain
discolouration. Observations were recorded
from 5 hills (Table 1 and 2).
Sheath mite, Steneotarsonemus spinki and
leaf mite, Oligonychus oryzae are the two
most important mite species damaging rice
crop. S. spinki remains in the leaf-sheath
below epidermis and during the reproductive
phase of the crop growth, S. spinki migrate to
the developing grains in milky stage and
cause spikelet sterility and also partially filled
and ill filled grains (Sogawa, 1977).
Deformed panicles and inflorescences, lesions
on the inner surface of leaf sheaths and
browning of rice hulls are also caused by this
mite (Cho et al., 1999). Mite population in the
leaf sheath and grain has a positive correlation
with grain sterility and negative correlation
with grain weight confirming that S. spinki is
responsible for these symptoms (Lo and Ho,
1977). Reduction in panicle size, length of
panicle neck, panicle weight occurred as a
result of damage by S. spinkia long with
sheath rot fungus (Ghosh et al., 1997).
Some information on these mite pests is
available from other Asian countries but the
information available from India is scarce.
Therefore, it is very essential to initiate some
research programmes in India on these mites.
This investigation was conducted to
determine the level of resistance against
Steneotarsonemus spinki and also to find out
the resistant or tolerant rice hybrids. The
identification of resistant or tolerant rice
hybrids will help breeders for future use in
developing resistant new breeding rice lines.
Results and Discussion
Combining ability studies
The analysis of variance for combining ability
of all the traits under study has been presented
in the Table 3. The variance due to treatments
was highly significant for all the characters
under study. The parents exhibited significant
differences for all the traits studied except for
spikelet fertility, grain yield per plant, kernel
391
Int.J.Curr.Microbiol.App.Sci (2019) 8(6): 390-403
breadth and paddy L/B ratio. The variance
due to crosses was found highly significant
for all the characters. The variance due to
parent vs. crosses was also found highly
significant for most of the characters except
number of productive tillers per plant. The
variance due to lines was found significant for
all the traits except number of productive
tillers per plant, spikelet fertility, number of
grains per panicle, grain yield per plant,
kernel breadth and paddy L/B ratio, whereas
the variance due to testers was found nonsignificant for spikelet fertility and paddy L/B
ratio. When the effects of crosses was
partitioned into lines, testers and line x tester
effects, the interaction effects (lines x testers)
were found to be significant for all the traits
under study. This suggested that sufficient
variability is available in the material used for
study.
tester being negative while three lines and
three testers were positive. Only one tester
was positively significant for number of
productive tillers per plant. Nine parents
displayed significant 1000- seeds weight
differences; one line and two testers were
negative while two lines and three testers
were positive. Eight parents exhibited
significance for number of grains per panicle;
two lines and three testers were negative and
one line and two testers were positive. Four
parents were significantly different for
spikelet fertility, one line and one tester being
positive while one line and one tester were
positive. Ten parents exhibited significance
for grain yield per plant, two lines and four
testers were negative and two lines and two
testers were positive while, two lines and
three testers had positive and significant GCA
effect four lines and two testers were
positively significant for hulling percentage.
Nine parents were significant for milling
percentage with three lines and two testers
being negative while two lines and two testers
were positive.
Similar works have been reported by Shukla
and Panday (2008) for lines and line x tester
interaction, Nadali and Nadali (2010) for
crosses, lines and line x tester interaction,
Srikrishna Latha et al., (2013) for treatments,
hybrids, testers and line x tester and Gaurav
Dharwal et al., (2017) for treatments, lines
and line x tester. The results pertaining to the
estimate of combining ability revealed that
mean sca variance was relatively greater in
magnitude than gca variance for all the traits
except panicle length, 1000- grain weight,
kernel breadth and paddy length indicating
that these traits were predominantly under the
control of non-additive gene action.
All the parents displayed significant head rice
recovery percentage differences; three lines
and four testers were negative while three
lines and three testers were positive. Two
lines and three testers were positively
significant for kernel length. Eight parents
were significantly different for kernel breadth,
among which three lines and two testers were
positively significant. Seven parents were
significantly different for kernel L/B ratio,
three were negative and four were positive.
One line and two testers for paddy length, one
line and one tester for paddy breadth and two
lines and three testers for paddy L/B ratio
exhibited a positive significant GCA effects
(Table 4). In this study negative gca effects of
the days to 50 per cent flowering, plant height
were desirable. While positive gca effects for
other characters are needed. The perusal of
the results revealed that the line JMS 20B was
Genetic analysis of data showed that twelve
parents had significant GCA estimates of line
and testers for plant height with four lines
being positive and one negative, three testers
being positive and one negative. Nine parents
were significantly different for days to 50 per
cent flowering; three were negative and six
were positive. Nine parents were significant
for panicle length with two lines and one
392
Int.J.Curr.Microbiol.App.Sci (2019) 8(6): 390-403
good combiner for days to 50 per cent
flowering, panicle length, 1000 - grain weight
and kernel length. Line JMS 21B was good
combiner for number of grains per panicle,
spikelet fertility, grain yield per plant, hulling
percentage, milling percentage, head rice
recovery, kernel breadth and paddy breadth,
while line JMS 19B performed well for
spikelet fertility, kernel L/B ratio, paddy
length and paddy L/B ratio. The tester, JBR 6
was good general combiner for number of
productive tillers per plant and grain yield per
plant. Whereas, JMBR 44 for days to 50 per
cent flowering, plant height and kernel
breadth. Tester JR 85 was also good general
combiner for most of the quality traits. Hence,
these good general combiners of males and
females may be extensively used in future
hybrid rice breeding programme.
CMS 52A X JBR 6 (13.10) showed positive
and significant sca effect. Sixteen crosses
exhibited significant sca effect for grains
yield per plant. The highest positive sca was
recorded by the cross JMS 20A X JMBR 44
(13.33) and the lowest was recorded by the
cross JMS 11A X JR 83 (5.37). The cross
JMS 21A X JBR 6 (-4.88) recorded the
highest negative sca effect for grain yield per
plant while the lowest was recorded by the
cross JMS 21A X JR 85 (-15.51). Out of 42
crosses, sixteen crosses recorded significant
positive sca effects for hulling percentage
with a range from -7.74 (CMS 64A X JMBR
31) to 4.54 (CMS 64A X JR83). sca effects
ranged from -11.91 (CMS 64A X JMBR 31)
to 10.31 (CMS 52A X JMBR 31) for milling
percentage. Seventeen crosses were found
with highly positive and significant sca
effects and registered as best specific
combiners for the trait. The range of sca
effects for head rice recovery varied from 14.62 (CMS 64A X JMBR 31) to 9.53 (CMS
52A X JMBR 31). Out of 42 hybrids, twenty
hybrids recorded positive significant sca
effect. The best specific combiners for this
trait are CMS 52A X JMBR 31 (9.53), CMS
64A X JBR 6 (7.91) and CMS 52A X JR 67
(6.65). Fifteen hybrids expressed significant
positive sca effects for kernel length. The
cross, JMS 11A X JR 80 (0.42) recorded
highest positive sca effect followed by JMS
19A X JR 67 (0.41) and JMS 21A X JBR 6
(0.39). One cross recorded significant positive
sca effect and two crosses registered
significant negative sca effects with a range
from -0.22 (JMS 21A X JR 80) to 0.15 (JMS
21A X JR 85) for kernel breadth. A range of 0.35 (JMS 21A X JR 85) to 0.35 (JMS 11A X
JR 83) was recorded for sca effects with
regard to kernel L/B ratio. Three crosses
exhibited negative significant sca effect,
among which JMS 21A X JR 85 (-3.55)
recorded low significant sca effect and the
cross JMS 11A X JR 83 (0.35) recorded high
significant sca effect. The best specific
Twenty seven crosses were significant for
days to 50 per cent flowering, CMS 64A x
JMBR 31 (-9.98) had high negative sca and
CMS 64A X JR 83 (15.01) had high positive
sca. For plant height; thirteen crosses had
negative and thirteen had positive sca effects.
The highest negative sca was recorded by
JMS 20A X JBR 6 (-19.97) and the lowest
recorded by JMS 11A X JR 83 (-3.81). JMS
19A X JMBR 44 (-1.79) had high negative
and significant sca for panicle length while
JMS 11A X JBR 6 (2.90) showed positive and
significant sca effect. Only three crosses viz.,
JMS 11A X JBR 6 (2.13), JMS 20A X JMBR
44 (1.81) and CMS 64A X JR 85 (1.79)
recorded positive significant sca effect for
number of productive tillers per plant. The
highest positive sca for 1000- grain weight
was recorded for the cross CMS 64A X
JMBR 31 (3.06) while the highest negative
sca was recorded by JMS 11A X JMBR 31 (1.25). Nine crosses were significant for
number of grains per panicle JMS 21A X JR
67 (62.60) had high positive sca effect. JMS
11A X JBR 6 (-9.80) had high negative and
significant sca for spikelet fertility while
393
Int.J.Curr.Microbiol.App.Sci (2019) 8(6): 390-403
combiners identified for this trait are JMS
11A X JR 83 (0.35), JMS 19A X JBR 6 (0.33)
and CMS 52A X JMBR 44 (0.28). Out of 42
crosses, seven crosses recorded significant
positive sca effects for paddy length with a
range from –1.49 (CMS 52A X JR 83) to 0.95
(CMS 64A X JR83). The best specific crosses
for this trait are JMS 11A X JR 83 (0.95),
CMS 52A X JR 80 (0.89) and JMS 11A X
JBR 6 (0.74). The range of sca effects for
paddy breadth varied from -0.35 (JMS 21A X
JMBR 44) to 0.42 (JMS 11A X JMBR 44).
Out of 42 hybrids, nine hybrids recorded
positive significant sca effects. The best
specific combiners identified for this trait are
JMS 11A X JMBR 44 (0.42), CMS 52A X JR
85 (0.21) and CMS 64A X JR 67 (0.20).
Among the crosses, eighteen crosses recorded
significant sca effects, where nine crosses
showed positive sca effects and nine crosses
showed negative sca effects. The cross JMS
11A X JBR 6 (0.71), CMS 64A X JR 85
(0.61) and JMS 20A X JR 85 (0.57) were
identified as best specific combiners for this
trait (Table 5).
The lines JMS 21B, JMS 20B, JMS 19B and
testers JBR 6, JR 67 were recorded significant
gca effects for grain yield per plant. These
parents resulted in the production of best
single crosses JMS 21A X JR 85, JMS 20A X
JMBR 44, CMS 52A X JBR 6, JMS 11A X
JBR 6, JMS 19A X JR 80 and JMS 11A X
JBR 6 with positive sca effects for grain yield
indicating the possibility of production of
desirable crosses, with high sca effects from
low yielding parents. The superior crosses
identified with high x high gca effects can be
exploited through pedigree breeding method
and the better crosses with high x low and low
x low gca effects can be improved through
biparental mating and recurrent selection
methods.
Specific combining ability (SCA) effects of
hybrids alone has limited value for choosing
parents in a breeding program, and must be
used in combination with other parameters
such as GCA of the respective parents and
actual performance of the hybrids (Marilia et
al., 2001). However, SCA is important to
identify parents of opposite heterotic types
which should be improved within and not
across heterotic groups. The hybrid
combinations
with
significant
mean
performance, significant and desirable
heterosis and significant desirable SCA
estimates and which involve at least one of
the parents with high GCA would likely
enhance the concentration of favorable alleles
and this is what a breeder desires to improve a
trait (Kenga et al., 2004). However,
enhancing favorable alleles should be done
separately on opposite sides of heterotic
groups in this investigation; good specific
combiners were identified based on sca
effects of the crosses and gca effects of the
parents involved in the cross.
Panicle mite resistance studies
The crosses CMS 64A X JMBR 31 and JMS
20A X JR 85 were identified as good specific
combiners for days to 50 per cent flowering,
JMS 20A X JBR 6 and CMS 64A X JR 80
were good specific combiners for plant
height, CMS 64A X JMBR 31 and JMS 11A
X JR 80 for 1000- grain weight, JMS 21A X
JR 67 and JMS 19A X JR 85 for number of
grains per panicle CMS 52A X JBR 6 and
CMS 52A X JR 67 for spikelet fertility while,
JMS 11A X JBR 6 was good specific
combiner for panicle length and number of
productive tillers per plant. CMS 64A X JR
83 for hulling percentage and paddy length,
CMS 52A X JMBR 31 for milling percentage
and head rice recovery were the potential
hybrids with high sca effects. Many authors
reported similar results in rice Ghara et al.,
(2012), Hasan et al., (2013), Savita Bhatti et
al., (2015), Gaurav Dharwal et al., (2017) and
Rumanti et al., (2017).
Thirteen parents and their forty two rice
394
Int.J.Curr.Microbiol.App.Sci (2019) 8(6): 390-403
hybrids were screened and categorized based
on the preliminary composite scale developed
at Rice Section, Agricultural Research
Institute, Rajendranagar. The check varieties
viz., JGL 3855and BPT 5204 were highly
susceptible for panicle mite. Based on the
screening, the entries were categorized as
highly susceptible, moderately susceptible,
susceptible, moderately resistant and resistant
as presented in Table 6.
CMS 52A X JR 83, CMS 52A X JR 80, CMS
52A X JMBR 31, CMS 52A X JR 67, JMS
21A X JR 80, JMS 21A X JMBR 31, JMS
21A X JR 67, JMS 20A X JR 85, JMS 20A X
JMBR 31 and JMS 20A X JR 67 were
completely resistant. Eleven hybrids JMS
11A X JR 83, JMS 11A X JMBR 44, JMS
11A X JR 67, JMS 11A X JBR 6, JMS 19A X
JR 85, JMS 19A X JMBR 31, CMS 52A X
JMBR 44, JMS 21A X JR 83, JMS 20A X JR
83, JMS 20A X JR 80 and JMS 20A X JBR 6
were moderately resistant while, CMS 64A X
JR 83, CMS 64A X JR 85, CMS 64A X JR
80, CMS 64A X JMBR 44, CMS 64A X
JMBR 31, CMS 64A X JR 67, CMS 64A X
JBR 6, JMS 11A X JR 85, JMS 19A X JR 83,
JMS 19A X JBR 6, CMS 52A X JR 85, CMS
52A X JBR 6, JMS 21A X JR 85, JMS 21A X
JMBR 44, JMS 21A X JBR 6 and JMS 20A X
JMBR 44 were found to be susceptible.
Among the 13 parental lines evaluated 5 lines
viz., CMS 64B, JMS 11B, JMS 19B, JR 83
and JR 85 were moderately resistant while
two lines JMS 20Band JR 80 were found to
be completely resistant. Six lines viz., CMS
52B, JMS 21B, JMBR 44, JMBR 31, JR 67
and JBR 6 were susceptible. Out of 42
hybrids screened 15 hybrids viz., JMS 11A X
JR 80, JMS 11A X JMBR 31, JMS 19A X JR
80, JMS 19A X JMBR 44, JMS 19A X JR 67,
Table.1 Composite scale for screening against rice panicle mite
1st scale
based on damage
symptom of panicle mite
on leaf midrib
No incidence
1 – 20%
21 – 40%
41 – 60%
61 – 80%
81 – 100%
2nd scale
based on grain
discolouration (GD)
0
1
3
5
7
9
No grain discolouration
< 5% GD
5.1 – 10%
10.1 – 30%
30.1 – 50%
50.1 – 100%
0
1
3
5
7
9
3rd scale
Based on damage
symptom on leaf sheath below
boot leaf
No Symptoms
0
Up to 1cm
1
1.1 – 3cm
3
3.1 – 6cm
5
6.1 – 8cm
7
>8cm
9
Table.2 Categorization of rice entries based on composite scale as follows
HS: Highly Susceptible
MS: Moderately Susceptible
S: Susceptible
MR: Moderately Resistant
R: Resistant
All three scores between 7-9
Two scores between 7-9 and
between 1-5
Two scores between 7-9 and
score between 1-3
All three scores 3 or at least
scores 3/5 and one score 5 or
scores 5 and one score 1/3
Two scores 3, one score 1 or 0
395
one
one
two
two
9 9 9 or 7 9 9, 7 7 9 or 7 7 7 etc.,
7 7 5 or 9 9 5 or 7 9 5 or 5 5 9 etc.,
9 3 9 or 9 3 7 or 9 3 5 or 7 3 7 or 7 3 5 or 5 7 5 or 5 5
5 or 3 9 3 or 9 1 9 etc.,
3 3 3 or 3 5 5 or 3 3 5 or 5 1 7 or 5 1 5 etc.,
3 3 1 or 3 3 0 or 1 1 0 or 1 1 3 or 0 1 0 etc.,
Int.J.Curr.Microbiol.App.Sci (2019) 8(6): 390-403
Table.3 Analysis of variance for combining ability (Line x Tester) for yield
and quality traits in rice
Source of
variation
d.f
Days to
50%
flowering
Plant
height (cm)
Panicle
length
(cm)
1000grain
weight
(g)
1.57
16.01**
15.22**
9.63**
15.77**
39.83**
16.05**
No. of
grains per
panicle
Spikelet
fertility
(%)
Grain
yield per
plant (g)
0.38
7.34**
4.27**
3.95*
5.01*
1.43
10.49*
No. of
productive
tillers per
plant
5.68*
3.16**
3.12*
2.28
4.31*
0.26
0.22
Replicates
Treatments
Parents
Parents (Lines)
Parents (Testers)
Parents (L vs T)
Parents vs
Crosses
Crosses
Line effect
Tester effect
Line x Tester
effect
Error
Total
1
54
12
5
6
1
1
0.03
86.17**
57.78**
31.20**
82.83**
40.38**
17.08**
4.85
226.31**
170.97**
140.94**
217.92**
39.50*
104.01**
440.00
4420.20**
2917.96*
1770.13
4205.11**
934.15
7594.43*
62.02
126.02**
71.32
58.99
85.18
49.71
859.99**
30.22
136.23**
20.04
14.44
25.62*
14.49
72.34*
41
5
6
30
96.17**
66.72
324.46**
55.42**
245.49**
533.90*
672.23**
112.08**
8.16**
30.07**
12.37*
3.66**
3.24**
1.86
3.94
3.33**
16.25**
45.80**
42.48**
6.07**
4782.47**
10574.88*
9301.44*
2913.27*
124.13**
226.24
207.48
90.44*
171.80**
501.30*
185.60
114.12**
54
109
0.88
43.13
3.89
114.09
1.15
4.21
1.20
2.21
0.52
8.21
875.50
2627.59
45.28
85.43
11.25
73.34
Table 3 (Cont.)
Source of
variation
d.f
Hulling
(%)
Milling
(%)
Kernel
length
(mm)
Kernel
breadth
(mm)
Kernel
L/B
ratio
Paddy
length
(mm)
Paddy
breadth
(mm)
Paddy
L/B
ratio
6.08**
29.43**
10.32**
8.50**
12.32**
Head
rice
recovery
(%)
1.93
89.71**
36.46**
22.20**
35.56**
Replicates
Treatments
Parents
Parents (Lines)
Parents
(Testers)
Parents (L vs T)
Parents vs
Crosses
Crosses
Line effect
Tester effect
Line x Tester
effect
Error
Total
1
54
12
5
6
34.00**
13.54**
9.28**
0.57**
14.35**
0.02*
0.37**
0.29**
0.34**
0.28**
0.00
0.04**
0.01
0.01
0.02*
0.00
0.16**
0.12**
0.08*
0.17**
0.00
1.18**
0.44*
0.36*
0.41*
0.02*
0.05**
0.03**
0.02*
0.03**
0.08
0.38**
0.03
0.01
0.06
1
1
22.41**
0.61*
7.46**
22.53**
113.16**
14.26**
0.08**
0.53**
0.00
0.09*
0.01
0.88**
1.07*
4.82**
0.06**
0.09**
0.00
2.32**
41
5
6
30
15.10**
46.41*
9.08
11.08**
35.19**
50.14
6.86
38.36**
107.14**
396.62*
32.14
73.89**
0.39**
1.44**
0.62*
0.17**
0.04**
0.19**
0.05*
0.01*
0.16**
0.35*
0.29*
0.10**
1.31**
2.34
1.73
1.05**
0.06**
0.04
0.09
0.05**
0.43**
0.95*
0.75*
0.28**
54
109
0.07
7.05
0.41
14.84
0.52
44.72
0.00
0.18
0.01
0.02
0.03
0.10
0.13
0.65
0.00
0.03
0.03
0.21
* Significant at 5 per cent level ** Significant at 1 percent level
396
Int.J.Curr.Microbiol.App.Sci (2019) 8(6): 390-403
Table.4 Estimates of general combining ability (gca) effects for lines and testers for yield and
quality traits in rice
Source
PARENTS
LINES
CMS 64B
JMS 11B
JMS 19B
CMS 52B
JMS 21B
JMS 20B
TESTERS
JR 83
JR 85
JR 80
JMBR 44
JMBR 31
JR 67
JBR 6
CD 95% GCA
(Line)
CD 95% GCA
(Tester)
Days to
50%
flowering
Plant
height
(cm)
Panicle
length
(cm)
No. of
productive
tillers per
plant
1000 grain
weight (g)
No. of
grains per
panicle
Spikelet
fertility
(%)
Grain
yield per
plant (g)
-0.01
2.77**
-0.29
0.48
0.91**
-3.86**
-12.26**
3.79**
4.25**
2.35**
1.46*
0.39
-2.30**
-1.08**
1.09**
0.05
0.59*
1.64**
-0.29
0.20
0.41
-0.44
0.34
-0.22
-3.39**
0.07
0.39
1.38**
-0.11
1.66**
-24.75**
-20.32*
15.32
-8.67
48.39**
-9.96
-3.52
3.24
-3.04
-3.36
6.08*
0.60
-8.45**
-3.90**
4.42**
-0.42
8.52**
-0.16
-10.72**
3.27**
2.94**
-2.39**
0.27
3.44**
3.19**
0.50
-11.94**
9.70**
5.27**
-4.81**
-4.92**
2.48**
4.22**
1.06
1.64**
0.85*
1.38**
-0.33
0.00
-0.71*
0.45
0.57
-0.54
0.20
-0.21
0.61
-0.54
-0.38
0.86*
0.59
-1.47**
1.79**
0.30
1.72**
-0.82**
-3.10**
1.57**
0.39
-35.0**
15.91
27.50*
-28.75*
4.58
34.75**
-19.00*
15.97
4.68*
-5.57*
-0.90
-5.47*
1.90
1.70
3.66
3.63
-4.60**
3.23
-3.13*
-2.10*
-2.40*
3.98**
5.03**
1.81
0.54
1.15
0.62
0.63
0.42
17.25
3.92
1.95
Table 4 (Cont.)
Source
PARENTS
LINES
CMS 64B
JMS 11B
JMS 19B
CMS 52B
JMS 21B
JMS 20B
TESTERS
JR 83
JR 85
JR 80
JMBR 44
JMBR 31
JR 67
JBR 6
CD 95% GCA
(Line)
CD 95% GCA
(Tester)
Hulling
(%)
Milling (%)
Head rice
recovery
(%)
Kernel
length
(mm)
Kernel
breadth
(mm)
Kernel L/B
ratio
Paddy
length
(mm)
Paddy
breadth
(mm)
Paddy L/B
ratio
-3.52**
-0.29**
1.19**
0.45**
1.25**
0.91**
-0.71**
1.87**
-0.23
-1.53**
2.68**
-2.06**
-1.54**
3.46**
-4.30**
3.77**
6.14**
-7.53**
-0.51**
-0.06*
-0.09**
0.31**
-0.02
0.38**
-0.11**
-0.08*
-0.09**
0.05
0.17**
0.07*
-0.06
0.10*
0.12*
0.05
-0.29**
0.06
0.14
0.10
0.39**
0.09
-0.80**
0.06
-0.07**
0.00
-0.05*
0.03
0.08**
0.00
0.20**
0.04
0.25**
-0.04
-0.48**
0.015
1.74**
0.49**
-0.09
-0.51**
-0.62**
-0.27**
-0.72**
0.14
-0.26
1.24**
0.72**
0.10
-0.96**
-0.37
-0.46*
0.35
-1.56**
2.49**
-0.57*
0.92**
1.45**
-1.80**
-0.93**
0.39
-0.01
0.33**
0.17**
-0.07**
-0.11**
-0.37**
0.07*
0.04
-0.07*
-0.03
0.03
0.08*
0.04
0.08*
0.03
0.05
0.13**
0.26**
0.00
-0.18*
-0.14*
-0.06
-0.00
0.10
0.01
0.48**
0.43**
-0.01
-0.16
-0.62**
-0.13
0.19
-0.15**
0.01
-0.01
0.03
0.13**
0.03
-0.04*
0.03
0.27**
0.20*
0.21**
-0.06
-0.29**
-0.34**
0.01
0.10
0.15
0.37
0.42
0.04
0.05
0.10
0.21
0.04
0.11
* Significant at 5 per cent level ** Significant at 1 percent level
397
Int.J.Curr.Microbiol.App.Sci (2019) 8(6): 390-403
Table.5 Estimates of specific combining ability (sca) effects for yield and quality traits in rice
S.No.
1
2
3
4
5
6
7
8
9
10
11
12
13
14
15
16
17
18
19
20
21
22
23
24
25
26
27
28
29
30
31
32
33
34
35
36
37
38
39
40
41
42
43
Crosses
Days to
50%
flowering
Plant
height
(cm)
Panicle
length
(cm)
CMS 64A X JR 83
CMS 64A X JR 85
CMS 64A X JR 80
CMS 64A X JMBR 44
CMS 64A X JMBR 31
CMS 64A X JR 67
CMS 64A X JBR 6
JMS 11A X JR 83
JMS 11A X JR 85
JMS 11A X JR 80
JMS 11A X JMBR 44
JMS 11A X JMBR 31
JMS 11A X JR 67
JMS 11A X JBR 6
JMS 19A X JR 83
JMS 19A X JR 85
JMS 19A X JR 80
JMS 19A X JMBR 44
JMS 19A X JMBR 31
JMS 19A X JR 67
JMS 19A X JBR 6
CMS 52A X JR 83
CMS 52A X JR 85
CMS 52A X JR 80
CMS 52A X JMBR 44
CMS 52A X JMBR 31
CMS 52A X JR 67
CMS 52A X JBR 6
JMS 21A X JR 83
JMS 21A X JR 85
JMS 21A X JR 80
JMS 21A X JMBR 44
JMS 21A X JMBR 31
JMS 21A X JR 67
JMS 21A X JBR 6
JMS 20A X JR 83
JMS 20A X JR 85
JMS 20A X JR 80
JMS 20A X JMBR 44
JMS 20A X JMBR 31
JMS 20A X JR 67
JMS 20A X JBR 6
CD 95 % SCA
15.01**
-3.48**
4.84**
-5.82**
-9.98**
-4.65**
4.09**
-5.77**
9.22**
-1.94*
-3.60**
0.22
3.06**
-1.19
-2.70**
1.29
0.63
2.46**
-0.70
-0.86
-0.11
-3.48**
3.01**
-1.65*
1.17
2.51**
-1.15
-0.40
-3.91**
-0.91
-1.58*
2.25*
1.08
0.91
2.16*
0.86
-9.13**
-0.29
3.53**
6.86**
2.70**
-4.54**
1.34
4.54*
-4.10*
-11.27**
0.31
-7.17**
3.41*
14.27**
-3.81*
4.43*
10.27**
-6.74**
-4.82*
-0.54
1.22
-2.66
-1.61
0.61
-5.20**
11.31**
-5.00**
2.56
-2.56
2.38
7.31**
1.99
-5.88**
-0.20
-3.03*
-5.88**
-2.33
-0.40
5.58**
0.40
-2.31
4.95**
10.38**
1.23
-6.52**
4.05*
6.17**
4.65*
-19.97**
2.81
0.61
0.61
-1.41
1.00
-0.23
-0.61
0.01
-0.49
-1.39
2.27*
-1.11
-0.74
-1.42
2.90**
0.71
0.71
-0.11
-1.79*
0.76
-0.11
-0.18
-0.03
0.96
-2.77**
0.84
-0.28
1.02
0.26
0.01
-0.28
-0.01
-0.09
0.36
0.18
-0.18
-0.82
-0.62
2.04*
1.16
0.12
0.94
-2.82**
1.53
398
No. of
productive
tillers per
plant
0.54
1.79*
-786.00
-0.11
-1.45
0.38
0.36
1.04
-0.70
-0.78
-0.61
0.04
-1.11
2.13*
-0.16
0.08
1.50
-1.33
-0.66
-0.33
0.91
-1.31
-0.06
-0.64
0.02
1.19
0.52
0.27
-1.09
-0.34
0.57
0.23
0.40
-0.76
0.98
0.97
-0.77
0.14
1.81*
0.47
1.31
-3.94
1.56
1000grain
weight (g)
1.77*
-2.76**
-3.53**
1.86**
3.06**
-1.84**
1.45*
-1.80*
0.54
2.33**
0.37
-1.25*
-0.87
0.67
-0.33
0.35
-0.15
0.05
-2.04**
1.14*
0.97
-0.86
0.97
0.79
-0.18
0.96
0.73
-2.41**
0.40
0.87
-0.69
-1.65*
-1.39*
0.40
2.06**
0.82
0.02
1.26*
-0.44
0.66
0.43
-2.76**
1.03
No. of
grains
per
Panicle
34.50
-37.91
32.50
-27.25
-28.58
-5.75
32.50
48.07*
-31.84
-8.92
-16.67
-36.01
11.82
33.57
-14.07
55.01*
0.42
3.17
21.34
-45.82*
-20.07
-25.57
-1.98
-15.07
-7.32
43.34*
-41.32
47.92*
17.35
0.44
-10.14
3.10
11.27
62.60*
-84.64**
-60.28*
16.29
1.21
44.96*
-11.369
18.46
-9.28
42.25
Spikelet
fertility (%)
Grain
yield per
plant (g)
-7.55
-1.09
7.42
-3.39
-0.92
4.02
1.51
2.03
4.58
0.36
6.03
2.31
-5.53
-9.80*
-2.48
-4.17
1.35
8.77
-6.25
-3.15
5.93
0.13
-2.30
-9.92*
-10.85*
1.02
8.82
13.10*
1.14
5.50
1.52
-5.59
4.92
3.47
-10.98*
6.72
-2.51
-0.74
5.03
-1.09
-7.64
0.24
9.61
3.51
-4.11
1.25
0.01
-2.48
-2.86
4.68
5.37*
-9.66**
-0.89
-0.52
-0.62
-4.21
10.54**
4.24
0.81
10.57**
0.94
-6.75*
1.36
-11.18**
-6.51*
1.05
-3.97
-3.61
4.08
-2.69
11.65**
-4.25
15.51**
-8.52**
-10.15**
6.34*
5.96*
-4.88*
-2.36
-3.60
1.56
13.33**
-0.56
2.44
-10.80**
4.79
Int.J.Curr.Microbiol.App.Sci (2019) 8(6): 390-403
Table 5 (cont.)
S.No.
1
2
3
4
5
6
7
8
9
10
11
12
13
14
15
16
17
18
19
20
21
22
23
24
25
26
27
28
29
30
31
32
33
34
35
36
37
38
39
40
41
42
43
Crosses
Hulling
(%)
Milling
(%)
CMS 64A X JR 83
CMS 64A X JR 85
CMS 64A X JR 80
CMS 64A X JMBR 44
CMS 64A X JMBR 31
CMS 64A X JR 67
CMS 64A X JBR 6
JMS 11A X JR 83
JMS 11A X JR 85
JMS 11A X JR 80
JMS 11A X JMBR 44
JMS 11A X JMBR 31
JMS 11A X JR 67
JMS 11A X JBR 6
JMS 19A X JR 83
JMS 19A X JR 85
JMS 19A X JR 80
JMS 19A X JMBR 44
JMS 19A X JMBR 31
JMS 19A X JR 67
JMS 19A X JBR 6
CMS 52A X JR 83
CMS 52A X JR 85
CMS 52A X JR 80
CMS 52A X JMBR 44
CMS 52A X JMBR 31
CMS 52A X JR 67
CMS 52A X JBR 6
JMS 21A X JR 83
JMS 21A X JR 85
JMS 21A X JR 80
JMS 21A X JMBR 44
JMS 21A X JMBR 31
JMS 21A X JR 67
JMS 21A X JBR 6
JMS 20A X JR 83
JMS 20A X JR 85
JMS 20A X JR 80
JMS 20A X JMBR 44
JMS 20A X JMBR 31
JMS 20A X JR 67
JMS 20A X JBR 6
CD 95 % SCA
4.54**
2.13**
-1.12**
3.92**
-7.74**
0.00
-1.74**
-1.51**
-2.10**
1.44**
-0.80**
0.96**
-0.17
2.18**
-0.82**
0.66*
-1.14**
-1.44
1.04**
-0.87**
2.58**
-0.76**
0.10
0.79**
0.06
2.57**
0.97**
-3.74**
-0.03
-0.79**
0.19
-1.01**
1.44**
0.42*
-0.22
-1.40**
-0.00
-0.17
-0.71**
1.71**
-0.35
0.94**
0.38
7.41**
-0.03
-1.03*
3.69**
-11.91
1.12*
0.75
0.93*
-0.50
5.44**
-3.63**
-1.89**
-2.82**
2.48**
-0.20
0.87
-2.86**
-0.95*
-0.80
1.97**
1.98**
-10.56**
1.36*
1.57*
-0.97*
10.31**
1.57*
-3.28**
1.69**
-1.453*
1.00*
0.2
1.86**
-0.68
-2.70**
0.74
-0.22
-4.12**
1.59*
2.43**
-1.17*
0.75
0.92
Head rice
recovery
(%)
6.29**
-6.76**
5.15**
2.65**
-14.62**
-0.61
7.91**
3.54**
5.23**
1.35*
-2.09**
5.72**
-5.31**
-8.44**
-0.04
3.94**
-6.98**
-3.82**
-2.00**
6.22**
2.68**
-11.72**
-2.08**
0.10
3.71**
9.53**
6.65**
-6.20**
-2.34**
1.94**
1.83**
-0.40
1.75*
-3.98**
1.19*
4.28**
-2.27**
-1.45*
-0.04
-0.38
-2.96**
2.85**
1.03
* Significant at 5 per cent level ** Significant at 1 percent level
399
Kernel
length
(mm)
0.36**
0.01
-0.12*
-0.12*
0.06
-0.27**
0.07
0.41**
-0.13*
0.42**
-0.42**
0.01
-0.02
-0.27**
-0.35**
-0.10
-0.03
0.16*
-0.14*
0.41**
0.06
-0.06
0.18*
0.25**
0.20**
-0.55**
-0.19**
0.15**
-0.32**
-0.17*
-0.30**
0.04
0.23**
0.14*
0.39**
-0.03
0.21**
-0.21**
0.13*
0.37**
-0.06
-0.41**
0.10
Kernel
breadth
(mm)
0.01
-0.15*
0.06
0.01
0.11
-0.10
0.07
-0.05
0.05
0.08
-0.01
-0.07
0.00
-0.00
0.06
-0.07
-0.00
-0.00
0.08
0.07
-0.11
0.01
0.07
0.09
-0.10
-0.11
0.02
0.00
-0.00
0.15*
-0.22*
0.12
0.06
-0.09
-0.01
-0.00
-0.04
-0.02
-0.02
-0.08
0.10
0.08
0.14
Kernel
L/B
ratio
0.23
0.33*
-0.18
-0.12
-0.17
0.01
-0.09
0.35*
-0.20
0.07
-0.19
0.13
-0.02
-0.14
-0.33*
0.09
-0.01
0.05
-0.24
0.11
0.33*
-0.05
-0.05
-0.01
0.28*
-0.08
-0.13
0.06
-0.18
-0.35*
0.20
-0.11
0.03
0.22
0.20
-0.01
0.18
-0.06
0.10
0.33*
-0.19
-0.35*
0.26
Paddy
length
(mm)
0.95**
0.58*
-0.01
-0.56*
-1.06**
0.10
0.00
0.29
-1.07**
0.07
0.42
-0.42
-0.05
0.74*
0.51
-0.15
-1.20**
-0.15
0.49
0.35
0.16
-1.49**
0.34
0.89*
0.24
0.49
0.35
-0.84*
0.30
-0.36
-0.26
-0.36
-0.11
0.66*
0.15
-0.56*
0.66*
0.51
0.41
0.61*
-1.42**
-0.21
0.52
Paddy
breadth
(mm)
0.19**
-0.17*
-0.08
-0.08
-0.08
0.20**
0.03
0.09
0.04
0.17*
0.42**
-0.17*
-0.18**
-0.19**
-0.03
0.00
-0.16*
-0.01
0.08
-0.02
0.15*
-0.11
0.21**
-0.05
0.09
0.09
-0.11*
-0.12*
-0.06
0.06
0.04
-0.35**
0.04
0.13*
0.12*
0.11*
-0.15*
0.08
-0.067
0.03
-0.025
0.00
0.10
Paddy
L/B
ratio
0.05
0.61**
0.16
-0.11
-0.35*
-0.30*
-0.08
0.31*
-0.58**
-0.29*
-0.48*
0.07
0.25
0.71**
0.35*
-0.09
-0.22
-0.05
0.05
0.17
-0.22
-0.47*
-0.22
0.49**
-0.05
0.07
0.34*
-0.15
0.21
-0.28*
-0.209
0.39*
-0.07
0.09
-0.13
-0.45*
0.57**
0.07
0.29*
0.21
-0.57**
-0.11
0.28
Int.J.Curr.Microbiol.App.Sci (2019) 8(6): 390-403
Table.6 Screening of rice entries against panicle mite and their categorization
S.No
1
2
3
4
5
6
7
8
9
10
11
12
13
14
15
16
17
18
19
20
21
22
23
24
25
26
27
28
29
30
31
32
33
34
35
S.No
36
37
38
39
40
41
42
43
44
45
46
47
48
49
50
51
52
53
54
55
C1
C2
Name of entry
Scale I
Scale II
Scale III
Category
CMS 64B
1
5
7
Moderately Resistant
JMS 11B
1
5
7
Moderately Resistant
JMS 19B
3
3
5
ModeratelyResistant
CMS 52B
3
7
7
Susceptible
JMS 21B
3
3
9
Susceptible
JMS 20B
1
3
3
Resistant
JR 83
1
5
7
Moderately Resistant
JR 85
3
3
3
Moderately Resistant
JR 80
1
3
3
Resistant
JMBR 44
3
3
9
Susceptible
JMBR 31
3
3
9
Susceptible
JR 67
3
7
7
Susceptible
JBR 6
3
9
7
Susceptible
CMS 64A X JR 83
3
5
9
Susceptible
CMS 64A X JR 85
3
7
9
Susceptible
CMS 64A X JR 80
3
3
9
Susceptible
CMS 64A X JMBR 44
3
3
9
Susceptible
CMS 64A X JMBR 31
3
3
9
Susceptible
CMS 64A X JR 67
3
5
9
Susceptible
CMS 64A X JBR 6
3
9
7
Susceptible
JMS 11A X JR 83
3
3
5
Moderately Resistant
JMS 11A X JR 85
3
9
9
Susceptible
JMS 11A X JR 80
1
3
1
Resistant
JMS 11A X JMBR 44
3
3
5
Moderately Resistant
JMS 11A X JMBR 31
1
3
3
Resistant
JMS 11A X JR 67
3
3
5
Moderately Resistant
JMS 11A X JBR 6
1
5
7
Moderately Resistant
JMS 19A X JR 83
3
3
9
Susceptible
JMS 19A X JR 85
3
3
5
Moderately Resistant
JMS 19A X JR 80
1
0
1
Resistant
JMS 19A X JMBR 44
1
3
3
Resistant
JMS 19A X JMBR 31
3
3
3
Moderately Resistant
JMS 19A X JR 67
1
1
0
Resistant
JMS 19A X JBR 6
3
3
5
Susceptible
CMS 52A X JR 83
1
1
3
Resistant
Name of entry
Scale I
Scale II
Scale III
Category
CMS 52A X JR 85
3
3
9
Susceptible
CMS 52A X JR 80
1
3
3
Resistant
CMS 52A X JMBR 44
3
3
5
Moderately Resistant
CMS 52A X JMBR 31
1
3
3
Resistant
CMS 52A X JR 67
1
1
3
Resistant
CMS 52A X JBR 6
3
7
7
Susceptible
JMS 21A X JR 83
3
3
5
Moderately Resistant
JMS 21A X JR 85
3
3
9
Susceptible
JMS 21A X JR 80
1
1
3
Resistant
JMS 21A X JMBR 44
3
3
9
Susceptible
JMS 21A X JMBR 31
1
1
3
Resistant
JMS 21A X JR 67
1
1
3
Resistant
JMS 21A X JBR 6
3
5
9
Susceptible
JMS 20A X JR 83
3
3
5
Moderately Resistant
JMS 20A X JR 85
1
1
3
Resistant
JMS 20A X JR 80
3
3
5
Moderately Resistant
JMS 20A X JMBR 44
3
3
9
Susceptible
JMS 20A X JMBR 31
1
3
3
Resistant
JMS 20A X JR 67
1
3
3
Resistant
JMS 20A X JBR 6
3
5
3
Moderately Resistant
BPT 5204
7
7
9
Susceptible
JGL 3855
7
7
7
Susceptible
Scale 1:Based on damage symptom of panicle mite on leaf midrib; Scale 2:Based on per cent grain discolouration
Scale 3:Based on damage symptoms on leaf sheath; C1: check variety 1and C2: check variety 2
400
Int.J.Curr.Microbiol.App.Sci (2019) 8(6): 390-403
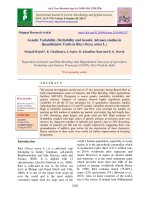
Fig.1 Rice panicle mite damage symptom on Rice panicle mite damage symptoms on grains
leaf sheath
Fig.2 Rice panicle mite damage symptoms on leaf midrib
The incidence of panicle mite was observed to
be relatively very low in rice entries with well
exerted panicles (2 - 4 cm above the boot leaf)
in comparison to incompletely exerted
panicles. A relation was also observed
between duration of the crop and incidence of
panicle mite indicating that some genotypes
escaped from the incidence. Overall, the
panicle mite incidence was observed to be
more in early duration cultures than late
duration cultures with few exceptions.
However, these results need to be investigated
across locations. The results obtained in the
present study were compared with those
reported by the earlier workers. Some such
reports are as follows:
Rao et al., (2000) while working on rice
sheath mite reported the cultivars MTU-1001,
MTU-2067, MTU-2077, MTU 7029, BPT5204 andPLA-1000 being most susceptible to
rice sheath mite. According to Lee (1980), the
cultivars Kaohsiung Selection No. 1,
Hsinchu-57, Chinung-shenyu-19, Nanshenyu-42 and Kaohsiung-shen-yu-194 were the
most resistant in Taiwan. Chandrasena et al.,
(2016) while conducting studies on rice
panicle mite, reported Cyperusrotundus,
Leptochloachinensis, Echinocloacrus-galli,
Paspalumscrobiculatum, Imperatacylindrica
etc. as the alternate hosts of this mite. Thuy et
al., (2012) evaluated the effect of panicle rice
mite (PRM) population on the agronomic
401
Int.J.Curr.Microbiol.App.Sci (2019) 8(6): 390-403
characters of dominant rice cultivar IR 50404
by artificial inoculation and reported that the
periods of PRM introduction affected the
yield loss but these effects were only
significantly smaller when the initial number
of mites released was small (1-2 mites per
tiller). Mukhopadhyay et al., (2017)
performed varietal screening in relation to
morphological characters of leaf sheath in
respect of 29 rice cultivars reported variety
IR-72 and JKRH-2082 were best and length
of flag leaf lamina was not affected due to
infestation of Steneotarsonemus spinki and
regarding chaffy grain, among 10 late paddy
cultivars tested, the variety Mandira was the
best among all showing the minimum % of
chaffy grain.
tarsonemid mite, Steneotarsonemus
spinki (Acari: Tarsonemidae), and its
damage on rice in Korea. Korean
Journal of Applied Entomology.
38(2): 157–164.
Gaurav Dharwal, Verma, O.P., and Verma,
G.P. 2017.Combining ability analysis
for grain yield and other associated
traits in rice. International Journal of
Pure and Applied Bioscience.5 (2):96100.
Ghara, A.G., Nematzadeh, G., Bagheri, N.,
Ebrahimi, A., and Oladi, M. 2012.
Evaluation of general and specific
combining ability in parental lines of
hybrid rice. IJRR.2 (4): 455-460.
Ghosh, S. K., Rao, J., and Prakash, A. 1997.
Effect
of
tarsonemid
mites,
Steneotarsonemus spinki Smiley on
the growth of rice plants. Journal of
Applied Zoological Research.8(2):
123-124.
Hasan, M.J., Kulsum, U.K., Lipi, L.F., and
Shamsuddin, A.K.M. 2013.Combining
ability studies for developing new rice
hybrids in Bangladesh. Bangladesh
Journal of Botany.42(2): 215-222.
IRRI,
2017.
:8080/
wrsv3/entrypoint.htm.
Kenga, R., Albani, S.O., and Gupta, S.C.
2004. Combining ability studies in
tropical sorghum [Sorghum bicolor L.
(Meonch)]. Field Crop Research.88:
251-260.
Lee, H.C. 1980. Screening for varietal
resistance to sterility of rice caused by
tarsonemid mite. Plant Protection
Bulletin. Taiwan. 22: 91-100.
Lo, K. C., and Ho, C. C. 1977. Preliminary
studies on rice tarsonemid mite
Steneotarsonemus
spinki
smiley
(Acarina: Tarsonemidae). Natural
Sciences Council Monthly.5(4): 274284.
Marilia, C.F., Servio, T.C., Vatter, O.R.,
Clibas, V., and Siu, T.M. 2001.
It is concluded, based on gca and sca effects,
some lines and crosses have been identified
with resistance to panicle mite as well as
other desirable yield related characters. Based
on the screening studies, promising hybrids
viz., JMS 11A X JR 80, JMS 11A X JMBR
31, JMS 19A X JR 80, JMS 19A X JMBR 44,
JMS 19A X JR 67, CMS 52A X JR 83, CMS
52A X JR 80, CMS 52A X JMBR 31, CMS
52A X JR 67, JMS 21A X JR 80, JMS 21A X
JMBR 31, JMS 21A X JR 67, JMS 20A X JR
85, JMS 20A X JMBR 31 and JMS 20A X JR
67 or parental lines viz., JMS 20B and JR
80can be used in future breeding programmes
to develop rice hybrids with less panicle mite
damage as well as grain discolouration. The
major criterion for panicle mite resistance was
observed to be panicle exertion and crop
duration. Complementary studies should be
conducted to explain how much of the
observed yield reduction was exclusively due
to the rice panicle mite and how much to
other causes, as for example the different
prevailing climatic and disease conditions.
References
Cho Myoung-Rae. 1999. A new record of
402
Int.J.Curr.Microbiol.App.Sci (2019) 8(6): 390-403
Combining ability for nodulation in
common bean (Phaseolus vulgaris L.)
genotype from Andean and middle
American gene pools. Euphytica. 118:
265-270.
Muhammad, R., Cheema, A.A., and
Muhammad, A. 2007. Line X tester
analysis in Basmati rice. Pakistan
Journal of Botany. 39(6): 2035-2042.
Mukhopadhyay, S., Kinkar, S., and Gupta,
S.K. 2017. Varietal screening of rice
Panicle
mite
in
relation
to
morphological characters of leaf
sheath and population in 5 major rice
growing districts of West Bengal.
Biological Forum – An International
Journal. 9(1): 162-168.
Nadali, B., and Nadali, B.J. 2010. Heterosis
and combining ability analysis for
yield and yield related traits in hybrid
rice. I J B. 2 (2): 222-231.
Rao, P.R.M., Bhavani, T.R.M., Rao, T.R.M.,
and Reddy, P.R.2000. Spikelet
sterility/ grain discolouration in
Andhra Pradesh, India. International
Rice Research Notes. 25, 40. Notes
from the fields.
Rumanti, I.A., Purwoko, B.S., Dewi, I.S.,
Aswidinnoor, H., and Widyastuti, Y.
2017. Combining ability for yield and
agronomic traits in hybrid rice derived
from wild abortive, gambiaca and
kalinga cytoplasmic male sterile lines.
SABRAO J BREED GENET. 49(1):
69-76.
Sarker, U., Biswas, P.S., Prasad, B., and
Khaleque, M.M.A. 2002. Heterosis
and genetic analysis in rice hybrid.
Pakistan Journal of Biological
Science. 5(1): 1-5.
Savita Bhatti., Pandey, D.P., and Dhirendra
Singh.2015. Combining ability and
heterosis for yield and its component
traits in rice (Oryza sativa L.). EJPB.
6(1): 12-18.
Shukla, S.K., and Pandey, M.P.2008.
Combining ability and heterosis over
environments for yield and yield
components in two line hybrids
involving thermosensitive genic male
sterile lines in rice (Oryza sativa L.).
Plant Breeding.127: 28-32.
SriKrishna Latha., Deepak Sharma., Gulzar.,
and Sanghera, S. 2013. Combining
ability and heterosis for grain yield
and its component traits in rice (Oryza
sativa L.). Not Sci Biol. 5(1): 90-97.
Sogawa K. 1977. Occurrence of the rice
tarsonenmid
mite
at
IRRI.
International
Rice
Research
Newsletter. 2(5): 17.
Thuy, L.D., Tung, N.D., and Dinh, N.V.
2012. Population intensity of panicle
rice mite Steneotarsonemus spinki
smiley
(acari:
tarsonemidae)
influencing rice yield in Vietnam.
Journal of International Society for
Southeast
Asian
Agricultural
Sciences. 18(2): 62-69.
How to cite this article:
Sameena Begum, B. Srinivas, V. Ram Reddy and ArunaKumari, Ch. 2019. Studies on
Combining Ability and Panicle Mite Resistance in Hybrid Rice (Oryza sativa L.).
Int.J.Curr.Microbiol.App.Sci. 8(06): 390-403. doi: />
403