The trend analysis of major food grains in India
Bạn đang xem bản rút gọn của tài liệu. Xem và tải ngay bản đầy đủ của tài liệu tại đây (278.44 KB, 8 trang )
Int.J.Curr.Microbiol.App.Sci (2019) 8(3): 353-360
International Journal of Current Microbiology and Applied Sciences
ISSN: 2319-7706 Volume 8 Number 03 (2019)
Journal homepage:
Original Research Article
/>
The Trend Analysis of Major Food Grains in India
S.V. Halawar*
Karnatak Arts College, Dharwad, India
*Corresponding author
ABSTRACT
Keywords
Food grains, Time
series, Trend
analysis, ANOVA,
Correlation
Article Info
Accepted:
04 February 2019
Available Online:
10 March 2019
The present study attempt to provide credible estimates of future production
of food grains (rice, wheat, coarse cereals, sugar cane and pulses) by testing
differences in the production of different food grains, trend analysis and
Correlation coefficient. It is estimated the correlation between the
production of rice and wheat because of their major importance in India as
an everyday food.
On the supply side, inspired by the public
investment
in
irrigation
and
rural
infrastructure and rapid spread of highproductive varieties of rice and wheat,
together with enhanced crop production
practices, India has achieved remarkable
growth in food grain production. Per capita
annual production of food grains increased
from 183 kg during early-1970s to 207 kg by
mid-1990s, even though country’s population
increased more than 50 percent during this era
(Economics Survey, 2007). After mid-1990s,
per capita food grain production started
declining due to deceleration in the total
factor productivity (TFP) growth (Kumar et
al., 2004; Kumar and Mittal, 2006). It is a
subject of concern for Indian food-security.
Introduction
Constant economic growth, increasing
population and varying lifestyles are causing
significant changes in Indian food basket,
away from staple food grains towards highvalue horticultural and animal products
(Kumar et al., 2007; Mittal, 2007). While per
capita consumption of food grains has
declined, their total consumption has
increased due to growing population. Also,
varies in the dietary pattern towards animal
products have led to an increased demand of
food grains as feed. Nonetheless, food grains
mainly rice and wheat, continue to be the
main pillars of India’s food security
(Praduman Kumar et al., 2009).
353
Int.J.Curr.Microbiol.App.Sci (2019) 8(3): 353-360
This varying scenario of consumption and
production will have a considerable influence
on the demand and supply prospects of food.
Indonesia, and Bangladesh mainly imported
cereals from India during 2013–14.
Wheat
Food grain production
The area and production under wheat has
improved from 27.99 million hectares in
2006–07 to 29.86 million hectares in 2011–12
and from 75.81 million tonnes in 2006–07 to
an all-time record high of 94.88 million
tonnes in 2011–12, respectively. U. P.
accounts for the maximum area under
cultivation and production, whereas Punjab
and Haryana are produce higher productivity
with minimum landholding under wheat
cultivation (Khatkar et al., 2016).
India is constantly facing pressure on the
demand side due to stable population growth,
limited land availability, and a number of
other production deterrents, which might also
come into view as obstacles for the
contribution of food grains. Indian
government policies and planning has always
given considerable importance to production
of food grains due to which India has been
achieving the continued growth despite many
constraints. During the last decade (2000–01
to 2010–11), the areas under cereals, pulses,
and oilseeds have increased by about 5.7, 6.0,
and 4.0 million hectares, respectively, and the
area under coarse cereals has declined by 2.6
million hectares. The area under wheat
cultivation has accelerated extensively in
comparison to other cereals and millets.
However, a moderate deceleration in total
grain cultivated area in association to pulses
cultivated area was witnessed during the years
of 2005 to 2011. The highest food grain
production of 259.32 million tonnes was
recorded in 2011–12. Out of the total food
grains production, cereals accounted for
242.23 million tonnes and pulses 17.09
million tonnes. Production of rice and wheat
was recorded at 105.3 and 94.9 million
tonnes, respectively (Khatkar et al., 2016).
The increase in yield of wheat has been
observed in the states of Haryana, Punjab,
Madhya Pradesh, and Uttar Pradesh. The
regular national productivity is about 2.9
tonnes per hectare. The major wheatproducing states are Uttar Pradesh, Punjab,
Haryana, Madhya Pradesh, Maharashtra,
Gujarat, Rajasthan, Bihar, Karnataka, West
Bengal, Himachal Pradesh, Uttaranchal, and
Jammu and Kashmir. These states contribute
about 99.5% of total wheat production in the
country. The remaining states, namely
Jharkhand, Assam, Delhi, Chhattisgarh, and
other northeastern states, contribute only
about 0.5% of the total wheat production in
the country. Among food grains, wheat in
India stands next to rice both in area and
production (Khatkar et al., 2016).
It was estimated that the agriculture sector in
India is likely to grow by 5.2–5.7% in 2013–
14. India is one of the largest producers of
cereal as well as the largest exporter of cereal
products worldwide. India’s export of cereals
for the period of 2013–14 stood at Rs.
63452.09 crores. Rice occupies the most
considerable share in India’s total cereals
export with 64.40% during this period.
Countries such as Iran, Saudi Arabia, UAE,
Rice
India is the 2nd largest producer and consumer
of rice in the world and accounts for 22.3% of
universal production. Several programs run
by the government such as National Food
Security Mission (NFSM) launched during
2007–08 and Bringing Green Revolution in
Eastern India (BGREI) during 2010–11
increased production and productivity of rice
354
Int.J.Curr.Microbiol.App.Sci (2019) 8(3): 353-360
from 96.7 million tonnes and 2202 kg ha-1 in
2007–08 to 105.31 million tonnes and 2393
kg ha-1, respectively, in 2011–12. The NFSM
is presently under implementation in 482
districts of 19 states of the country with a
view to enhance the production of rice, wheat,
and pulses through area development and
productivity enhancement, restoring soil
fertility
and
productivity,
creating
employment opportunities, and enhancing
farm level economy to restore confidence of
farmers. The basic strategy of the mission is
to promote and extend improved technologies
that is, seed, soil amendments, micronutrients,
farm machinery, integrated pest management,
and resource conservation technologies, along
with capacity building of farmers with
efficient monitoring and better management
in the high-potential districts to bridge the
yield gaps (Khatkar et al., 2016).
Pulses
Pulses complement the staple cereal in the
diet as a gifted resource of proteins, essential
vitamins, amino acids, and minerals among
the vegetarians in India. They contain 22–
24% protein, which is almost twice the
protein in wheat and three times that of rice.
India is the leading producer in the world with
25% of the total share and is also the largest
receiver and consumer in the world. Most of
the pulses grown in India include Bengal
gram or gram, lentil, red gram, black gram,
green gram, moth bean, cowpea, horse gram,
and faba bean. Most popular among these are
Bengal gram, red gram, black gram, lentil,
and green gram. Maharashtra, Madhya
Pradesh, Uttar Pradesh,
Karnataka, Andhra Pradesh, and Rajasthan
are the major states growing pulses in India.
These six states supply 70% of total pulse
production and area. The country has
achieved a record pulses production of 19.57
million tonnes in 2013–14 compared to 18.34
million tonnes in the year 2012–13.
Production of all the pulses, as a whole has
been increasing year by year except for a
decline in 2011–12. The production of black
gram only has been estimated to decline from
1.9 million tonnes in 2012–13 to 1.5 million
tonnes in 2013–14.
Coarse cereals
Crops like sorghum, ragi, millets, and other
small millets (kudo, sanwa, kutiki, and
foxtail) termed as coarse cereals have been
the primary components of the food bag of
rural India. Rain-fed regions of India like
Karnataka, Tamil Nadu, Maharashtra,
Madhya Pradesh, Gujarat, and Rajasthan are
best suited for coarse cereal crops, and coarse
cereals are therefore cultivated predominantly
in these areas. A downturn has been
witnessed in the area covered under coarse
cereals cultivation from 29.03 million
hectares in 2004–05 to 26.42 million hectares
in 2011–12. Significantly increases in the
production of coarse cereals have been
witnessed from 1153 kg ha-1 in 2004–05 to
1591 kg ha-1 in 2011–12. Production of coarse
cereals in 2004–05 was 33.46 million tonnes,
which increased to a maximal level of 43.40
million tonnes in 2010–11 but decreased
slightly to 42.04 million tonnes in 2011–12
mainly because of a shift in area of cultivation
to other competing crops.
Consumption of food grains
If we observe the rate of growth of population
and food grains production for last five
decades in India, it has been observed that the
population growth rate has seen a downfall
from 2.24% to 1.03%. The overall rate of
production of food grains has also declined, it
is raised only during the period from 1981–
91. During 2004–05 total cereal consumption
showed a rise of about 100 g per person per
month in rural areas and a fall of 350 g per
person per month in urban areas. The per
355
Int.J.Curr.Microbiol.App.Sci (2019) 8(3): 353-360
capita consumption trend of grains such as
pearl millet, sorghum, and maize has been
higher in the rural sector as compared to a
decreasing trend in consumption of major
grains like rice and wheat. The cereals other
than rice and wheat contributed 1 kg per
person per month in rural India and 0.8 kg per
person per month in urban India in 2011–12.
Post Hoc tests
Homogeneous subsets
Plots
The analysis of variance is used for testing
significant difference between group of
means. It is observed from the ANOVA table
(Table 2) that the significance value is 0.000
(i.e., p = 0.000), which is less than 0.05. That
is the factors means are differing at 5% level
of significance and null hypothesis (H0) is
rejected. To verify, which of the specific
groups are differed significantly it is tested
the Tukey post hoc test, here we obtained the
Multiple Comparisons table (Table 3) which
contains the p values of each pair and
homogeneous groups of non significant
variables.
Materials and Methods
In the present paper secondary data is
collected from agricultural situation in India
February 2018(Agricultural situation in India
February 2018). The data related to
production of major food grains, pulses,
oilseeds and cotton. To study the behavior of
the data we used the statistical techniques like
trend analysis, Analysis of variance and line
charts.
It is observed from the above given
homogeneous subsets, first, second, third and
fourth subsets contains the factor total pulses,
total coarse cereals, wheat and rice with P
value 1.000 respectively, this shows that the
factors are significantly differing from all
other factors, so the yield of every food grains
is totally varied from factor to factor. From
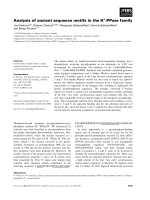
the Means plot it is observed the same
scenario as in the homogeneous groups. It is
clear from the means plot that total pulse
production is minimum and rice production is
maximum. This analysis tells that there is
significant difference between the food grains
(Table 4).
Results and Discussion
Data analysis
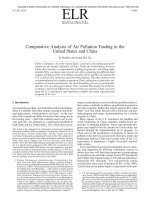
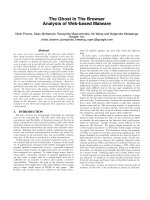
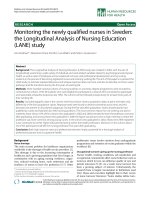
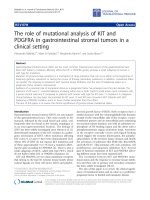
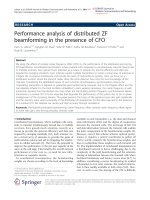
From Figure 1, 2 and 3 trend analysis of
major food grains, sugar cane and crops, it is
observed the trend is declined i.e. the
production of food grains, sugar cane and
crops are decreasing year by year. We can
observe in case of food grains, total pulses
and oilseeds the maximum production during
the year 2016-17 and again it is reduced in
2017-18 (Fig. 4).
In case of sugarcane production is constant
but during the year 2016-17 it is declined to
310 million tones later again it is recovered in
2017-18. From table 1 the predicted trend
values are declining in all the cases (Food
grains, Pulses, Oilseeds and sugarcane).
Karl Pearson correlation coefficient is found
to be positive, it indicates that the rice and
wheat are production having same degree
change in the year wise production and they
are varying in same direction. But as per the P
value they are independent. This result
indicates even though rice and wheat are daily
food of Indians but there production is not in
same quantity (Table 5).
H0: There is no difference in the production of
different food grains.
H1: There is a difference in the production of
different food grains.
356
Int.J.Curr.Microbiol.App.Sci (2019) 8(3): 353-360
Table.1 Production of major food grains year wise
Year
2012-13
2013-14
2014-15
2015-16
2016-17
2017-18
2018-19
2019-20
Total
Rice
Wheat Total
Total
Total
Sugarcane Cotton
Food
Coarse
Pulses Oilseeds
grains
Cereals
257.1 105.2
93.5
40
18.3
30.9
341.2
34.2
265 106.7
95.9
43.3
19.3
32.8
352.1
35.9
252 105.5
86.5
42.9
17.2
27.5
356.3
37.8
251.6 104.4
92.3
38.5
16.4
25.3
348.4
30
275.7 110.2
98.4
44.2
23
32.1
306.7
33.1
228.02
94.5 93.32
31.5
8.7
20.7
337.7
32.3
*
243.56
100* 94.55*
35.65* 13.44*
22.68*
323.9*
31.36*
240.32* 98.74* 94.91*
34.39* 12.38*
21.1*
319.3*
30.64*
Table.2
Between
Groups
Within Groups
Total
Sum of
Squares
31563.734
442.385
32006.119
ANOVA
df
3
20
23
Mean
Square
10521.245
F
Sig.
475.660
.000
22.119
Table.3 Tukey HSD
(I) Gpvr
Rice
(J) Gpvr
Multiple Comparisons
Mean
Std. Error
Difference
(I-J)
11.09667*
2.71534
64.35000*
2.71534
Wheat
Total coarse
cereals
Total pulses
87.26667*
Wheat
Rice
-11.09667*
Total coarse
53.25333*
cereals
Total pulses
76.17000*
Total coarse
Rice
-64.35000*
cereals
Wheat
-53.25333*
Total pulses
22.91667*
Total pulses
Rice
-87.26667*
Wheat
-76.17000*
Total coarse
-22.91667*
cereals
*. The mean difference is significant at the 0.05 level.
357
Sig.
.003
.000
95% Confidence Interval
Lower
Upper Bound
Bound
3.4966
18.6967
56.7499
71.9501
2.71534
2.71534
2.71534
.000
.003
.000
79.6666
-18.6967
45.6533
94.8667
-3.4966
60.8534
2.71534
2.71534
2.71534
2.71534
2.71534
2.71534
2.71534
.000
.000
.000
.000
.000
.000
.000
68.5699
-71.9501
-60.8534
15.3166
-94.8667
-83.7701
-30.5167
83.7701
-56.7499
-45.6533
30.5167
-79.6666
-68.5699
-15.3166
Int.J.Curr.Microbiol.App.Sci (2019) 8(3): 353-360
Table.4 Tukey HSD
Gpvr
N
Subset for alpha = 0.05
1
Total pulses
6
Total coarse cereals
6
Wheat
6
Rice
6
Sig.
2
3
17.1500
40.0667
93.3200
104.4167
1.000
1.000
1.000
Means for groups in homogeneous subsets are displayed.
a. Uses Harmonic Mean Sample Size = 6.000.
Table.5 Correlation between Rice and Wheat
Rice
Pearson Correlation
Rice
Wheat
1
.266
Sig. (2-tailed)
.610
N
Wheat
4
6
6
Pearson Correlation
.266
1
Sig. (2-tailed)
.610
N
6
Fig.1 Trends of Major food grains
358
6
1.000
Int.J.Curr.Microbiol.App.Sci (2019) 8(3): 353-360
Fig.2 Year wise production and trend analysis of sugar cane
Fig.3 Year wise production of major crops of India and trend analysis
Fig.4 Means
359
Int.J.Curr.Microbiol.App.Sci (2019) 8(3): 353-360
Khatkar, BS, N Chaudhary, and Dangi, G. J.
(2016) Production and Consumption of
Grains: India University of Science and
Technology, Hisar, India, vol. 1, pp. 367373.
Kumar, Praduman and Mittal, Surabhi (2006)
Agricultural productivity trend in India:
Sustainability
Issues.
Agricultural
Economics
Research
Review,
19
(Conference No.): 71-88.
Kumar, Praduman, Kumar, Anjani and Mittal,
Surabhi (2004) Total factor productivity
of crop sector in the Indo-Gangetic Plain
of India: Sustainability issues revisted.
Indian Economic Review, 34(1): 169-201.
Kumar, Praduman, Mruthyunjaya and Dey,
Madan M. (2007) Long-term changes in
food basket and nutrition in India,
Economic
and
Political
Weekly,
(September 1): 3567-3572.
Mittal, Surabhi (2007) What affect changes in
cereal consumption. Economic and
Political weekly
(February): 444 447.
It is concluded in this paper, we have studied
about production of major food grains like
rice, wheat, pulses, oilseeds and sugar cane in
India. Here it is derived the results by using
the statistical techniques like trend analysis
for prediction future production and analysis
of variance for testing difference in the
production of different food grains and we
also observed the correlation between rice and
wheat it is found slightly positive correlation
between them and these two food grains are
non-significance in production even though
rice and wheat are daily routine food of
Indians but there production is not in same
quantity.
References
Agricultural situation in India February 2018, The
controller of publication, Civil lines
Dehli.pp.1-66
Government of India (2007) Economic Survey,
2006-07, Ministry of Finance, New Delhi.
How to cite this article:
Halawar, S.V. 2019. The Trend Analysis of Major Food Grains in India.
Int.J.Curr.Microbiol.App.Sci. 8(03): 353-360. doi: />
360