Remote sensing and GIS of agricultural drought monitoring in the north central region, Vietnam
Bạn đang xem bản rút gọn của tài liệu. Xem và tải ngay bản đầy đủ của tài liệu tại đây (1.48 MB, 10 trang )
REMOTE SENSING AND GIS OF AGRICULTURAL DROUGHT
MONITORING IN THE NORTH CENTRAL REGION, VIETNAM
Nguyen Thi Thu Thuy
Nguyen Thi Bich Hanh
Faculty of Environmental Sciences and Earth, Thai Nguyen
University of Scienses, Thai Nguyen, Vietnam
Abstract
Agricultural drought is a natural hazard that characterized by shortage of water
supply. In recent decades, the scientists usually deal with phrases Agricultural drought
monitoring as an essential component of drought risk management and using remote
sensing (RS) and Geography Information System (GIS) based on drought indicators,
proposed and widely used in the field of drought monitoring. This paper presents some
agricultural drought indicators to generate a suite of drought levels at monthly, seasonal,
and annual time scales for the North Central regions, Vietnam. MODIS satellite image
data and threshold drought lever were classified according to the measurement data
survey that regarding the law of drought in Vietnam. Based on calculating NDVI index,
our research built maps of VCI, LSWI, VTCI indicators. All the data sets are being
produced and updated in near-real time to provide information about the onset,
progression, extent, and intensity of drought conditions at research region.
Keywords: Agricultural drought, indicators, MODIS satelite image, North Central Region.
1. Introduction
Drought is not only one of common disasters in Vietnam, ranking third place in
disasters, only after flood and storm, but also experienced the longest and strongest El
Niño-induced drought and saline water intrusion. According to the collected statistics,
during the past 50 years, droughts have taken place in 40 years in different extents and
locations. Drought also affected more than 18 provinces in the three regions which
produce key agricultural export and food security crops such as rice, coffee, pepper,
fruits and aquaculture. Particular vulnerable groups such as the poor, women headed
households, landless, people with disabilities, children and the elderly are more heavily
impacted than others. [4]
According to the Vietnam national hydro-meteorological service, in the last 50
years, Vietnam has more than 38 years that appearing drought (make up 76%) with
difference drought level and drought regions, affecting seriously the development of
economic - society. Vietnam ranked 13/16 of top leading country suffered a strong impact
318
of the phenomenon of global climate change in the next 30 years (Verisk Maplecroft
10/2010) . In the context of current climate change, Vietnam will be forecasted to have a
heavy impact of rising sea levels, increasing temperatures and changing seasonal climate
regime increasingly deeper. This means that with the increase of drought (both in
frequency and quantity) in the next decade.
As regard the drought in the North central region, it not only seemly occur on whole
area, but also appears during both winter-spring and summer- autumn crop seasons.
Typically drought occurred on the large regions, if using the traditional methods
to assess its serve weather condition, it will be very difficult. Therefore, database from
Earth observation satellite (EOS) was very helpful and deserve attention in this
condition. NOAA and MODIS data can suply lots of informations about The Earth
surface through difference spectral bands as spectrum band, near infrared and thermal
infrared. NDVI index combines informations in red spectral bands and near-infrared
bands have been used effectively in health status monitoring vegetation cover. Along to
the development and increasingly modern remote sensing technology whole the world
has been the application of remote sensing to monitor and forecast drought and yielded
practical results.
2. Methods
Drought indices are quantitative measures that characterize drought levels by
assimilating data from one or several variables indicators such as precipitation and
evapotranspiration into a single numerical value. Such an index is more readily useable
than raw indicator data. The nature of drought indices reflects different events and
conditions; they can reflect the climate dryness anomalies (mainly based on precipitation)
or correspond to delayed agricultural and hydrological impacts such as soil moisture loss
or lowered reservoir levels.
In addition, this research focus on some of these models allow this below:
Method of the relationship between vegetation indices: this method almost use
specific reflex of crops and land surface at wavelength near-infrared spectrum to determine
the soil moisture
Method of infrared heat: This method uses thermal emission reflex of the surface on
the basis of the thermal inertia and lack of land surface water index to assess drought of
cover land.
The method of using high frequency communication and sensing
3. Results
3.1. Overview of Agricultural Drought in the North Central Region
During the summer monsoon here have many hot dry west winds are harsh as
Dong Ha, Tuong Duong. The strong development of hot weather would falsify
evolution-humid rainy season in the North Central considering the general situation of
the Northern climate area.
319
The degree of hot dry here tied to the mechanism of the southwest monsoon. Laos
wind is very dry and hot. July is the most popular month of the southwest with the highest
temperature may be over 42oC. In this area, the rainfall from the first season up to June and
July not only did not increase as a general rule, but also it is reduced, creating a local
phenomenon characteristic term. Rain season began to increase from August and reached
its maximum in September or October with 3-4 times the rainfall in other months.
In crop seasons during of last years, drought event has affected from 12,000 to
50,000 hectares and totally lost from 1,000 to 13,000 hectares of agricultural land.
3.2. Evaluating the Relationship between Vegetation Indicators
3.2.1. Normalized Difference Vegetation Index (NDVI)
The NDVI algorithm subtracts the red reflectance values from the near-infrared and
divides it by the sum of near-infrared and red bands.
(3.1)
This formula allows us to cope with the fact that two identical patches of vegetation
could have different values if one were, for example in bright sunshine, and another under
a cloudy sky. The bright pixels would all have larger values, therefore having a larger
absolute difference between these bands. It is avoided by the sum of the reflectance.
Theoretically, NDVI values are represented as a ratio ranging in value from -1 to 1
but in practice extreme negative values represent water, values around zero represent bare
soil and values over 6 represent dense green vegetation.
3.2.2. Vegetation Condition Index (VCI)
The Vegetation Condition Index (VCI) compares the current NDVI to the range of
values observed in the same period in previous years. The VCI is expressed in % and gives
an idea where the observed value is situated between the extreme values (minimum and
maximum) in the previous years. Lower and higher values indicate bad and good
vegetation state conditions, respectively.[3]
( NDVI j NDVI min ) *100
VCI
( NDVI max NVDI min )
(3.2)
3.2.3. Land Surface Water Index (LSWI)
For more than 20 years the Normalized Difference Vegetation Index (NDVI) has
been widely used to monitor vegetation stress. It takes advantage of the differential
reflection of green vegetation in the visible and near-infrared (NIR) portions of the
spectrum and provides information on the vegetation condition. The Land Surface Water
Index (LSWI) uses the shortwave infrared (SWIR) and the NIR regions of the
electromagnetic spectrum. There is strong light absorption by liquid water in the SWIR,
and the LSWI is known to be sensitive to the total amount of liquid water in vegetation and
320
its soil background. In this study we investigated the LSWI characteristics relative to
conventional NDVI-based drought assessment, particularly in the early crop season.
LSWI index was caculated by below formula (Hunt et al., 1987&1989)
LSWI
NIR SWIR( 2130nm)
NIR SWIR( 2130nm)
(3.3)
3.2.4. Vegetation - Temperature Dryness Index VTCI
VTCI is lower for drought and higher for wet conditions. The value of VTCI ranges
from 0 to 1; the lower the value of VTCI, the higher is the occurrence of drought. [5]
Mathematically it can be written as
3.3. Satellite Data
Satellite data includes MODIS image 8-days and 32-days from 2000 year to 2013.
These data are at 1B type. Satellite data used for study are MODIS Land surface
temperature and surface reflectance and the product name is MOD11A2 and MOD09A1
respectively. These two products have been downloaded from EOS data gate way for the
period of November to May from 2000 to 2013.
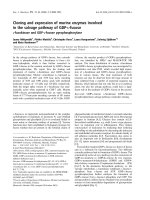
The MOD11A2 data are provided every 8 days as a gridded level - 3 product in the
Sinusoidal projection. It has twelve layers and out of these only layer 1 MODIS_LST_Day_1km and layer 02- MODIS_QC_Day has been used for analysis. Land
surface temperature image was retrieved from MODIS data during 6th April 2012 and 6th
April 2013 over the North Central region. It is an example of the MODIS level 3 LST 8 Day product at 1 km resolution. MOD11A2 is a composited version of the Level 3 daily
LST product.
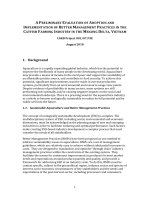
MOD09A1 provides bands 1- 7 at 500 meter resolution in an 8- day gridded level 3 product in the Sinusoidal projection. Each MOD09A1 pixel contains the best possible
L2G observation during an 8 - day period as selected by high - observation coverage, low view angle, the absence of clouds or cloud shadow, and aerosol loading. Science Data sets
provided for this product include reflectance values for Bands 1 - 7, quality assessment,
and the day of the year for the pixel along with solar, view, and zenith angles. The surface
reflectance (MOD09A1) and NDVI derived from surface reflectance image shown in
below figure was retrieved from MODIS data during 27th December 2012 and 27th
December 2013. It is an example of the MODIS level 3 surface reflectance product at
500m resolution.
321
Land Surface Temperature during 6th April 2012
Land Surface Temperature during 6th April 2013
Figure 1. The Land Surface Temperature in different years
Surface reflectance during 27th December 2012
Surface reflectance during 27th December 2013
Figur 2. Surface reflectance in North Central region
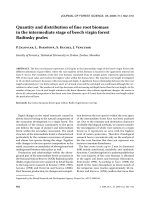
It is a measure of the amount and vigour of vegetation at the surface. The
magnitude of NDVI is related to the leve l of photosynthetic activityin the observed
vegetation. In general, higher values of NDVI indicate greater vigour and amounts of
322
vegetation. The reason NDVI is related to vegetation is that healthy vegetation reflects
very well in the near infrared part of the spectrum. Previous research suggests the
estimation of air temperature extrapolating the best fit line through the NDVI of full
vegatation canopy and LST correlation.
NDVI during 27th December 2012
NDVI during 27th December 2013
Figure 3. Normalized difference vegetation index in North Central region
3.4. Results of Drought Assessment by Satellite Imagines
3.4.1. Results by Calculating Land Surface Water Index
Land surface water index was calculated from May, 2012 to May 2013 by ENVI
software base on (3.3) equation. The index is calculated from LSWI remote sensing images
and after that it will be compared with field measurements to determine drought risk
following levels: heavy drought, moderately drought, light drought, normal, humid, cloud.
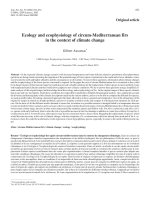
Figure 4a and 4b indicated that LSWI index results to representing two-week dry
season of 2012 and 2013, results show that the distribution of LSWI relatively consistent
with the distribution of arid regions. The North Central Region is always to be on a stress
drought. In the last months of 2012 year and the first months of 2013 year, LSWI values is
almost low, expressed drought appears over the wide area.
North Central region also has a large beaches with predominantly white sand, so not
only in the winter but also in the summer LSWI values is very low.
From the above analysis it can be concluded that the distribution of LSWI values is
consistent with the law of drought evolution in the region. So LSWI calculated by remote
sensing can be used as an indicator in the assessment and monitoring drought in the North
Central region.
323
Figure 4a. LSWI index 4th week
November 2012
Figure 4b. LSWI index 3th week
February 2013
3.4.2. Result of Drought Index from Caculation VTCI Value
VTCI has been computed based on the NDVI-Ts space, 2D scatter plot relation
for each pixel. The warm edge and cold edge pexels are subjected to linear regression
equation and the derived equations are used for computation of VTCI using band math
in ENVI, where land surface temperature (LST) and NDVI images are used as an input
parameter for VTCI equations. VTCI has been computed for 13 years (2000 - 2013),
which comprises Julian day of 241 to 297. This index was calculated for September and
October month in each year for regional agricultural drought monitoring because these
two months corresponds to reproductive period which is more sensitive to thermal stress.
Hence this index could better represent the drought during reproductive phase. VTCI is
more sensitive towards the reproductive stage of the crops in lieu of early stage of the
crops, this is due to land surface is more sensitive towards the dryness rather than more
moisture content in the soil as well as there is an inverse relationships existing between
LST and NDVI.
Base on the indexes of LST, NDVI database and their relationship, my research
caculated and gave results about the scatterplots of LST and NDVI for weeks in the North
Central region.
The scatterplots of LST as a function of NDVI index that was built for each of
MODIS images combination in the dry season. Calculating results was expressed at the
figure 5 below:
324
3th week of November 2012
3th week of December 2012
the 2nd week of February 2013
2nd week of March 2013
Figure 5. Dispersion graph of LST and NDVI in the North Central region
VTCI index is caculated by (3.4) formula, the value of LSTNDVIimax and
LSTNDVIimin indexes are defined as the surface‘s average temperature on condition that
water is supplied with limited or unlimited. Dry edges (red line) and wet edges (blue line)
was determined by linear regression analysis.
From the linear regression model in the figure 5 show that: the correlation
coefficient of the "dry edge"‘s equations very high (R> 0.8), the correlation coefficient of
"wet edge" equations although not as high as dry edge, but the trend is also consistently
with the evaporation process. In the other hand, the change of LST value in the wet edges
is smaller than the major change of NDVI index, so that, using the equations of wet edges
in caculate dry lever that impact to the results but not very strong. The slope of the dry
edge is usually bigger than wet edge lines, its demonstrating that the influence of the LSTNDVI into drought process is bigger than into wet process, consistent with the reality of
the drought process.
325
Figure 6. Graph of wet edges and dry edges in the North Central region (2012 – 2013)
This paper used to MODIS data to calculated NDVI and LST indexes, and then
caculated VTCI index for each week for the phase appeared arid and hot from May, 2012
to May, 2013. Figure 6 shows that the spatial distribution of the VTCI index in the North
Central region. Color palette represents the level of drought, VTCI value ranges from 0 to
1, the smaller the value VTCI (red gray area) represents arid areas and the greater VTCI
(blue zone) shows adequate water supply area.
From figure 6 also shows that the low of VTCI index usually appear in the coastal
the North Central region, the deeper going into the mainland, the higher of VTCI index.
Temperature of February is higer than temperature in last December in the North
Central region, mainly cause in these months it almost no rainfall, evaporation process
was strong, the remaining water was reserved in soil fades lead to widespread drought in
the summer.
To compare the value between LSWI and VTCI indices in the same week show
that: the distribution of both indices is quite appropriate term, almost the entire province of
Thanh Hoa, Nghe An are located in area have the range heavy drought and medium
drought, provinces of Ha Tinh, Quang Tri, Hue have lighter limited extent, but the large of
the area is also located in the medium drought and lightly drought.
The results of drought indices were caculated through VTCI and LWSI indicators
is the same in the same week and the same area), but the result of calculating VTCI
index usually right in the dry months within the area that has a fairly homogeneous of
climate conditions.
326
Hình 7.a. VTCI index of 4th
week of November 2012
Hình 7.b. VTCI index of 3rd
week of February 2013
4. Discussion and Conclussion
Drought has become a serious challenge in the world in general and Vietnam in
particular. Tracking, monitoring and forecasting drought is an urgent problem.
Along with the surface observation data, the integration information of remote sensing
with different spatial resolution and time, using drought indicators suitable for each region, each
season is fully capable to serve the surveillance and monitoring of drought in our country.
LSWI index calculated on the MODIS satellite image data and threshold drought
lever were classified according to the measurement data survey practice is consistent with
the law of drought events in Vietnam in general and research area in particular. Therefore
LSWI index base on remote sensing can be used as an indicator in the assessment and
monitoring of drought in the North Central region.
The use of VTCI indicators based on the correlation term NDVI-LST, proven by
the results of calculations drought value from meteorological stations as appropriate in dry
season and in relatively homogeneous regions of climatic conditions. So this is also an
indicator of drought assessment by remote sensing data in North Central region.
5. References
1. Nguyễn Trọng Hiệu (1995). Phân bố hạn hán và tác Ďộng của ch ng ở Việt Nam,
Đề tài NCKH cấp Tổng cục (1995).
2. Trịnh Quang Hoà (2001). Các yếu tố gây hạn hán, phân loại và phân cấp hạn hán,
Báo cáo khoa học Đề tài nhánh thuộc Ďề tài HMC (2001).
3. Ali Akbar Damavandi, Mohammad Rahimi, Mohammad Reza Yazdani, Ali Akbar
Noroozi, (2016), Assessment of Drought Severity Using Vegetation Temperature Condition
Index (VTC) and Terra/MODIS Satellite Data, Journal of Rangeland Science, 2016, Vol. 6, No. 1
4.UNDP Viet Nam (2016), Vietnam drought and saltwater intrusion transitioning
from Emergency to Recovery, Analysis Report and Policy Implications.
5. />
327