Behaviour of market arrivals and prices of the selected vegetables: A study of Baijnath regulated market of District Kangra, Himachal Pradesh, India
Bạn đang xem bản rút gọn của tài liệu. Xem và tải ngay bản đầy đủ của tài liệu tại đây (367.94 KB, 9 trang )
Int.J.Curr.Microbiol.App.Sci (2019) 8(1): 1454-1462
International Journal of Current Microbiology and Applied Sciences
ISSN: 2319-7706 Volume 8 Number 01 (2019)
Journal homepage:
Original Research Article
/>
Behaviour of Market Arrivals and Prices of the Selected Vegetables:
A Study of Baijnath Regulated Market of District Kangra,
Himachal Pradesh, India
Jyoti Chaudhary1*, Harbans Lal1 and H.P. Singh2
1
2
Department of Agricultural Economics, IAS, BHU, Varanasi, UP-221005, India
Department of Agricultural Economics, Extension Education and Rural Sociology,
CSKHPKV Palampur, HP-176062, India
*Corresponding author
ABSTRACT
Keywords
Arrivals, Prices,
Himachal Pradesh,
Seasonal
fluctuations
Article Info
Accepted:
12 December 2018
Available Online:
10 January 2019
Within horticulture, vegetable production is considered important for agricultural
development and the economy of the country as it generates more income and employment
and promotes equity when marketing is done rightly. The present study was undertaken to
examine the trends, relationship, as well as seasonal fluctuations in arrivals and prices of
selected vegetables in Baijnath, regulated market of district Kangra in Himachal Pradesh
for the year2010-11 to 2015-16. The analysis shows that the rate of increase in the monthly
arrivals is highest for cauliflower whereas for monthly prices it is highest for ladyfinger.
The prices of vegetables move contrary to arrivals i.e. prices increased with decreasing
arrivals in the market hence negatively correlated. The average monthly variability in
arrivals and prices was found the maximum for cucumber and ladyfinger, respectively.
The study of seasonal fluctuations in arrivals and prices showed that arrivals of most of the
vegetables were higher in the peak season and lower in the lean season. The correlation
coefficient calculated from different market prices of vegetables showed that study market
was highly integrated with Kangra market for most of the vegetables.
Introduction
Marketing of horticultural crop is complex
especially because of perishability, seasonality
and bulkiness. Within horticulture, vegetablesgrowing is considered more important as it
generates more income and employment,
promotes equity, improves nutrition and
protects and conserve environment (Kumar et
al., 2005). As far as production is concerned
India has emerged as the second largest
producer of vegetables with the production of
178 million tonnes (2016-17) next to China
and contributes around 14 per cent in the
world share. The huge geographical area and
several agro-climatic niches in the country
exert a strong influence on the supply of most
of the agricultural commodities. This increase
in agricultural output must be coordinated
with changes in the demand and supply for
agricultural commodities and marketing, so
that producer’s share in consumer’s rupee
increases considerably irrespective of the
volume of the marketable surplus with the
1454
Int.J.Curr.Microbiol.App.Sci (2019) 8(1): 1454-1462
farmers(Sharma and Burark, 2015). Stable
prices play an important role in determining
the farmer’s income. Due to perishability and
seasonality of vegetables the producers cannot
retain the vegetables at home for a long time
thus, have no control over price which leads to
price uncertainty. Therefore, the analysis of
price behaviour would be useful to take
decisions like "when to grow and when to
sell" on the part of the farmers and "when,
where, how to store and dispose of the
produce" on the part of the businessman. The
variations between the prices of vegetables
received by farmers at the time of harvest and
during lean season introduce an element of
uncertainty and affect both producers and
consumers in case of low prices received and
high prices paid.
Therefore, marketing rightly considered an
essential activity in addition to improved input
like seed and fertilizer in modern agriculture.
The study of the relationship between market
arrivals and prices is very useful. Larger
production and larger arrivals affect adversely
to the prices. As a result, the prices usually go
down. To achieve the goal of efficient
marketing, in-depth studies on seasonal
variations and prices are needed. Such studies
make the farmers aware of the optimum time
to sell their products and also help the policy
makers to regulate the supplies and to stabilise
the prices. The study has been carried out with
the objective to study trends in arrivals and
prices, the relationship between arrivals and
prices and seasonal fluctuations in the arrivals
and prices of selected vegetable commodities.
Materials and Methods
The data on market arrivals and wholesale
prices for different vegetable crops were
collected from the APMC Kangra and
Baijnath market as well as websites of
agricultural marketing (www.agmarknet.
nic.in). The data pertains to years 2010-11 to
2015-16. The pattern of market arrivals and
prices behaviour of the selected vegetable
crops were analysed in term of mean value for
each month and the coefficient of variation.
Compound growth rates were worked out to
examine the trends in market arrivals and
prices. The effect of prices on arrivals was
worked out using a simple linear regression
model. The seasonal indices of monthly
arrivals and wholesale prices of vegetables
were computed by the using the following
formula (Fielder and Osagie 1985)
where,
= Monthly index for arrivals/prices in
month in ith year
= Average monthly arrivals (q) /prices (Rs.
/q)/ in
month in ith year
= Average monthly arrivals (q)/prices (Rs.
/q)/ in
year
j = Number assigned to month (j = 1, 2,
3…..12, where j=1 for April and j=12 for
March)
b = Trend coefficient
Results and Discussion
Trends in arrivals and prices
The trend analysis shows the magnitude and
direction of change over a period of time. The
monthly arrivals of lady finger, cauliflower,
pea, radish and potato increased significantly
over the time period under consideration
(Table 1).
The rate of increase in the monthly arrivals
was slightly higher for cauliflower and radish
as compared to pea, potato and ladyfinger.
The pattern over a period of six years showed
an average rising tendency of 3.10 q, 1.79 q,
1.43 q, 1.22 q and 0.62 q per month in case of
cauliflower, radish, pea, potato and ladyfinger.
Further, the monthly prices of all the
1455
Int.J.Curr.Microbiol.App.Sci (2019) 8(1): 1454-1462
vegetables increased significantly over the
time period under consideration. The rate of
increase in the monthly prices was slightly
higher for lady finger, tomato and cauliflower
as compared to other vegetables. The pattern
over a period of six years showed an average
rising tendency of Rs. 24.01/q, Rs. 13.77/q,
Rs. 12.05/q, Rs. 11.67/q, Rs. 11.28/q, Rs.
9.48/q, Rs. 9.14/q, Rs. 7.59/q and Rs. 5.29/q
per month for ladyfinger, tomato, cauliflower,
brinjal, potato, cabbage, cucumber, pea and
radish.
Variability in arrivals and prices of major
vegetable commodities
The analysis of variability in monthly arrivals
and prices indicates the extent to which
marketing system is managing the arrivals in
the market Table 2 and 3.
The Table 2 shows that average monthly
arrivals of the cucumber recorded the
maximum variability of 77.46 per cent
followed by pea (66.09 %), brinjal (53.77%),
cauliflower and brinjal (46.27 % to 48.83 %)
the variability in the arrivals of cabbage was to
the extent of 37 per cent. The minimum
variability of about 16 per cent was recorded
in the average monthly arrivals of tomato.
This shows that the pattern of monthly arrivals
of tomato was more or less uniform around the
year.The monthly arrivals were observed to be
more than average for the period extending
from November to June. In the case of brinjal,
the arrivals were more than average during the
month of April-May and again in the months
of September to November. For lady finger,
the arrivals were above average in the postharvest period extending from May to
October. The similar type of pattern was also
observed in the case of cucumber also. In the
case of cauliflower and cabbage, the monthly
arrivals were also above average during the
months of November to March. The arrivals of
pea, radish and potato also exhibited the
similar pattern as that of cabbage and
cauliflower.
The pattern of average monthly prices of
vegetables given in Table 4 reveals that
highest variability in the average monthly
prices was recorded in case of lady finger
(47.53 %) followed by cabbage (41.35 %),
cucumber (37.92 %), cauliflower (35.92 %)
and pea (33.74 %). The variability in the
average monthly prices of the other vegetables
was recorded to extent of 20 to 26 per cent
with the minimum of 20.74 per cent in case of
tomato. The average price received for
different vegetables were highest in the month
of November for tomato, March for brinjal
and lady finger, February for cucumber,
September for cauliflower and pea, October
for cabbage and radish and in the month of
November for potato which was the lean
seasons of the vegetable arrivals in the market.
Relationship between market arrivals and
prices
The arrivals of vegetables in the market affect
their prices to a large extent. The degree of
relationship between market arrivals and
prices of vegetables was studied by computing
correlation coefficients as well as regression
coefficients (Table 4). The arrivals and prices
of all vegetables were inversely related to each
other. Similar results of an inverse relationship
between arrivals and prices were reported by
(Reddy et al., 2012). The regression
coefficients turned out to be negative for all
the vegetables but statistically significant only
for lady finger, cucumber, cauliflower and
pea. This indicated that the arrivals of tomato,
brinjal, cabbage, radish and potato had no
much effect on their prices.
Seasonal behaviour of prices and arrivals
The seasonal changes in prices of agricultural
produce are caused by the seasonal nature of
1456
Int.J.Curr.Microbiol.App.Sci (2019) 8(1): 1454-1462
production as farmers cannot store their
produce to prevent such changes. These
variations affect the income of the farmers
adversely because of the inverse relationship
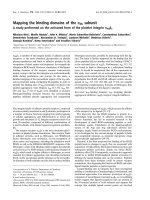
between arrivals and prices. The indices of
arrivals of tomato were higher during the
months of December to June and at a
maximum level during May (119.11 %) (Fig.
1) and the price indices were in the month of
November (129.28 %). The seasonal indices
of monthly arrivals of brinjal (Fig. 2) were
high during the month of April and May,
slackened from June to August and again were
high during September to November. The
price indices were highest in the months of
January to March. The seasonal indices of
monthly arrivals for ladyfinger (Fig. 3) and
cucumber (Fig. 4) were high from April to
October and low from November to March
months. The highest arrivals of cucumber
(230.91 %) were noticed in the month of May
and lady finger (184.49 %) in the month of
June. The index of arrivals was highest in the
month of February for cauliflower (155.25 %)
(Fig. 5) and December both for cabbage
(152.94 %) (Fig. 6) and pea (200.34 %) (Fig.
7) which was the main growing seasons of the
vegetables. In case of radish and potato (Fig. 8
and 9), the highest indices of arrivals were
found in the month of November (151.42 %)
for radish and March (139.62 %) for potato.
The price indices revealed that in case of
cauliflower, the price indices were highest in
the month of September (170.75 %) For radish
and potato price indices were maximum in the
month of July and November.
Table.1 Trends in monthly arrivals and prices of vegetables
Sr.
No.
Arrivals (q)
Prices (Rs./q)
Constant
Regression
Constant
Regression
(a)
Coefficient (b)
(a)
Coefficient (b)
Tomato
310.31
-0.16
1086.31
13.77*
1
(0.77)
(3.62)
Brinjal
78.46
0.57
813.42
11.67*
2
(0.47)
(2.41)
Ladyfinger
45.40
0.62**
1915.90
24.01*
3
(0.34)
(8.07)
Cucumber
75.58
0.53
1123.80
9.14*
4
(0.61)
(3.56)
Cauliflower
127.95
3.10*
1047.68
12.05*
5
(0.85)
(3.97)
Cabbage
91.55
0.37
588.02
9.48*
6
(0.30)
(2.82)
Pea
63.30
1.43*
1272.34
7.59**
7
(0.52)
(3.23)
Radish
65.94
1.79*
522.96
5.29*
8
(0.40)
(1.37)
Potato
166.19
1.22**
526.39
11.28*
9
(0.59)
(2.31)
Note: Figures in parentheses indicate the standard errors of the regression coefficients.
Vegetable
*Significant at 1 % level of probability,
**Significant at 5 % level of probability
1457
Int.J.Curr.Microbiol.App.Sci (2019) 8(1): 1454-1462
Table.2 Average monthly arrivals of vegetables in the market
(Quintal)
Month
Tomato
Brinjal
April
318.67
158.67
Ladyfi
nger
54.67
May
358.67
218.00
June
323.00
July
Cucumber Cauliflower Cabbage
Pea
Radish
Potato
182.00
193.67
137.83
55.50
102.33
182.00
111.67
258.83
125.17
75.17
114.33
99.33
195.00
96.33
118.50
154.50
111.33
67.17
71.33
66.50
158.67
261.67
76.83
88.17
94.17
111.58
50.00
60.33
51.50
136.17
August
196.33
70.17
109.17
109.83
138.33
78.50
61.50
66.67
119.50
September
242.17
121.00
99.50
108.67
153.83
75.17
44.50
103.50
167.17
October
291.83
113.83
81.00
66.33
228.83
68.50
23.00
153.67
224.17
November
308.33
102.50
28.83
30.83
389.67
108.67
80.33
200.00
267.00
December
334.17
76.83
11.50
21.00
380.67
164.67
234.83
196.17
282.67
January
306.00
78.83
38.67
25.83
315.67
146.00
204.00
155.00
230.67
February
359.33
30.67
19.33
30.00
379.33
140.33
232.33
177.33
253.17
March
354.83
46.17
54.67
55.67
365.67
147.50
204.33
205.17
311.33
Mean
304.58
99.15
67.97
94.81
241.15
104.96
115.53
131.43
210.63
S.D.
47.87
48.41
36.55
73.44
111.57
38.36
76.35
53.96
58.03
CV(%)
15.72
48.83
53.77
77.46
46.27
36.55
66.09
41.06
27.55
Table.3 Average monthly prices of vegetables in the market
(Rs./q)
Month
Tomato Brinjal Ladyfinger Cucumber Cauliflower
Cabbage
Pea
Radish
Potato
April
1635.67 1169.00
3884.33
815.83
1006.00
544.33
1175.00
598.17
677.67
May
1173.83 1003.50
2105.33
651.83
1436.17
572.50
1241.67
723.83
838.00
June
969.00
988.33
1199.00
860.17
1640.33
748.17
1446.67
787.67
906.17
July
1703.50 1227.00
1402.83
1109.50
1888.83
1016.17
2091.67
933.00
1091.67
August
1818.33 1381.50
1522.33
1188.67
1936.00
1325.00
2191.67
918.00
1131.50
September
1782.17 1179.00
1579.67
1003.33
2475.33
1152.33
2325.00
901.33
1169.33
October
1943.17 1052.67
2038.50
1719.00
2238.83
1645.83
2283.33 1049.67 1172.33
November
2203.00
950.50
2261.83
1959.17
1251.50
1554.50
1678.33
498.00
1246.83
December
1595.17
994.17
3525.33
1861.83
1347.17
884.83
1350.00
567.00
844.83
January
1474.33 1454.67
4565.50
2134.50
946.83
673.50
950.00
558.50
724.83
February
1240.50 1583.33
4599.17
2314.67
661.17
525.33
908.33
491.67
695.83
March
1526.67 1887.67
4822.50
1870.50
1023.00
565.17
950.00
564.17
757.67
Mean
1588.78 1239.28
2792.19
1457.42
1487.60
933.97
1549.31
715.92
938.06
S.D.
329.51
275.53
1327.11
552.60
534.37
386.16
522.66
187.21
201.85
CV(%)
20.74
22.23
47.53
37.92
35.92
41.35
33.74
26.15
21.52
1458
Int.J.Curr.Microbiol.App.Sci (2019) 8(1): 1454-1462
Table.4 Effect of arrivals on the prices of vegetables in the market
Sr. No
Vegetable
(Rs./q)
r
Constant
Regression coefficient
R2
-0.91
(0.61)
-0.45
(0.71)
-8.01*
(2.9)
-3.06*
(0.63)
-1.41*
(0.52)
0.49
(0.71)
-2.85*
(0.64)
-0.53
(0.39)
-0.23
(0.53)
0.030
-0.177
0.006
-0.076
0.100
-0.313*
0.250
-0.500*
0.090
-0.308*
0.007
-0.089
0.220
-0.467*
0.030
-0.161
0.003
-0.052
1
Tomato
1867.34
2
Brinjal
1283.77
3
Ladyfinger
3335.21
4
Cucumber
1747.28
5
Cauliflower
1827.73
6
Cabbage
859.42
7
Pea
1878.09
8
Radish
786.23
9
Potato
986.52
Note: Figures in the parentheses indicate standard errors of regression coefficients
*significant at 1 % level of probability, ** Significant at 5 % level probability
Table.5 Correlation coefficients between prevailing wholesale prices of vegetables in different
markets
Markets
Correlation coefficient for different vegetables
Tomato Brinjal
Lady
Cucumber
finger
0.962*
0.861*
0.939* 0.788*
BaijnathKangra
0.384
0.415
BaijnathBhunter
0.904* 0.327
BaijnathJalandhar
0.918* 0.066
BaijnathPathankot
0.095
0.290
BaijnathHoshiarpur
Note: * denotes 1 % level of significance
** denotes 5 % level of significance
Cauliflower
Cabbage
Pea
Radish
Potato
0.913*
0.817*
0.915*
0.899*
0.803*
0.701*
0.674*
0.457
0.777*
0.636**
0.814*
0.890*
0.809*
0.471
0.764*
0.749*
0.883*
0.657**
0.847*
-
0.638**
0.771*
0.845*
0.709*
0.877*
0.816*
0.647**
0.692*
1459
0.588**
Int.J.Curr.Microbiol.App.Sci (2019) 8(1): 1454-1462
Fig.1&2 Seasonal indices of arrivals and prices of tomato in the market and seasonal indices of
arrivals and prices of Brinjal in the market
Fig.3&4 Seasonal indices of arrivals and prices of ladyfinger in the market and Seasonal indices
of arrivals and prices of cucumber in the market
Fig.5&6 Seasonal indices of arrivals and prices of cauliflower in the market and Seasonal
indices of arrivals and prices of cabbage in the market
1460
Int.J.Curr.Microbiol.App.Sci (2019) 8(1): 1454-1462
Fig.7&8 Seasonal indices of arrivals and prices of pea in the market and seasonal indices of
arrivals and prices of radish in the market
Fig.9 Seasonal indices of arrivals and prices of potato in the market
Market integration
Integrated markets are those markets where
prices are determined interdependently means
that the price changes in one market would be
fully transmitted to other markets. For tomato
(Table 6) the correlation coefficient calculated
from market prices showed that Kangra,
Jalandhar and Pathankot markets were found
to be highly correlated with Baijnath market
as the correlation coefficient was turned out to
be more than 0.90. In case of brinjal, the
correlation coefficients between Baijnath and
Kangra market was recorded to be 0.79 which
showed that both the markets were highly
integrated but there was no integration of
Baijnath market with the markets located
outside the state. The Baijnath market was
highly correlated (0.96) with Kangra market
for ladyfinger. For cucumber, the Baijnath
market was moderate to highly integrated
(0.701 to 0.890) with other markets of the
state and outside the state. The correlation
coefficients calculated from the market prices
for cauliflower, radish and potato showed that
all the selected markets were moderate to
highly integrated with each other. The
Baijnath market for pea was moderately
integrated with the markets located outside
the state but was highly integrated with the
markets located within the state.
Due to the perishable nature of vegetable
supply of these commodities are inelastic. The
trends in arrivals during the period 2010-11 to
2015-16 showed a significant increase in case
of lady finger, cauliflower, pea, radish and
potato. On contrary, the average monthly
prices of all the vegetables showed a
significant increase. Among all the
vegetables, the prices of lady finger showed a
maximum rise of Rs. 24 per quintal per
1461
Int.J.Curr.Microbiol.App.Sci (2019) 8(1): 1454-1462
month. The study has confirmed the negative
relationship between market arrivals and
prices.
The regression coefficient was found negative
for all the vegetables but was found
statistically significant only for lady finger,
cucumber, cauliflower and pea. The arrivals
and prices of vegetables in the market showed
the high degree of seasonal variation.
In the case of tomato, brinjal and lady finger
the arrivals were at peak level during May,
while for cucumber these were maximum in
the month of June, while the prices were low
during these months. For cauliflower and
cabbage, the arrivals were maximum in the
month of February and December,
respectively.
The farmers generally grow the vegetable
crop without any consideration of the trends
in the market prices. They should be
persuaded by the extension agency to modify
their conventional production programmes
and supply of these vegetables to minimise
the losses and take advantage of better prices
situations for respective vegetables.
References
Fielder LL Jr and Osagie EI. 1985. Analysis,
forecasts and seasonal pattern of
monthly
prices
and
quantities,
Louisiana farm products. DAE,
Research Report No. 642. pp 73
Jadhav MC, Ulemale DH and Borkar AN.
2011. Trends and seasonal variation in
arrivals and prices in Amravati district.
International Research Journal of
Agricultural Economics and Statistics.
2(2): 232-235.
Kumar V, Sharma HR and Singh K. 2005.
Behaviour of market arrivals and prices
of selected vegetable crops: A study of
four metropolitan markets. Agricultural
Economics Research Review 18: 271290
Naidu MG, Kumari VM and Srikala V. 2014.
Behaviour of market arrivals and prices
of red chillies (Capsicum annum). Plant
Archives. 14 (1): 511-519.
Reddy BS, Chandrashekhar SM, Dikshit AK
and Manohar NS. 2012. Price trends
and integration of wholesale markets for
onion in metro cities of India. Journal
of
Economics
and
Sustainable
Development 3: 120-12.
Sharma H and Burark SS. 2015. A study of
seasonal
price
behaviour
and
concentration of maize in Rajasthan.
International Research Journal of
Agricultural Economics and Statistics 6
(2): 282-286.
How to cite this article:
Jyoti Chaudhary, Harbans Lal and Singh, H.P. 2019. Behaviour of Market Arrivals and Prices
of the Selected Vegetables: A Study of Baijnath Regulated Market of District Kangra,
Himachal Pradesh, India. Int.J.Curr.Microbiol.App.Sci. 8(01): 1454-1462.
doi: />
1462