A generative probabilistic framework for analyzing regional communities in social networks
Bạn đang xem bản rút gọn của tài liệu. Xem và tải ngay bản đầy đủ của tài liệu tại đây (382.84 KB, 20 trang )
Vinh University
Journal of Science, Vol. 48, No. 2A (2019), pp. 9-28
ErLinkTopic: A GENERATIVE PROBABILISTIC FRAMEWORK
FOR ANALYZING REGIONAL COMMUNITIES
IN SOCIAL NETWORKS
Tran Van Canh (1) , Michael Gertz (2) , and Dang Hong Linh (1)
1 Institute of Engineering and Technology, Vinh University, Vietnam
2 Institute of Computer Science, Heidelberg University, Germany
Received on 5/4/2019, accepted for publication on 22/6/2019
Abstract: Understanding how communities evolve over time have become a hot
topic in the field of social network analysis due to the wide range of its applications. In this context, several approaches have been introduced to capture changes
in the community members. Our claim is that a community is characterized by
not only the identity of users but complex features such as the topics of interest,
and the regional and geographic characteristics. Studying changes in such features of communities also provides informative findings for related applications.
This leads to the main goal of the study in this paper, which is to capture the
evolution of complex features describing communities. Particularly, we introduce
a probabilistic framework called ErLinkT opic model. The model is able to extract regional LinkT opic [1] communities and to capture gradual changes in three
features describing each community, i.e., community members, the prominence of
topics describing communities, and terms describing such topics. It further supports the study of regional and geographic characteristics of communities as well
as changes in such features. Experimental evaluations have been conducted using
T witter data to evaluate the model in terms of its effectiveness and efficiency
in extracting communities and capturing changes in the features describing each
community.
1
Introduction
Several models and algorithms have been developed for extracting communities in social
networks. Typical approaches rely on the link structure of users, which is presented as a
graph. This leads to the application of different graph clustering algorithms to detect such
link-based communities, e.g., [2]-[4]. Recent studies, however, pay more attention to finding
topical communities. By this, topical analysis is applied to the messages of users to derive
topics indicating their interests. The extracted topics are used as another feature, besides
the link structures to identify relationships between users. The key idea is that by leveraging more common features of users one can discover more meaningful communities. That
is, users in a community exhibit both structural and hidden semantic links to each others.
The main approach to extracting communities based on this idea is to develop a probabilistic model simulating a process of generating the observed features of users from hidden
1)
Email: (T. V. Canh)
9
T. V. Canh, M. Gertz, D. H. Linh / ErLinkTopic: A generative probabilistic framework for...
communities. In the proposed models, e.g., [5]-[7], the two important features, namely the
contextual links of users and the regional aspect of communities, have been either neglected
or paid only very little attention to. In [1], the authors developed a novel probabilistic model
rLinkT opic to add these features into account. However, rLinkT opic does not cover the
dynamic of communities. Nevertheless, communities in a social network evolve over time
due to several reasons. A user is interested in the topics of a community and joins as a
new member while some users might leave the community. The happening of social events,
e.g., an election, and other phenomena also lead to the evolution of communities. Such an
evolution is implied by changes in the features describing a community. These include, for
example, users in the community, topics of the community, and geographic locations of the
users. Given that a community is characterized by even more features, analyzing its evolution thus is a challenging task. This is because one has to have a complex model that is able
to discover communities and to capture changes in as many features describing a community
as possible. To date, existing approaches for the analysis of evolving communities attempt
to study changes with respect to one feature, which are the community members [8]-[11].
The concept of evolution is therefore defined only in the context of the user population of
a community over time. Because of this, no information is obtained with respect to how
other features of the community evolve. From an application perspective, one is usually
interested not only in the dynamics of users, e.g., which users are in a community at what
time, but also in other features that describe the community over time. These observations motivate our study and development of a comprehensive framework that takes more
features of interest into account to study the evolution of communities in social networks.
Particularly, in this paper, we introduce a probabilistic model called ErLinkTopic that is
an extension of the rLinkTopic model developed in [1] for extracting regional LinkT opic
communities and analyzing their complex evolution. By stating complex evolution, we are
particularly interested in changes in the features describing a community as formalized in
the rLinkT opic model. These include (1) the community membership of users in a community; (2) topic proportion of a community; and (3) terms occurring in a community topic.
Also, because information about geographic locations is associated with users’ postings, the
model further supports the study of changes in the regional and geographic characteristics
of communities. The paper is organized as follows. Section 2 gives an overview of the background and related work for this paper. Section 3 presents the underlying data model and
introduces notations used to present the ErLinkTopic model. In Section 4, we first describe
how rLinkTopic is extended to build ErLinkTopic that can discover communities and, at
the same time, capture their evolution (Section 4.1). We then give detailed steps to derive a
Gibbs sampling algorithm to compute the posterior distribution of the ErLinkTopic model
(Section 4.2). The results of our experimental evaluations using T witter data are presented
in Section 5 before we conclude the paper in Section 6.
10
Vinh University
2
2.1
Journal of Science, Vol. 48, No. 2A (2019), pp. 9-28
Background and the rLinkTopic Model
Study of Evolving Communities
In addition to extracting static communities, e.g., [1], [3], [7], [12]-[15], several models
have been introduced to study the evolution of communities regarding changes in the community members over time. Three main approaches have been applied, namely snapshot
community matching, evolutionary clustering, and probabilistic models.
The MONIC framework for finding and monitoring cluster transactions was proposed
in [16]. The authors consider the number of common objects (users) between two clusters
(community structures) at two consecutive snapshots as a measure to decide whether a
cluster has transited to or evolved from another. Based on this measure, five events called
becomes, splits, merges, disappears, and appears that might happen to a community during
two consecutive snapshots are defined. Sitaram Asur et al. [8] developed a similar framework
to study community evolution. By matching snapshot communities, the authors formalized
five temporal events that are identically interpreted as those in MONIC. Other measures
called stability, sociability, popularity, and influence to study the behavior of users in a
network were defined in this framework also. Palla et al. [17], [18] introduced a Clique Percolation Model and proposed a method to capture the evolution of communities between
two consecutive snapshots by creating a union graph and matching community structures
found in this graph with community structures found at the two snapshots. Studies based
on the evolutionary clustering approach build unified models to find temporal smooth evolving communities. The main idea of this approach is that the objective function employed
in graph partitioning algorithms consists of two components, the history quality and the
snapshot quality. The snapshot quality measures how accurate the resulting clusters capture
the structure of the network at the current snapshot, while the history quality measures
how consistent the resulting clusters are, with respect to the clusters discovered at the
previous snapshot. Algorithms are designed to find a partition that is trade-off to these
two quality components. The first study in this direction was introduced by Chakrabarti
et al. [9]. In their work, the k-means and hierarchical clustering algorithms were extended
to produce evolving clusters. Lin et al. [10], [19] developed a FacetNet framework, which is
based on non-negative matrix factorization [20] to approximate the structure of a snapshot.
The snapshot quality and history quality are computed using Kullback Leibler divergence
distance. Evolving communities are identified by optimizing the clustering solution with
respect to both the snapshot quality and the history quality. The authors of FacetNet also
introduced a similar framework called MetaFac that employs metagraph factorization to
extract communities in dynamic and rich media networks [11]. Other studies on the evolutionary clustering approach employed spectral clustering methods. Examples include the
studies by Chi et al. [21], [22].
The probabilistic modeling approaches extract communities from each snapshot and
make prediction about the evolution of communities using Bayesian prediction strategy. A
probabilistic model is developed to discover communities in each snapshot, which is basically
similar to the idea applied to extract static communities. However, to capture the evolution
of communities, the community membership of users at the previous snapshot is used as a
11
T. V. Canh, M. Gertz, D. H. Linh / ErLinkTopic: A generative probabilistic framework for...
prior knowledge for computing such a membership at the current snapshot. Communities
gradually evolve over time, which is indicated by changes in the membership of users in
communities discovered over snapshots [23], [24].
2.2
The rLinkTopic Model
Although geographic and regional aspects of communities find many practical applications, e.g., in social studies and marketing, to date, existing approaches to community
detection have paid little attention to these features when analyzing social network data. To
address these shortcomings, in [1], the authors introduced the concept of regional link-topic
communities and proposed a novel probabilistic model called rLinkT opic for extracting
such communities. The model jointly considers the spatio-temporal proximity of users in
terms of the messages they post over time, together with contextual links and message
topics to determine communities. Each community derived by rLinkT opic is not only described by a mixture of topics but also by its regional properties. It is noted that, in the
rLinkT opic model, a social network is formalized as a sequence of snapshots. The model
relies on the occurrences of users in each snapshot to identify users who occur in the network
within spatio-temporal proximity. This co-occurrence feature together with the contextual
links and the topics of user postings are employed to extract communities. By this, the
temporal order of the occurrences of users, i.e., the order of snapshots, is not important
and is discarded in the rLinkT opic model. Our aim in this paper is to take advantage of the
rLinkT opic model to extract communities; and, at the same time, to capture community
evolution. For the latter aspect, the temporal order is crucial, because it is used to explain
the evolution of the characteristics of a community over time.
3
Data Model and Notations
This section describes the data model underlying our framework and introduced notations used throughout this paper. We model a social network as a sequence of sliding
windows, each of which consists of a number of consecutive snapshots. The general idea is
that communities are extracted within each sliding window, i.e., the temporal order of the
snapshots in a sliding window is discarded. Information about the community structures
obtained from the current sliding window then is employed to derive communities at the
next sliding window. Adopting the data model introduced in the rLinkT opic model [1], the
concept of sliding windows is formalized as follows.
Definition 3.1 (Network Sliding Window). Given a social network SN = {sn1 , sn2 , ..., snT }
and a time span t = [ts , te ], a sliding window Wt of size t is a sequence of consecutive
snapshots Wt = {snts , ..., snte }.
Having the sliding window defined, a social network is now considered a sequence of
sliding windows, i.e., SN = {W1 , W2 , ..., WT }, which is the underlying data model for the
ErLinkT opic framework presented in the next section. To present the ErLinkTopic model,
the main notations used in the rLinkTopic model [1] are employed and some other notations
are introduced, all of which are described in Table 1.
12
Vinh University
Journal of Science, Vol. 48, No. 2A (2019), pp. 9-28
Tab. 1: Notations used in the ErLinkTopic model for extracting regional LinkT opic
communities and analyzing their evolution.
Notation
U
C
V
Z
R Wt
θt
φt
πt
ϕt
rt
ct
zt
4
Description
set of users in social network, u is a user in U
set of communities, c is a community in C
vocabulary set, w is a word in V
set of community topics, z is a topic in Z
set of geographic regions created from snapshots of sliding window Wt
set of community distributions in geographic regions RWt , i.e., θt = {θr }, r ∈ RWt
set of user distributions for communities C at window Wt , i.e., φt = {φt;c }, c ∈ C
set of topic proportions of communities C at window Wt , i.e., πt = {πt;c }, c ∈ C
set of term distributions for topics Z at window Wt , i.e., ϕt = {ϕt;z }, z ∈ Z
region assignments of the occurrences of users at window Wt
community assignments of the occurrences of users at window Wt
topic assignments of the messages of users at window Wt
ErLinkTopic Probabilistic Model
This section presents in detail the ErLinkTopic model for extracting regional LinkT opic
communities and analyzing their evolution. In Section 4.1, a discussion explaining how
rLinkT opic is employed to develop ErLinkT opic is given. We present the steps to derive
a Gibbs sampling algorithm for the ErLinkT opic model in Section 4.2.
4.1
rLinkTopic to ErLinkTopic
Typically, a two-step approach is applied to study the evolution of communities. In the
first step, communities are extracted independently of the occurrences of users at different
time points, e.g., snapshots or sliding windows. In the second step, a matching of the communities obtained from consecutive time points is accomplished. Based on the result of the
matching, the evolution of communities is then explained. For example, if the rLinkT opic
model is employed to study community evolution based on this two-step approach, then
one would run the model independently on each sliding window to extract communities.
Communities obtained from consecutive sliding windows are then matched to find out their
evolution. Almost all of existing studies for the analysis of evolving communities follow
this strategy [8], [16], [18]. Even that, this typical approach has two main shortcomings.
First, the matching procedure always requires extensive computations and the selection of
a matching solution is a subjective task. This issue becomes even harder for our setting,
because we aim at studying the evolution of multiple features describing a community.
The second weakness affecting the result more is that this approach fails to capture the
gradual evolution of communities. It is because communities are independently extracted
from different sliding windows and none of the obtained information is employed while
deriving new communities. That is, for example, the community structures obtained from
13
T. V. Canh, M. Gertz, D. H. Linh / ErLinkTopic: A generative probabilistic framework for...
the previous sliding window are not used in the extraction of communities at the current
sliding window. Obviously, community memberships of a user at the current sliding window
should be derived based on the memberships of that user in communities discovered from
the previous sliding window. This happens similarly to the evolution of the topic proportion
of a community, and the evolution of terms in a topic. To handle these observations, the
ErLinkTopic model is developed to discover communities over sliding windows in the way
that information about the community structures obtained from a sliding window is used
for deriving communities at the next window. That is, the community membership of users,
the topic proportion of communities, and the distribution of terms in topics obtained from
sliding window Wt−1 are used as prior knowledge provided to compute the corresponding
distributions at sliding window Wt . This is basically done by extending the rLinkTopic
model. The key idea in the rLinkTopic model is that we employ the conjugacy between the
Dirichlet distribution and the M ultinomial distribution to model the features describing a
community. Such features include (1) the distribution φc of users, (2) the topic proportion
πc , (3) the distribution ϕz of terms in a topic associated with c, and (4) the geographic
areas where c is observed, which is characterized by the likelihood of c in regions, denoted
θr,c , r ∈ R. As a result, the posterior distribution of each of these variables is also a Dirichlet
distribution. Therefore, it is straightforward to extend the rLinkTopic model so that it can
be used to discover communities and, at the same time, to capture their gradual evolution.
More precisely, the scenario of extracting and capturing the evolution of communities over
two sliding windows Wt−1 and Wt is as follows. First, applying the rLinkT opic model to
the occurrences of users in the snapshots of Wt−1 to extract communities from that sliding
window. Each identified community c is characterized by the posterior distributions of the
(1) users in c, denoted φt−1;c , (2) topic proportion of c, denoted πt−1;c , (3) terms in topics
associated with c, denoted ϕt−1;z , z ∈ Z, and (4) locations of c, denoted θt;r,c , r ∈ RWt−1 ,
derived at sliding window Wt−1 . The estimated value of each of these variables except θt
is then used as an evidence to compute the corresponding variables at the next step for
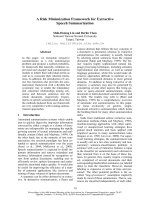
extracting communities from sliding window Wt . By this, all features describing a community are obtained over time and their changes are gradually captured. Figure 4.1 shows
the graphical model representing the generative process of the ErLinkT opic model as described. It is a sequence of rLinkT opic models linked to each other. Each block describes
the extraction of communities in a sliding window.
ηt∈W1
Nt∈W1
ro
α
θr
RW1
co
uo
|o.f |
β
γ
φc
C
ro
α
locro
RW1
loco
θr
RWt−1
co
zo
uo
|o.f |
σ
wo
|o.msg|
uo
πc
µ
Z
Nt∈Wt−1
C
α
θr
RWt
co
uo
|o.f |
σ
wo
|o.msg|
πc
φc
locro
RWt−1
zo
uo
Nt∈Wt
ro
loco
W1
ϕz
C
ηt∈Wt
ηt∈Wt−1
zo
σ
wo
|o.msg|
uo
Wt−1
ϕz
C
πc
φc
Z
C
locro
RWt
loco
Wt
ϕz
C
Z
Fig. 1: Graphical model presenting the generative process of the ErLinkT opic model. It
consists of a sequence of rLinkT opic models linked to each other.
14
Vinh University
4.2
Journal of Science, Vol. 48, No. 2A (2019), pp. 9-28
Posterior Estimation for ErLinkTopic Model
There are assumptions implicitly employed in the ErLinkT opic model shown in Figure 4.1. First, the distributions φt of users in communities, the topic proportions πt of
communities, and the distributions ϕt of terms in topics at the current sliding window Wt
are conditionally independent of the occurrences of users at the previous sliding window
Wt−1 , given the corresponding distributions obtained from Wt−1 , i.e., φt−1 , πt−1 , and ϕt−1 .
Second, the occurrences of users in the snapshots of sliding window Wt are conditionally
independent of all other information, given φt , πt , ϕt , and θt . Having such assumptions
employed, the joint distribution of the ErLinkT opic model is represented as follows.
P (SN, φ, θ, π, ϕ, r, c, z|β, γ, µ, α, η, σ)
= P (W1 , φ1 , θ1 , π1 , ϕ1 , r1 , c1 , z1 |β, γ, µ, α, η, σ)
(1)
T
×
P (Wt , φt , θt , πt , ϕt , rt , ct , zt |φt−1 , πt−1 , ϕt−1 , α, η, σ)
t=2
Based on Eq. 1, the posterior distribution of the model is derived incrementally over sliding
windows. Particularly, it is first computed based on the occurrences of users in the snapshots
of the first sliding window W1 and the hyperparamters of the model. This is actually the
posterior estimation of the rLinkT opic model applied to the snapshots of W1 . For each of
the next sliding windows, information about the community structures derived from the
previous step, together with the user occurrences in the snapshots of that sliding window
are used to extract communities.
The posterior distribution of the model at sliding window Wt (t > 1) is computed based
on the user occurrences in the snapshots of Wt and the posterior distribution derived from
Wt−1 , which is presented as follows.
P (φt , θt , πt , ϕt , rt , ct , zt
|
Wt , φt−1 , πt−1 , ϕt−1 , α, η, σ) =
P (Wt , φt , θt , πt , ϕt , rt , ct , zt |φt−1 , πt−1 , ϕt−1 , α, η, σ)
P (Wt |φt−1 , πt−1 , ϕt−1 , α, η, σ)
(2)
The above posterior distribution is estimated by sampling from the joint distribution
of the model applied to the user occurrences in the snapshots of sliding window Wt , given
the information derived from the previous sliding window Wt−1 and the hyperparameters,
which is computed as follows.
P (Wt , φt , θt , πt , ϕt , rt , ct , zt |φt−1 , πt−1 , ϕt−1 , α, η, σ) =
P (ro |ηt )P (loco |locro , σ) ×
(I)
snt ∈Wt o∈snt
P (θt |α)
P (φt |φt−1 )
P (co |θt,ro ) ×
P (uo |φt,co )
snt ∈Wt o∈snt
(II)
o∈snt
snt ∈Wt
P (u |φt,co ) ×
(III)
P (zo |πt,co ) ×
(IV)
u ∈o.f
P (πt |πt−1 )
snt ∈Wt o∈snt
P (ϕt |ϕt−1 )
P (w|ϕt,zo )
(V)
snt ∈Wt o∈snt w∈o.msg
(3)
15
T. V. Canh, M. Gertz, D. H. Linh / ErLinkTopic: A generative probabilistic framework for...
Tab. 2: Notations used to present the count variables in the ErLinkT opic model. Each
variable is computed based on the user occurrences in the snapshots of one sliding window.
Notation
(r)
nc
(c)
nu
(c)
nf.u
(z)
nw
(c)
nz
Description
number of occurrences in region r that are assigned to community c
number of occurrences of user u that are assigned to community c
number of times user u is contextually linked by other users in community c
number of occurrences of term w that are assigned to topic z
number of messages in community c that are assigned to topic z
Adopting the notations defined in Table 4.2, the above joint distribution is simplified
so that the posterior distribution in Eq. 2 is then estimated as follows.
P (φt , θt , πt , ϕt , rt , ct , zt |Wt ; φt−1 , πt−1 , ϕt−1 , α, η, σ) ∝
P (ro |ηt )P (loco |locro , σ)×
snt ∈Wt o∈snt
n(r) +αc −1
θr,cc
(c)
n(c) +nf.u +φt−1;c,u −1
u
φt;c,u
×
r∈RWt c∈C
×
c∈C u∈U
n(c) +πt−1;c,z −1
z
πt;c,z
n(z) +ϕt−1;z,w −1
×
c∈C z∈Z
w
ϕt;z,w
(4)
z∈Z w∈V
By integrating out the multinomial parameters φt , πt , ϕt , and θt , the posterior distribution of the region assignments rt , community assignments ct , and topic assignments zt
of the user occurrences in the snapshots of sliding window Wt becomes
P (rt , ct , zt |Wt ; φt−1 , πt−1 , ϕt−1 , α, η, σ) ∝
P (ro |ηt )P (loco |locro , σ)×
snt ∈Wt o∈snt
(T1 )
r∈RWt
(r)
c∈C Γ(nc
(r)
Γ( c∈C nc
+ αc )
+ αc )
(c)
u∈U Γ(nu
×
(c)
c∈C Γ(
u∈U nu
(c)
+ nf.u + φt−1;c,u )
(c)
×
+ nf.u + φt−1;c,u )
(T3 )
(T2 )
(c)
z∈Z Γ(nz
(c)
c∈C Γ(
z∈Z nz
(T4 )
+ πt−1;c,z )
+ πt−1;c,z )
(z)
w∈V
×
z∈Z
Γ(
Γ(nw + ϕt−1;z,w )
(z)
w∈V
.
(5)
nw + ϕt−1;z,w )
(T5 )
From Eq. 5, the joint distribution of the region assignment ro , community assignment co ,
16
Vinh University
Journal of Science, Vol. 48, No. 2A (2019), pp. 9-28
and topic assignment zo of occurrence o is obtained as follows.
P (ro , co , zo |rt;−o , ct;−o , zt;−o , Wt ; φt−1 , πt−1 , ϕt−1 , α, η, σ) = P (ro |ηt )P (loco |locro , σ)×
(c )
(r )
o
n−o,c
+ αco
o
(r )
c∈C
o
n−o,c
+ αc
(c )
z∈Z
o
n−o,z
+ πt−1;co ,z
×
(c )
u∈U
×
(c )
o
n−o,u
+ nf.uo + φt−1;co ,u
nw .msg
(i − 1
w∈o.msg
i=1
n.msg
i=1 (i − 1 +
w∈V
(c )
o
n−o,z
+ πt−1;co ,zo
o
(c )
o
n−o,u
+ nf.uo o + φt−1;co ,uo
o
×
(z )
o
+ n−w,w
+ ϕt−1;zo ,w )
(z )
o
n−w,w
+ ϕt−1;zo ,w )
(6)
Finally, the sampling rule for each of the assignment variables ro , co , and zo is obtained
similarly to the corresponding sampling rule in the rLinkT opic model, which is presented
as follows.
1. Sampling rule for region assignment:
(r)
P (ro = r|co , zo , r−o , c−o , z−o , Wt ; ·) =
n−o,co + αco
P (r|ηt )P (loco |locr , σ) ×
∝
exp(−
(r)
c∈C n−o,c + αc
(r)
n−o,co + αco
(r)
c∈C n−o,c + αc
|loco , locr |
)×
σ2
(7)
2. Sampling rule for community assignment:
(c)
(c)
P (co = c|ro , zo , c−o , r−o , z−o , Wt ; ·) ∝
n−o,uo + n−o,f.uo + φt−1;c,uo
n−o,u + n−o,f.u + φt−1;c,u
(r )
o
+ αc
n−o,c
×
(r )
c ∈C
(c)
(c)
u∈U
o
n−o,c
+ αc
(c)
×
n−o,zo + πt−1;c,zo
(c)
z∈Z
(8)
n−o,z + πt−1;c,z
3. Sampling rule for topic assignment:
P (zo = z|ro , co , r−o , c−o , z−o , Wt ; ·) ∝
nw .msg
(i − 1
w∈o.msg
i=1
n.msg
i=1 (i − 1 +
w∈V
(z)
+ n−w,w + ϕt−1;zo ,w )
(z)
n−w,w + ϕt−1;zo ,w )
(c )
×
o
n−o,z
+ πt−1;co ,z
(c )
z ∈Z
o
n−o,z
+ πt−1;co ,z
(9)
Gibbs sampling algorithm. The Gibbs sampling algorithm for the ErLinkT opic
model is shown in Algorithm 1. Input of the algorithm is a sequence of sliding windows
SN = {W1 , W2 , ..., WT } and the hyperparameters. Hidden variables are first estimated for
the first sliding window W1 using the rLinkT opic model with the given hyperparameters.
From the second sliding window, the rLinkT opic model is employed in the way that the
values of φt−1 , πt−1 and ϕt−1 obtained from the previous sliding window are used as the
prior hyperparameters of model. Based on the sequence of each of these variables computed
over sliding windows, the evolution of communities regarding the community membership
17
T. V. Canh, M. Gertz, D. H. Linh / ErLinkTopic: A generative probabilistic framework for...
of users, the topic proportion of communities, and the distribution of terms in topics is
then analyzed. It is noted that ErLinkT opic has the same computational complexity as
rLinkT opic. For a snapshot snt having |Rt | regions, the computation for an occurrence
o at a sampling step has complexity O(|Rt | + |C| + |Z|). Therefore, the complexity of
the algorithm for a network of T snapshots and with I iterations for sampling will be
O(I × T × |snt | × (|Rt | + |C| + |Z|)).
Algorithm 1: Gibbs sampling algorithm for the ErLinkT opic probabilistic model.
Input:
SN = {W1 , W2 , ..., WT }: sequence of network sliding windows
|C|: number of communities to be extracted
|Z|: number of topics associated with communities
minRad: a threshold to determine representative locations of regions
σ: prior standard deviation for Gaussian
α, β, γ, µ: Dirichlet hyperparameters
Output:
set of evolving communities characterized by:
(1) θ = {θ1 , θ2 , ..., θT }: sequence of distributions of communities in regions
(2) φ = {φ1 , φ2 , ..., φT }: sequence of distributions of users in communities
(3) π = {π1 , π2 , ..., πT }: sequence of topic proportions of communities
(4) ϕ = {ϕ1 , ϕ2 , ..., ϕT }: sequence of distributions of terms in topics
1 /* first sliding window */
2 φ1 , π1 , ϕ1 , θ1 ← rLinkT opic(W1 , |C|, |Z|, α, β, γ, µ, minRad, σ);
3 /* from second sliding window */
4 foreach t = 2..T do
5
φt , πt , ϕt , θt ← rLinkT opic(Wt , |C|, |Z|, α, φt−1 , πt−1 , ϕt−1 , minRad, σ);
6
/* detect changes in community memberships of users */
7
detectChangesFrom(φt−1 , φt );
8
/* detect changes in topic proportions of communities */
9
detectChangesFrom(πt−1 , πt );
10
/* detect changes in topics of communities */
11
detectChangesFrom(ϕt−1 , ϕt );
Tab. 3: Statistics of T witter datasets used to evaluate the ErLinkT opic model in
extracting regional LinkT opic communities and analyzing their evolution.
Dataset
Sub-England
Sub-US
18
Users/Filtered
1.720.956/18.264
980.924/14.756
Tweets/Filtered
13.114.353 /6.572.764
6.301.435/3.654.000
Terms/Filtered
2.915.851/15.215
2.135.098/16.260
Time
June 01 - Nov 28
June 01 - Nov 28
Vinh University
5
Journal of Science, Vol. 48, No. 2A (2019), pp. 9-28
Experiments
This section presents the experimental results of applying our approach to extracting and
analyzing the evolution of regional LinkT opic communities in social networks. Particularly,
by using T witter data, we show the effectiveness and efficiency of the ErLinkT opic model
in terms of discovering communities and, at the same time, capturing changes in the features
describing communities. Our framework is implemented in Java. All experiments are run
on an Intel(R) Core(TM) i7-4770 CPU @ 3.40G with 16GB RAM, running Ubuntu 64bit.
5.1
Twitter Datasets
We use two six-month interval Twitter datasets collected from the EUROPE and US
for conducting the experiments. The first subset is called Sub-England dataset and the
second subset is called Sub-US dataset. A filtering step is applied so that users posting
less than 180 messages, i.e., on average 1 message a day, and terms occurring less than
360 times, i.e., on average 2 time a day, are removed from the Sub-US dataset. Such
numbers applied to filter users and terms in the Sub-England dataset are 180 and 540,
respectively. Relevant statistics of the two datasets before and after filtering users and
terms are summarized in Table 11. The main objective of our experiments is to extract
communities and capture their evolution from which to study how the features describing
a community evolve over time. Besides this, it is also necessary to verify the efficiency of
the ErLinkT opic model regarding the computational complexity.
5.2
Evaluation measures
To study the evolution of features associated with communities, the following notations
are introduced, given the parameters numU, numZ, and numV .
1. U (c, t, numU ): set of numU users that have the highest likelihood in community c at
sliding window Wt .
2. Z(c, t, numZ): set of numZ topics that have the highest likelihood in community c
at Wt .
3. V (z, t, numV ): set of numV terms that have the highest likelihood in topic z at Wt .
Based on these notations, the evolution of a community with respect to the community
members, community topics, and terms in topics is formalized in the following sections.
Dynamics of users. To capture the dynamics of users in community c over two consecutive sliding windows Wt−1 and Wt , we introduce a user dynamic measure ∂φ (c, t −
1, t, numU ), computed as follows.
∂φ (c, t − 1, t, numU ) =
numU − |U (c, t − 1, numU ) ∩ U (c, t, numU )|
∈ [0, 1]
numU
(10)
19
T. V. Canh, M. Gertz, D. H. Linh / ErLinkTopic: A generative probabilistic framework for...
Topic-prominence dynamic. The ∂π (c, t − 1, t, numZ) is defined to determine the
frequency of updating the prominence of the topics associated with community c.
∂π (c, t − 1, t, numZ) =
numZ − |Z(c, t − 1, numZ) ∩ Z(c, t, numZ)|
∈ [0, 1]
numZ
(11)
Term dynamic. Finally, the ∂ϕ (z, t − 1, t, numV ) is defined to measure the frequency
of changes of terms occurring in a topic z.
∂ϕ (z, t − 1, t, numV ) =
5.3
numV − |V (z, t − 1, numV ) ∩ V (z, t, numV )|
∈ [0, 1]
numV
(12)
Dynamic Measure Analysis
Based on the results extracted from the three different settings of sliding windows, i.e., 1week interval, 2-week interval, and 1-month interval, we study the dynamics of communities
in terms of changes in (1) the members of each community using the user dynamic measure
∂φ (c, t − 1, t, numU ), (2) the prominence of topics associated with each community using
the topic-prominence dynamic measure ∂π (c, t − 1, t, numZ), and (3) terms occurring in
each community topic using the term dynamic measure ∂ϕ (z, t − 1, t, numW ). We visualize
the community membership of users in each community and the likelihood of terms in each
topic to determine appropriate values for numU and numW , respectively. By studying
the community membership of users, we find two prevalent points at numU = 5 and
numU = 30 where the likelihood of users in every community strongly decreases. However,
the top 5 users in all communities change frequently at every sliding window. We therefore
select numU = 30 for evaluating the dynamics of users in communities. Applying the same
method we determine that a good value for numW is 20.
Finally, we choose numZ = 5 for measuring the dynamics of the prominence of community topics. The following findings are obtained from both two datasets.
1. Communities evolve gradually over a short time interval of sliding windows. This
evolving trend applies to all three features of interests, i.e., community members,
community topics, and terms describing a topic. Changes to these features happen
more often when longer time intervals are employed to form a sliding window. This
finding confirms that social networks and especially communities in social networks
are dynamic structures.
2. Community members evolve faster than community topics, which is indicated by a
larger value of ∂φ (c, t − 1, t, numU ) compared to the value of ∂π (c, t − 1, t, numZ)
or ∂ϕ (z, t − 1, t, numW ). This implies that the topics discussed by a community are
more stable regarding both the topic prominence and terms describing topics even
though users might change topics of interest and leave a community and join other
communities more often. The dynamic measures of three communities extracted from
the Sub-US dataset and five communities extracted from the Sub-England dataset
are presented in Table 5.3 and Table 5.3, respectively.
20
Vinh University
Journal of Science, Vol. 48, No. 2A (2019), pp. 9-28
Tab. 4: Dynamic measures computed at the first five sliding windows for three selected
communities extracted from the Sub-US dataset.
Two selected politics communities:
1-week interval
Sliding Window
∂φ
∂π
∂ϕ
01
0.40 0.20 0.35
02
0.60 0.20 0.40
03
0.63 0.40 0.25
04
0.53 0.40 0.35
05
0.66
0.0
0.45
Average
0.56 0.24 0.36
01
0.56 0.20 0.20
02
0.76 0.20 0.30
03
0.70 0.20 0.20
04
0.66
0.0
0.15
05
0.56
0.0
0.20
Average
0.65 0.12 0.21
Two selected job communities:
1-week interval
Sliding Window
∂φ
∂π
∂ϕ
01
0.66 0.10 0.20
02
0.63 0.20 0.25
03
0.76 0.20 0.20
04
0.66
0.0
0.25
05
0.76
0.0
0.15
Average
0.69 0.10 0.21
01
0.76 0.20 0.20
02
0.63 0.20 0.25
03
0.66
0.0
0.20
04
0.70
0.0
0.25
05
0.60
0.0
0.15
Average
0.67 0.08 0.21
Two selected weather community:
1-week interval
Sliding Window
∂φ
∂π
∂ϕ
01
0.63 0.30 0.25
02
0.70
0.0
0.45
03
0.66
0.0
0.50
04
0.66
0.0
0.40
05
0.76
0.0
0.30
Average
0.68 0.06 0.38
01
0.66 0.20 0.45
02
0.50 0.30 0.55
03
0.63
0.0
0.25
04
0.50
0.0
0.30
05
0.56 0.20 0.15
Average
0.59 0.14 0.34
2-week interval
∂φ
∂π
∂ϕ
0.73 0.60 0.40
0.76 0.40 0.40
0.70 0.40 0.35
0.63 0.40 0.60
0.76 0.20 0.35
0.71 0.40 0.41
0.76 0.40 0.30
0.70 0.20 0.25
0.73 0.20 0.10
0.66 0.40 0.15
0.63 0.30 0.30
0.70 0.30 0.22
1-month interval
∂φ
∂π
∂ϕ
0.93 0.40 0.30
0.93 0.40 0.40
0.96 0.40 0.65
0.93 0.40 0.70
0.70 0.40 0.75
0.89 0.40 0.56
0.86 0.40 0.55
0.96 0.40 0.68
0.96 0.40 0.60
0.86 0.60 0.72
0.90 0.60 0.62
0.91 0.48 0.63
2-week interval
∂φ
∂π
∂ϕ
0.76 0.40 0.40
0.86 0.40 0.40
0.86 0.20 0.35
0.93 0.60 0.60
0.80 0.80 0.10
0.84 0.48 0.37
0.75 0.60 0.35
0.73 0.20 0.40
0.80 0.60 0.65
0.76 0.20 0.55
0.63 0.40 0.55
0.73 0.40 0.50
1-month interval
∂φ
∂π
∂ϕ
0.86 0.60 0.35
1.00 0.40 0.45
0.93 0.60 0.60
1.00 0.20 0.70
0.86 0.40 0.80
0.93 0.44 0.58
0.85 0.40 0.60
0.80 0.40 0.65
0.93 0.60 0.55
0.96 0.40 0.70
0.93 0.50 0.50
0.89 0.46 0.60
2-week interval
∂φ
∂π
∂ϕ
0.63 0.60 0.40
0.70 0.60 0.45
0.76 0.20 0.50
0.86 0.80 0.55
0.66 0.60 0.45
0.72 0.56 0.47
0.73 0.40 0.50
0.76 0.40 0.40
0.80 0.10 0.60
0.73 0.20 0.55
0.70 0.40 0.60
0.74 0.30 0.53
1-month interval
∂φ
∂π
∂ϕ
0.90 0.40 0.40
1.00 0.20 0.70
0.93 0.60 0.75
0.96
0.0
0.70
0.93 0.60 0.70
0.94 0.36 0.65
0.83 0.40 0.55
0.93 0.40 0.50
1.00 0.40 0.55
0.86 0.20 0.65
0.93 0.40 0.70
0.91 0.36 0.59
21
T. V. Canh, M. Gertz, D. H. Linh / ErLinkTopic: A generative probabilistic framework for...
Tab. 5: Dynamic measures computed at the first five sliding windows for five selected
communities extracted from the Sub-England dataset.
A selected football community:
1-week interval
2-week interval
Sliding Window
∂φ
∂π
∂ϕ
∂φ
∂π
∂ϕ
01
0.40
0.0
0.35
0.63 0.20 0.50
02
0.53 0.20 0.40
0.73
0.0
0.45
03
0.50
0.0
0.35
0.76 0.20 0.35
04
0.53 0.20 0.45
0.80
0.0
0.50
05
0.46
0.0
0.45
0.83 0.20 0.60
Average
0.48 0.08 0.40 0.75 0.12 0.48
A selected social media community:
1-week interval
2-week interval
Sliding Window
∂φ
∂π
∂ϕ
∂φ
∂π
∂ϕ
01
0.46
0.0
0.20
0.66
0.0
0.25
02
0.53
0.0
0.25
0.70
0.0
0.35
03
0.66 0.20 0.25
0.76 0.20 0.30
04
0.66
0.0
0.35
0.86
0.0
0.40
05
0.56 0.20 0.15
0.86 0.40 0.25
Average
0.57 0.08 0.24 0.76 0.12 0.31
A selected weather community:
1-week interval
2-week interval
Sliding Window
∂φ
∂π
∂ϕ
∂φ
∂π
∂ϕ
01
0.45 0.20 0.20
0.76 0.20 0.45
02
0.51
0.0
0.30
0.80 0.20 0.35
03
0.53
0.0
0.22
0.73
0.0
0.30
04
0.60 0.20 0.40
0.73 0.40 0.40
05
0.55 0.20 0.10
0.60 0.20 0.55
Average
0.53 0.12 0.24 0.72 0.20 0.41
A selected food community:
1-week interval
2-week interval
Sliding Window
∂φ
∂π
∂ϕ
∂φ
∂π
∂ϕ
01
0.45 0.20 0.10
0.73 0.20 0.40
02
0.50
0.0
0.30
0.66
0.0
0.75
03
0.30 0.20 0.20
0.76 0.30 0.35
04
0.50 0.20 0.15
0.83 0.20 0.25
05
0.53
0.0
0.20
0.63
0.0
0.50
Average
0.46 0.12 0.19 0.72 0.14 0.45
A selected music and event community:
1-week interval
2-week interval
Sliding Window
∂φ
∂π
∂ϕ
∂φ
∂π
∂ϕ
01
0.30
0.0
0.20
0.63
0.0
0.25
02
0.40 0.20 0.30
0.73 0.20 0.45
03
0.45
0.0
0.32
0.76 0.20 0.80
04
0.41
0.0
0.20
0.80
0.0
0.35
05
0.50 0.20 0.35
0.73 0.40 0.50
Average
0.41 0.08 0.27 0.73 0.16 0.47
22
1-month interval
∂φ
∂π
∂ϕ
0.73 0.40 0.60
0.83 0.20 0.50
0.86 0.20 0.65
0.83 0.20 0.60
0.70 0.40 0.65
0.79 0.28 0.60
1-month interval
∂φ
∂π
∂ϕ
0.76 0.20 0.35
0.86 0.40 0.45
0.83 0.20 0.60
0.80 0.20 0.50
0.86 0.20 0.40
0.82 0.24 0.46
1-month interval
∂φ
∂π
∂ϕ
0.75 0.40 0.50
0.80 0.20 0.40
0.85 0.20 0.55
0.75 0.20 0.65
0.83 0.40 0.50
0.80 0.32 0.52
1-month interval
∂φ
∂π
∂ϕ
0.80 0.20 0.50
0.83 0.20 0.40
0.73 0.40 0.55
0.90 0.20 0.30
0.85 0.40 0.60
0.82 0.28 0.47
1-month interval
∂φ
∂π
∂ϕ
0.72 0.20 0.40
0.80 0.20 0.60
0.65 0.20 0.55
0.85 0.40 0.45
0.80 0.40 0.40
0.76 0.28 0.48
Vinh University
5.4
Journal of Science, Vol. 48, No. 2A (2019), pp. 9-28
Evolving Communities
Example communities extracted from the Sub-US dataset are presented in this section
to demonstrate the effectiveness of the ErLinkT opic model in extracting evolving communities. For this purpose, topics associated with communities extracted by the model are first
manually classified into the groups politics, jobs, social activities, weather, music and social
events, social media, social networks, sports, and general. A topic is labeled as general if
terms occurring in that topic are about different subjects making it unclear for a classification. We manually label each community based on the prominence of topics associated with
it. Generally, each community is associated with at most two topics at a time point. The
evolution of each community is characterized by changes in the community membership of
users, the prominence of topics, and the likelihood of terms in each topic as well. Evolving
phenomena that are observed from communities extracted from our datasets include the
stability, generalization, specification, and shifting of the prominence of topics associated
with a community; the growth and shrinkage of community members; and the stability
of terms describing topics. In our experiments, we rarely find the stability of community
members, especially when a sliding window of more than 2-week interval is applied. This indicates that users in social networks in general and particularly T witter users are dynamic
in terms of posting messages associated with contextual links of different topics reflecting
their complex life and changing geographic locations over time.
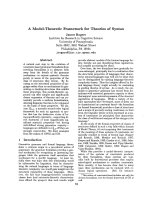
As an example, we find an interesting trend from the Sub-US dataset that communities
characterized by a job topic tend to shift their interest to politics before the election in the
US in 2012. Figure 5.4 shows an example. At first, this community is associated with
a topic described by terms about jobs (the topic indexed 19) during August 2012. The
shifting of topics happens at the beginning of September 2012, where the likelihood of the
topic described by terms about politics (the topic indexed 16) increases. By the end of
September 2012, the community is characterized by only the politics topic.
5.5
Evaluation of Runtime
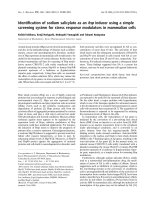
This section discusses the running time of the ErLinkT opic algorithm applied to the
datasets used in the experiments presented. Particularly, for each time interval of sliding
windows, we measure the running time of the algorithm using three different settings of the
number of iterations for sampling. In the first setting, the model is run with 820 steps for the
Burn-In stage and 180 steps for collecting assignment samples and updating multinomial
parameters. The results (i.e., the communities, topics, and their evolution) presented in
this paper are derived from this configuration. In the second setting, 700 steps for the
Burn-In stage and 100 steps for collecting assignment samples and updating multinomial
parameters are employed. Such steps of iterations for the last setting are 600 and 100,
respectively. The results show that for each dataset the model takes almost the same time
when it is run with different time intervals of sliding windows, given that the same number
of communities |C| and number of topics |Z| are assigned to the model. Also, the running
time of the algorithm increases linearly to the number of iterations and the number of
communities applied. Details of the evaluations are summarized in Figure 5.4.
23
T. V. Canh, M. Gertz, D. H. Linh / ErLinkTopic: A generative probabilistic framework for...
August 01 − 15
0.014
Community Membership
0.000
August 16 − 30
0.014
0.000
September 01 − 15
0.014
0.000
September 16 − 30
0.014
Screamt
Dannyja
Berniem
Ohthats
Mikeywh
Asapmam
Goldenb
Nachock
Serenas
Labroid
Rossmar
Laynabr
Jennnaa
Devourt
Mrsteal
Nadiahe
Billyho
Michael
Eddiexo
Joshuac
Krisdul
Giaeure
Nekaros
Rickyma
Safeand
Helloro
Amandam
Aliciam
Kaylalu
Evelove
Rudegal
Spindol
Citydel
Geebebe
Findsor
Redhotr
Forgetr
Badawim
Wassthe
Spoilbr
0.000
Topic Likelihood
(a) Community membership of users
August 01 − 15
0.5
August 16 − 30
0.5
0.0
0.0
0
3
5
7
9
11
13
15
18
September 01 − 15
0.5
0
3
7
9
11
13
15
18
15
18
September 16 − 30
0.5
0.0
5
0.0
0
3
5
7
9
11
13
15
18
0
3
5
7
9
11
13
Topic Index
(b) Prominence of topics associated with the community
Fig. 3: The evolution of community members and the shifting of the prominence of a
topic about jobs (indexed 19) to a topic about politics (indexed 16) of a community
discovered from the Sub-US dataset.
24
Vinh University
Journal of Science, Vol. 48, No. 2A (2019), pp. 9-28
Average run time per each sliding window
70
60
30
40
50
1−Week Window: C=70,Z=20
2−Week Window: C = 40, Z= 20
1−Month Window: C = 30, Z = 20
300
20
Run time (minutes)
400
450
1−Week Window: C=70,Z=20
2−Week Window: C = 40, Z= 20
1−Month Window: C = 30, Z = 20
350
Run time (minutes)
500
Run time over all sliding windows
700
750
800
850
900
950
1000
700
750
Iteration Steps
800
850
900
950
1000
Iteration Steps
(c) Sub-England dataset
Average run time per each sliding window
15
10
5
90
85
80
1−Week Window: C=40,Z=20
2−Week Window: C = 30, Z= 20
1−Month Window: C = 25, Z = 20
70
75
Run time (minutes)
95
1−Week Window: C=40,Z=20
2−Week Window: C = 30, Z= 20
1−Month Window: C = 25, Z = 20
Run time (minutes)
20
100
Run time over all sliding windows
700
750
800
850
900
950
1000
700
Iteration Steps
750
800
850
900
950
1000
Iteration Steps
(d) Sub-US dataset
Fig. 4: Running time of the ErLinkT opic algorithm applied to the Sub-England dataset
(c) and Sub-US dataset (d). Three time intervals (1 week, 2 weeks, and 1 month) are
employed to create sliding windows. For each time interval, three settings of the number of
iterations (700, 800, and 1000) are used in the ErLinkT opic algorithm.
25
T. V. Canh, M. Gertz, D. H. Linh / ErLinkTopic: A generative probabilistic framework for...
6
Conclusion
We have presented a probabilistic model called ErLinkT opic to analyze regional linktopic communities. Important features that have not been considered in existing studies,
i.e., capturing and analyzing the evolution of community attributes, are addressed in our
framework. There are aspects in the proposed framework that we would like to study in
order to improve the model. First, in this framework, regions are derived from the density of
geographic locations of users within each snapshot. This implies an assumption that regions
might change over time. Because of this, the model ignores the evolution of the community
distribution in each region. There should be an improvement for the model in a way that
it is able to capture region evolution as well. Second, due to the lack of ground truth
in real-world datasets, evaluating the results of extracting feature-based communities and
analyzing their evolution is a challenging task. Finally, in our framework, we assume there
are no changes in the number of communities |C| and the number of topics |Z| across time.
It should be more appropriate if a Dirichlet process is employed so that these constraints
are relaxed.
REFERENCES
[1] Canh T. V., Gertz M., “rlinktopic: A probabilistic model for discovering regional linktopic
communities,” In ASONAM 2014, eds. Wu X., Ester M., Xu G., IEEE Computer Society,
2014, pp. 24-26.
[2] Kernighan, B.W., Lin S.. “An Efficient Heuristic Procedure for Partitioning Graphs”,
The Bell system technical journal, 49(1), pp. 291-307, 1970.
[3] Newman M. E. J., Girvan M., “Finding and evaluating community structure in networks”,
Pattern Recognition Letters, 69(5), pp. 413-421, 2004.
[4] Ruan J., Zhang W., “An efficient spectral algorithm for network community discovery
and its applications to biological and social networks,” In Proceedings of the 2007, Seventh
IEEE International Conference on Data Mining. ICDM ’07, Washington, DC, USA, IEEE
Computer Society, 2007, pp. 643-648.
[5] Pathak A. B. N., Erickson K., “Social topic models for community extraction,” In The
2nd SNA-KDD Workshop ’08 (SNA-KDD’08), Las Vegas, Nevada, USA, 2008.
[6] Sachan M., Contractor D., Faruquie T. A., Subramaniam L. V., “Using content and
interactions for discovering communities in social networks,” In Proceedings of the 21st
International Conference on World Wide Web. WWW ’12, New York, NY, USA, ACM,
2012, pp. 331-340.
[7] Zheng G., Guo J., Yang L., Xu S., Bao S., Su Z., Han D., Yu Y., “Mining topics on
participations for community discovery,” In Proceedings of the 34th international ACM
SIGIR conference on Research and development in Information Retrieval. SIGIR ’11, New
York, NY, USA, ACM, 2011, pp. 445-454.
26
Vinh University
Journal of Science, Vol. 48, No. 2A (2019), pp. 9-28
[8] Asur S., Parthasarathy S., Ucar D., “An event-based framework for characterizing the
evolutionary behavior of interaction graphs,” In Proceedings of the 13th ACM SIGKDD
International Conference on Knowledge Discovery and Data Mining, San Jose, California,
USA, ACM, 2007, pp. 913-921.
[9] Chakrabarti D., Kumar R., Tomkins A., “Evolutionary clustering,” In Proceedings of the
12th ACM SIGKDD International Conference on Knowledge discovery and Data Mining,
KDD ’06, New York, USA, ACM, 2006, pp. 554-560.
[10] Lin Y. R., Chi Y., Zhu S., Sundaram H., Tseng B. L, “Analyzing communities and their
evolutions in dynamic social networks,” ACM Trans. Knowl. Discov. Data, 3(2) 8:1–8:31,
2009.
[11] Lin Y. R., Sun J., Sundaram H., Kelliher A., Castro P., Konuru R., “Community
discovery via metagraph factorization,” ACM Trans. Knowl. Discov. Data, 5(3), 17:1–17:44,
2011.
[12] Costa G., Ortale R., “A bayesian hierarchical approach for exploratory analysis of
communities and roles in social networks,” In ASONAM, IEEE Computer Society, 2012,
pp. 194-201.
[13] Natarajan N., Sen P., Chaoji V., “Community detection in content-sharing social networks”, In Proceedings of the 2013 IEEE/ACM International Conference on Advances in
Social Networks Analysis and Mining. ASONAM ’13, New York, NY, USA, ACM,2013, pp.
82–89.
[14] Zeng Z., Wu B., “Detecting probabilistic community with topic modeling on sampling
subgraphs,” In ASONAM, IEEE Computer Society, 2012, pp. 623-630.
[15] Zhou D., Manavoglu E., Li J., Giles, C.L., Zha, H., “Probabilistic models for discovering
e-communities”, In Proceedings of the 15th International Conference on World Wide Web.
WWW ’06, New York, NY, USA, ACM, 2006, pp. 173-182.
[16] Spiliopoulou M., Ntoutsi I., Theodoridis, Y., Schult, R. “Monic: modeling and monitoring cluster transitions,” In Proceedings of the 12th ACM SIGKDD International Conference
on Knowledge discovery and Data Mining. KDD ’06, New York, NY, USA, ACM, 2006,
pp. 706-711.
[17] Palla G., Derúnyi I., Farkas I., Vicsek T., “Uncovering the overlapping community
structure of complex networks in nature and society,” Nature, 435(7043), pp. 814-818,
2005.
[18] Palla G., lászló Barabási A., Vicsek T., Hungary B., “Quantifying social group evolution,” Nature, 446, 2007.
[19] Lin Y. R., Chi Y., Zhu S., Sundaram H., Tseng,B. L., “Facetnet: a framework for
analyzing communities and their evolutions in dynamic networks,” In: Proceedings of the
17th International Conference on World Wide Web. WWW ’08, New York, NY, USA,
ACM, 2008, pp. 685-694.
[20] Dhillon I. S., Sra S., “Generalized nonnegative matrix approximations with Bregman
27
T. V. Canh, M. Gertz, D. H. Linh / ErLinkTopic: A generative probabilistic framework for...
divergences,” In Neural Information Proc. Systems, pp. 283–290, 2005.
[21] Chi Y., Song X., Zhou D., Hino K., Tseng B. L., “Evolutionary spectral clustering by
incorporating temporal smoothness,” In Proceedings of the 13th ACM SIGKDD International Conference on Knowledge discovery and Data Mining. KDD ’07, New York, NY,
USA, ACM, 2007, pp. 153-162.
[22] Chi Y., Song X., Zhou D., Hino K., Tseng B. L., “On evolutionary spectral clustering,”
ACM Trans. Knowl. Discov. Data, 3(4), 17:1–17:30, 2009.
[23] Hofman J.M., Wiggins C.H., “A bayesian approach to network modularity,” Physical
Review Letters, 100(25), pp. 1–4, 2007.
[24] Yang T., Chi Y., Zhu S., Gong Y., Jin R., “Detecting communities and their evolutions
in dynamic social networks-a bayesian approach,” Machine Learning, 82, pp. 157–189, 2001.
DOI: 10.1007/s10994-010-5214-7.
TÓM TẮT
MÔ HÌNH SINH XÁC SUẤT PHÁT HIỆN VÀ HỖ TRỢ
PHÂN TÍCH NHÓM CỘNG ĐỒNG TRÊN MẠNG XÃ HỘI
Bài báo này giới thiệu mô hình xác xuất sinh dữ liệu có khả năng học cấu trúc và hỗ
trợ phân tích sự phát triển của các nhóm cộng đồng trên mạng xã hội được xác định dựa
trên các tiêu chí về vùng không gian địa lý (region), chủ đề quan tâm (topic), và tương
tác (interaction). Chúng tôi trình bày chi tiết mô hình sinh xác suất (generative model)
ErLinkT opic từ việc mở rộng mô hình rLinkT opic [1] và thuật toán Gibbs sampling tương
ứng. Kết quả đánh giá thuật toán bằng việc sử dụng dữ liệu từ mạng xã hội Twitter cho
thấy các kết quả khá thú vị khẳng định tính khả thi của thuật toán.
28