Students’ activities in, perceptions of and expectations for elearning: A case in Indonesia
Bạn đang xem bản rút gọn của tài liệu. Xem và tải ngay bản đầy đủ của tài liệu tại đây (553.55 KB, 17 trang )
Knowledge Management & E-Learning, Vol.10, No.1. Mar 2018
Students’ activities in, perceptions of and expectations for elearning: A case in Indonesia
Guspatni
Universitas Negeri Padang, West Sumatra, Indonesia
Knowledge Management & E-Learning: An International Journal (KM&EL)
ISSN 2073-7904
Recommended citation:
Guspatni. (2018). Students’ activities in, perceptions of and expectations
for e-learning: A case in Indonesia. Knowledge Management & ELearning, 10(1), 97–112.
Knowledge Management & E-Learning, 10(1), 97–112
Students’ activities in, perceptions of and expectations for elearning: A case in Indonesia
Guspatni*
Department of Chemistry
Universitas Negeri Padang, West Sumatra, Indonesia
E-mail: or
*Corresponding author
Abstract: In this study, 52 students in Padang, West Sumatra, Indonesia used
an e-learning system to study a chemistry topic. Students’ e-learning activities
were recorded, and their perceptions and expectations regarding e-learning
were determined via an open-ended questionnaire after the study. There were
more students who perceived e-learning as a difficult system to use than those
who found it suitable. Most students did only few quizzes and spent less time
on e-learning materials. Low activity in e-learning was related to conventional
classroom instruction that had been accustomed practice and to the difficulty of
reading materials on the screen. This study found students’ expectations for elearning in terms of design, content, and learning atmosphere. First, it is
important to design a readable website by choosing the best line length, line
height, font style, font size, and font-background color combination. Next, the
provision of instructional videos and pictures, comprehensive resources and
worked-out examples would develop students’ self-confidence to learn through
e-learning. Lastly, social features namely synchronous discussion forum and
display of online users were noted to sustain students’ interest in e-learning.
Keywords: e-Learning; Design; e-Learning content; e-Learning atmosphere;
Learning activities; Perception; Expectation; Indonesia
Biographical notes: Guspatni is a lecturer in the Department of Chemistry,
Universitas Negeri Padang, West Sumatra, Indonesia. She received her
Master’s degree in Technology and Learning from University of NebraskaLincoln, USA. Her research interests include technology-enhanced learning,
multiple representations in chemistry learning, and memory and cognition.
1. Introduction
Covering all prescribed content is a teaching challenge. Conflicting academic activities,
time constraints, limited classroom access, and unexpected interruptions for national and
institutional activities are some common problems found in Indonesian university settings.
Lecturers cram much content into few full days or assign students to read materials and
do assignments with little opportunity to provide them feedback regarding their learning.
For instance, general chemistry consists of eight broad topics and is taught in 16 x150
minutes in the semester. Due to situational problems, lecturers skip some materials to
finish topics which are considered more difficult and then expect students to study the
materials independently. On the other hand, students are accustomed to direct supervision
and control from lecturers during study. Students cannot comprehend the concept if
98
Guspatni (2018)
lecturers do not give direct teaching and assignment. Unfortunately, these problems cause
students to neither learn the lesson nor get any feedback for self-assessment.
In an attempt to address these issues, e-learning was introduced to general
chemistry course in an undergraduate chemistry class. e-Learning was delivered through
a website that contained learning materials, quizzes and their corresponding feedbacks,
and links to important references and videos accessible at all time in the semester.
Feedback has a very big influence in learning (Hattie & Timperly, 2007) but it gives
challenges for teacher to provide it (Ramani & Krackov, 2012). In this study, feedback
was incorporated in the website and was given after students submitted the quizzes. Each
quiz was followed by an effective, automatic and immediate feedback for it engaged
students to correct their mistakes (Thurlings, Vermeulen, Bastiaens, & Stijnen, 2013).
Software-programmed feedback gives such a great value for both students and teachers
because it is clear, easy to read, easy to understand, quick and consistent, and it can
reduce teachers’ workload (Debuse, Lawley, & Shibl, 2008; Denton, Madden, Roberts, &
Rowe, 2008).
The use of e-learning enhances chemistry teaching and increases students’ interest
to learn chemistry (Awad, 2014). e-Learning that consists of video tutorials, problem
tutorials, homework activities, and web-based teaching learning is a flexible tool to
improve students’ mastery of chemistry problem solving and has a significant positive
impact on students’ performance (Dori, Barak, & Adir, 2003; Eichler & Peeples, 2013;
He, Swenson, & Lents, 2012; O’Sullivan & Hargaden, 2014). This pilot study was
carried out to introduce e-learning to chemistry instruction in Padang, West Sumatra,
Indonesia and then examine students’ activities, perceptions, and expectations in studying
chemistry topic through e-learning. Time spent on learning material pages and number of
quizzes completed were recorded to obtain general description of students’ activities in elearning. What give value to this study are the setting and the context of the study that
add a new dimension to the existing literature.
2. Conceptual framework
e-Learning is defined as technology-based especially Internet-enabled learning
(Gunasekaran, McNeil, & Shaul, 2002), be it web-based, web-distributed or web-capable
learning (Nichols, 2003). e-Learning is not only for distance learning but also for
complementary of face-to-face instruction (Anand, Saxena, & Saxena, 2012). It can be
done either synchronously or asynchronously (Nichols, 2003; Welsh, Wanberg, Brown,
& Simmering, 2003). [Synchronous e-learning requires learners to be online at the same
time during instruction; Asynchronous e-learning usually allows students freedom of
choosing when to engage the content.]
The benefits offered by e-learning have led to widespread adoption by educational
institutions, business and governmental agencies around the world. In the US, the growth
of e-learning in colleges and universities has resulted in greater access and scheduling
flexibility (Bell & Federman, 2013). In rural areas, e-learning develops social and mental
ability and fills the gap between educated developed cities and rural undeveloped areas
(Anand et al., 2012). Other benefits of e-learning include cost effectiveness, lifelong
learning, global customers, just in-time access to knowledge, personalization and
diversity, collaboration and interactivity, working-learning lines blur, tracking
improvement, and information overload lessening (Agariya & Singh, 2012; Gunasekaran
et al., 2002; Waight, Willging, & Wentling, 2002; Welsh et al., 2003).
Knowledge Management & E-Learning, 10(1), 97–112
99
Students who find the system easy to use and useful for their course work have a
positive attitude towards e-learning (Adewole-Odeshi, 2014). Learners’ attitude and
satisfaction are affected by computer anxiety, instructor attitude towards e-learning, elearning course flexibility, e-learning course quality, and diversity in assessments (Bertea,
2009; Sun, Tsai, Finger, Chen, & Yeh, 2008). Yet, other study by Keller and Cernerud
(2002) revealed that the implementing strategy is more significant in influencing
students’ attitude towards e-learning than students’ background (previous knowledge of
computers, attitude towards new technologies, gender, age, and learning style). Students
discover that e-learning appears to be at least as effective as traditional instructor-led
methods such as lectures (Ruiz, Mintzer, & Leipzig, 2006). The likelihood that a student
will continue to use e-learning is predicted by student’s self-efficacy and motivation
(Liaw & Huang, 2011).
For an effective use, e-learning should be underpinned on explicit theories,
principles and pedagogies (Nichols, 2003). Abrami, Bernard, Bures, Borokhovski, and
Tamim (2011) summarized four learning principles that must be met for the usefulness of
e-learning including self-regulation theories, multimedia learning principles, motivational
design principles, and collaborative and cooperative learning principles. In regard to this,
several e-learning platforms participate to provide the best e-learning system. With these
platforms, e-learning can be designed so that it does not only provide cognitive content,
but also provides features to meet motivational, social, and multimedia learning
principles. The most extensively used e-learning tools are Moodle, Sloodle, LectureShare,
BlackBoard, Blogs, Wikis, Emails, Messenger, and e-learning 2.0 (Kumbhar, 2009).
Instructors may choose any platform that best suits the goal of learning. In fact, it is not
the platform or the tool but the way it is used, managed, and aided to achieve learning
goal that will serve the most important factor in e-learning (Keller & Cernerud, 2002;
Nichols, 2003).
In this study researcher used LiveCode to design e-learning website. LiveCode is
a programming language created by Runtime Revolution Ltd. from Edinburgh, Scotland,
United Kingdom. LiveCode uses a high level, english-like programming language that is
dynamically typed. The language contains advanced features including associative arrays,
regular expressions, support for a variety of SQL databases, and TCP/IP libraries
( Using these features, pages for learning
material, quiz, and discussion were made. For research data, e-learning accesses which
included learning material pages visited and the access time (determined from GuidePage
record) and number of quizzes done (determined from makeTest and checkTest records)
were recorded. Access duration on learning material page was considered as the time that
students spent to read learning material, thus it was regarded as learning activity. In
addition, activity in quiz was also considered as learning activity, for the quizzes were
aimed to guide students learn the material. Therefore, this study addressed the following
research questions:
•
To what extent do students read learning material in e-learning?
•
•
Can students complete all the quizzes in e-learning?
What are students’ perceptions and expectations in studying chemistry through
e-learning?
100
Guspatni (2018)
3. Methodology
3.1. Context and setting
Participants of the study were students who took general chemistry course in the
Department of Chemistry, Universitas Negeri Padang, Padang, West Sumatra, Indonesia.
56 students were registered in the course, but four of them never logged on to e-learning
website changing the total number of research participants to 52 students. Students were
asked but not forced to take e-learning course. Students who did not want to take elearning could attend other regular class without restriction on the grade.
Padang, a city where the study was carried out, is the capital city of West Sumatra
province, Indonesia. Padang has a width of about 695 km2 and a population of around
one million people, and it has become the center of education in the province
( According to SPEEDTEST (www.speedtest.net),
the average Internet connections in Padang were 2 Mbps and 0.5 Mbps for download and
upload speeds respectively. The speeds were quite slow, but users could get faster
Internet connection by choosing better Internet plans. In this study, students could access
the Internet freely through LAN or Wi-Fi at the university. In addition, they could pay
rent access at an Internet Café or purchase an Internet package sold by cellular companies.
Thus, students were given cash to acquire adequate Internet access off campus.
Participating students were provided an e-learning experience in nuclear
chemistry, a general chemistry course topic. e-Learning was delivered through a website
containing learning materials, quizzes, and links to important references and videos. The
materials were suited to those stated in the curriculum. In addition, links to important
references were provided on the pages. The quizzes were in multiple-choice, matching,
order sequencing, essay, and short answer formats. Students needed to choose, match,
order or fill in the right answer to the questions. Students would get immediate feedback
for the quizzes submitted. When it was wrong, students could redo the same quiz which
displayed either the same or similar question. The website was adopted from one created
by Brooks et al. (2007) from University of Nebraska Lincoln, Nebraska, USA.
3.2. Design of e-learning website
Chen, Lee, and Chen (2005) found that information overload, disorientation, and adaptive
mechanism deficiencies in web-based learning place a large burden on learners.
Therefore, in current e-learning website, different concepts or materials were grouped
into subcategories developed as separate pages. e-Learning website consisted of 47
learning material pages. Each page was connected to other pages using previous and next
button navigations. When needed, extra information about a specific concept was
accessible through “blue linked-words or phrases” in the text. Learning materials on each
page were mostly displayed in a text form. On average, there were about 94 words
(excluding number, exponential, table, and chemical equation) on each page. Moreover,
there were diagrams, pictures and tables on certain pages to explain the concepts. To
assess students’ understanding, 55 quizzes were offered on almost all of the pages.
Access to the quiz was through green rectangle button on the page. After a student
submitted an answer, immediate feedback was provided. In addition to learning material
pages, e-learning website also consisted of one main menu page, one discussion page,
and one list of topics page. After students logged on to the course, they would be directed
to main menu page where the links to discussion page and list of topics page were
provided. On list of topics page, students could choose any topic and go to its
Knowledge Management & E-Learning, 10(1), 97–112
101
corresponding learning material page. On learning material page were links to main menu
page and list of topics page.
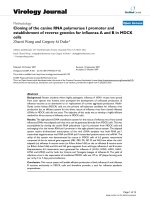
The appearance of e-learning website was made simple. It was 800px in width
and center floated. The main text area, the section where learning material was put, was
designed with light gray background-color, black colored-text, justified text aligned,
22px line height, Verdana and sans-serif font family, and 12pt font size. The line length
of the text was at utmost 120 characters (with spaces). The appearance of e-learning
website is shown in Fig. 1.
Fig. 1. The appearance of e-learning website
3.3. Instruments
Instruments of this study were e-learning record and open-ended questionnaire. Each
student used an id to log on to e-learning website. Consequently, each student developed
102
Guspatni (2018)
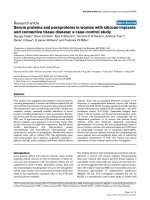
personal record of any activity made in the website. The recorded activities were pages
visited, access duration on each page, the number of quizzes completed, and the number
of attempts on each quiz (see Fig. 2). Access durations on learning material pages
(determined from GuidePage record) and number of quizzes completed (determined from
makeTest and checkTest records) were then analyzed. The result provided a
generalization of students’ activities in e-learning.
Fig. 2. Recorded data of students participating in e-learning
In the open-ended questionnaire, students were asked to write comments about
their experience in e-learning. The questionnaire consisted of two main items: (1) the
implementation of e-learning, and 2) the appearance and content of e-learning website.
To get genuine responses, students were clearly informed that their answers would not
affect their grades neither affected their personal and institutional profiles. For those
reasons, questionnaires were returned anonymously by students. In addition, three
demographic data of participating students were included in the questionnaire. They were
(1) the frequency of Internet access, (2) tool mostly used to access e-learning, and (3)
places to access e-learning. Students were asked to choose one of 5 options on how often
they used Internet either for browsing, emailing, or social media activities (1 for never, 2
for rare, 3 for moderate, 4 for often, and 5 for very often). Places to access e-learning
Knowledge Management & E-Learning, 10(1), 97–112
103
might include Wi-Fi coverage area on campus, ICT laboratories, home, and Internet
Cafés. Tools to access e-learning at home might include computer, laptop, tablet, and
mobile phone. Students were asked to rank order the places and tools they mostly used
for e-learning access.
4. Result
4.1. Demographic data of participating students
In general, participating students were accustomed to Internet. Most of students accessed
e-learning from house with laptop as the mostly used tool to access e-learning.
Demographic data of participating students is presented in Table 1.
Table 1
Demographic data of participating students
%
Frequency of Internet access
Very often
16
Often
56
Moderate
22
Rare
6
Never
0
Place to access e-learning
House
42
Internet café
28
Wi-Fi
22
Computer Lab
4
Tool mostly used to access e-learning at home
Laptop
88
Desktop computer
4
Tablet
2
Hand phone
2
None
4
4.2. Questionnaire data
Open-ended questionnaire consisted of two items, but some students left one item in the
questionnaire blank. Students’ answers were quite varied. 29 students did not give
104
Guspatni (2018)
comment on e-learning implementation. 11 students stated that e-learning was not
suitable for their learning as described by comments below:
•
“e-Learning was frustrating. We did not have fast Internet connection to access
it both at the university and at home. We could not always get online.”
•
“e-Learning could not effectively guide students to learn. We did not have direct
communication with lecturer to ask questions. We followed e-learning at the end
of the schedule just to do the quiz.”
•
“e-Learning was difficult and tiring because we should look at the screen to read
material.”
Nine students indicated that they liked e-learning as implied by comments below:
•
•
“e-Learning system eased students to learn at anytime from anywhere we like.”
“e-Learning eased students to access learning material and to hand in
assignment. It was practical because we could directly find further information
and concepts that we did not understand online.”
Three students stated both the benefits and the drawbacks of e-learning as
described by comments below:
•
“I liked e-learning system. As new to this, however, I did not understand how to
learn through this system, and I could not manage time to learn.”
•
“e-Learning asked students to manage time and be more curious. But it
decreased the communication between lecturer and students.”
Students had diverse comments on the content and appearance of e-learning
website. Few students thought that e-learning website was organized and perfect as it was.
Other students commented and gave suggestions to modify the content and appearance of
e-learning website. 25 students commented on the importance of interaction among
students and between students and lecturer in e-learning. They suggested providing a
scheduled and directed discussion forum for a synchronous communication. They also
suggested displaying users who were online so that they could feel togetherness in elearning. 25 students suggested to make e-learning website more attractive designed with
eye-friendly colorful background and completed with more instructional pictures and
videos. 13 students wished to get more resources and worked-out examples to help them
understand the concepts. 5 students asked for more easy-navigated website where all of
the navigations and their corresponding pages were displayed interchangeably in a single
page. 3 students realized that the font style, font size and line height of the text were
tiring and difficult to read. 3 students commented that they did not like immediate
feedback giving correct response if the next quiz displayed exactly the same question.
4.3. Website record
Each student had personal record page of his or her online activities in the study. Their
records were moved from record pages to excel sheets for descriptive analysis with Real
Statistics, a data analysis tool. Students’ activities in e-learning were not normally
distributed (see Table 2). 4 out of 6 categories of the data had outliers that came from the
first and second highest scores in the distribution. Analysis revealed that students’
activities in e-learning skewed to the right indicating many records fell below the mean.
The ratios of the number of students whose activities below the mean to the number of
Knowledge Management & E-Learning, 10(1), 97–112
105
students whose activities above the mean are 33 to 19 in the category of time to access elearning, 27 to 24 in the category of time to access learning material pages, 35 to 17 in
the category of number of quizzes completed, and 28 to18 in the category of number of
attempts for each quiz (3 students had score equalled to mean). On average, students
spent 206.89 minutes in e-learning. This time was less than it would be in normal
classroom instruction (300 minutes). The average time that students spent to access
learning material pages was 57.20 minutes. In this study, access on learning material page
was considered as reading activity. On average each student spent 0.82 minutes on each
learning material page. It implies that on average student needed 0.82 minutes to read 94
words, or on average student could read 115 words in a minute. If time spent for reading
diagrams and pictures is counted, the number of words read per minute will be fewer.
Table 2
Analysis on students’ activities in e-learning
Total
time in
elearning
Time
spent per
learning
material
page per
student
(min)
Time
spent on
quiz
(min)
Percentage
of quiz
done
Attempts
per quiz
(min)
Time
spent on
learning
material
pages
(min)
Mean
206.89
57.20
0.82
122.79
33.43
2.36
Standard Error
24.72
5.79
0.10
19.09
3.79
0.08
Median
164.03
56.51
0.56
76.85
25.45
2.18
Standard Deviation
178.27
41.74
0.74
137.66
27.31
0.58
Skewness
1.55
0.72
2.57
2.36
1.18
0.47
W
0.85
0.94
0.71
0.72
0.86
0.94
p-value
9.72E-06
1.51E-02
8.62E-09
1.37E-08
2.35E-05
1.25E-02
alpha
0.05
0.05
0.05
0.05
0.05
0.05
normal
no
no
no
no
no
no
Number of outliers
2
1
2
2
0
0
Number of blank
0
0
0
0
0
3
Descriptive statistic
Shapiro-Wilk Test
Outliers and Missing Data
The average time that students spent to do the quiz was 122.79 minutes. Three
students never accessed nor did the quiz. In contrast, two students did all of the quizzes in
the website. On average, students completed 33.43% of the quizzes. The average number
of attempts per quiz was 2.36 times. Two third of the total number of students attempted
the quiz less than the mean attempt. But on average, none of the students could do the
quiz in a single attempt. There were 10 quizzes that required chemistry and mathematics
106
Guspatni (2018)
understanding. Only 25 out of 52 students attempted those quizzes. The average number
of those quizzes completed by students was 5.80 and the average number of attempts for
each quiz was 2.1.
The remaining 26.90 minutes in e-learning access were used to navigate the
website. They included navigation on main menu page, list of topics page, and discussion
page. In addition to discussion page, students were informed that they could use email to
ask questions to lecturer. But less than 5% of the total number of students used the email
to inquire about concepts that they did not understand. After the schedule for the topic
ended, none of the students ever revisited the website.
5. Discussion
5.1. Learning activity in e-learning
This study was carried out to introduce web-based chemistry instruction to undergraduate
students in Padang, West Sumatra, Indonesia and then evaluate students’ activities,
perceptions, and expectations in their e-learning experience. Students in this study were
frequent Internet users. Online activities such as browsing, emailing and social media
activities were usual things for students. In contrast, students unfortunately put off visits
to the e-learning website until the end of the scheduled time. In line with the finding of
this study, other researchers (Deng & Tavares, 2015) found that learning engagement in
e-learning with such formal context and display was limited. Students did not visit the
website before the scheduled period or revisit it after the study. Their activities in current
study were not normally distributed. All of the data revealed positively skewed
distribution where many students had low participation in e-learning be it in time spent in
e-learning, in time spent to read learning material, or in number of quizzes completed.
The number of attempts on a quiz had a positive skewness where many data laid below
the mean. Nevertheless, data also suggested that students could not answer the quiz in a
single attempt.
In the questionnaire, students acknowledged that in e-learning they liked doing
graded quizzes better than reading and learning the materials. Students did admit that
grade for the course – the reward - was the main reason they did the quizzes and took part
in e-learning (Groves & O'Donoghue, 2009). Without a grade, students might not enroll
in e-learning. Furthermore, although grading on the quizzes was said to be the main
reason they followed e-learning, students were unable to complete all of the quizzes. On
average students did a third of the total quizzes. Less than half of the total number of
students did quizzes that required chemistry and mathematics understanding. As opposed
to Butchart et al. (2009), students did not develop critical thinking in e-learning. Students
argued that the quizzes were not allied to the text provided in the web when in fact the
quizzes were actually inferred from the materials. Students may not be able to
comprehend the materials and develop further understanding. Else they did not open and
read additional materials accessible on the blue linked- words or phrases on the pages.
Apparently, students needed clear instruction and comprehensive materials. They also
wished for more examples of concepts as well as problem tutorials, especially of
problems that required calculation (O’Sullivan & Hargaden, 2014). Students were used to
teacher-centered instruction and they were unconfident of accomplishing learning
without direct instruction from lecturer. Thus, in e-learning where communication with
lecturer is limited, more worked-out examples and resources such as video tutorials and
Knowledge Management & E-Learning, 10(1), 97–112
107
problem tutorials (He et al, 2012; O’Sullivan & Hargaden, 2014) are very important to
help students understand the lesson.
Almost all of the participating students had personal tool such as laptop, desktop
computer, tablet or handphone to access e-learning. Along with cheap Internet package
sold by cellular companies, students could obviously access the Internet frequently
especially for fast and light-loaded sites such as Facebook, Messengers and other social
medias. On the other hand, students unfortunately did not get into e-learning as much as
they got into Facebook and other Internet activities. If compared to learning time in
normal classroom instruction, students spent less time in e-learning. Students are
accustomed to accessing “pleasurable” websites as opposed to serious, formal, highloaded and demanding websites with expectations for learning. In line with other studies
(Ebrahimi, Faghih, & Marandi, 2016; Zhang & Nunamaker, 2003), easy navigated and
attractive website designed with eye-friendly colorful background, instructional pictures,
animations and videos would have encouraged students to engage in e-learning.
In this study, students spent less than a minute to read an average of 94 words per
learning material page. At utmost, students could read 115 words in a minute which is
fewer than the average reading speed of Indonesian adults who never took speed reading
training—175 to 300 words per minute (Soedarso, 2006). According to Kendeou and
Broek (2007), reading deep and demanding literature such as science text is time
consuming, especially if it is read by reader who has erroneous and limited prior
knowledge about the text. However, participants of this study were chemistry major
students who had learned nuclear chemistry topic in their senior high school and thus had
prior knowledge about it. Therefore, three possible explanations for students’ slow
reading in this study are: (a) students were slow readers, (b) students got difficulty to read
on-screen text, and (c) students read the text and tried to understand it. Should the last
explanation be true, students could have otherwise completed the quizzes in a single
attempt.
Apparently, low activity in current e-learning was related to the convenience of
reading on-screen text. The problem might relate to the font size, font style, line height,
and line length of the text. In this study, the font style was Verdana- san-serif and the font
color was black on light background - the most legible font style and color combination
for the web (Erdogan, 2008). Still, there were few students who noted the difficulty of
reading the text. Other possibilities might come from the small line height and the long
line length of the text. The line height of the text was 22px which is less than 1.5 line
spacing for Verdana with 12pt font size (CSS line-height Property, 2016). The line length
of the text could contain at utmost 120 characters. This length is more than twice of the
recommended length for an effective and high comprehension of on-screen text reading
for both normal and fast speed readers (Dyson & Haselgrove, 2001).
5.2. Students perceptions of and expectations for e-learning
Many students perceived e-learning as a difficult system to implement. Low Internet
connection, lack of communication and low self-assurance to comprehend learning
materials were reported as students’ challenges in this mode of learning. In fact,
technological issues, academic confidence and communication are common issues of elearning implementation found in both developed and developing countries (Andersson &
Gronlund, 2009; Frehywot et al., 2013; Quimno, Imran, & Turner, 2013; Qureshi, Ilyas,
Yasmin, & Whitty, 2012; Zoroja, Skok, & Bach, 2014). e-Learning website included
pages containing texts, symbols, pictures, and videos for learning material. As compared
108
Guspatni (2018)
to informal sites usually visited by students, e-learning website was more heavy-loaded.
e-Learning can be frustrating if it cannot simply be accessed by students. This is
particularly true if e-learning is given to students who are either inexperienced or less
experienced with e-learning. Stark, Lassiter, and Kuemper (2013) found that Internet
access is the biggest predictor of performance in an online course for novices or lowerlevel students. Therefore, it is very important to provide a fast and stable Internet
connection so that students do not get irritated and can study well in e-learning.
Besides getting comprehensive resources, students expected to have a
synchronous discussion forum to interact and get the sense of social presence and
collaboration (Abrami et al., 2011). In line with other findings (Deng & Tavares, 2015;
Gilbert, Morton, & Rowley, 2007; Zhang & Nunamaker, 2003), less interaction could be
the problem in current e-learning which had appeared to undermine students’ satisfaction
to follow it. In fact, to assist cognitive processing, social presence is strongly advisable in
e-learning (Cavus, Uzunboylu, & Ibrahim, 2007; Gutierrez-Santiuste, Rodríguez-Sabiote,
& Gallego-Arrufat, 2015). Similarly, Topchyan (2016) found that interactive response as
one of social presence dimensions does relate to knowledge sharing in virtual and
distance learning. As suggested by participating students, online users can be shown on
the page so that students would not feel alone and know that they have friends to interact
with during learning. Instructor needs to direct and control the interaction during learning.
Being a key to the success of e-learning initiatives, the interactivity in e-learning can be
increased through a mandatory participation during learning (Adiele & Nwanze, 2010).
Few students commented that they did not like immediate feedback giving correct
answer. Because set to provide question randomly, one quiz button could present exactly
the same question when attempted more than once. Students, especially those who only
wanted to finish the quiz and get “completed” score, might note down the right answer
and then continuously clicked the quiz button to get exactly the same question. In fact, on
average students attempted a quiz more than once in this study. To deal with this issue,
score and the number of attempts on each quiz should be shown on the page, so students
would be more attentive to do the quiz.
5.3. e-Learning effectiveness
In this study, the effectiveness of e-learning was not quantitatively compared with that of
conventional classroom instruction. The same evaluation was not given into the two
modes of instruction. Yet, several comparisons were assumed. Firstly, in conventional
classroom instruction, lecturers either gave assignments or quickly reviewed some
materials in certain topics so that all of the topics stated in the syllabus could be taught to
students. Fortunately, when e-learning was implemented, the scheduled time of the
semester could be used for almost all of the topics. Secondly, feedback was not always
given in conventional classroom instruction since lecturers could not return the graded
assignment to students in time. On the other hand, e-learning appeared to be relatively
effective in giving feedback. Quiz functioning as a formative assessment could provide
responses to any answer given by students. When students did a quiz, they could see the
correct and incorrect answers. Therefore, students could learn what was expected from
the problem.
e-Learning did not meet all types of learner. Yet, it was found that e-learning
brought several advantages especially for certain students. Firstly, e-learning eased
students to learn and hand in assignments as they did not have to go to campus and meet
the lecturer. Secondly, it directed students to find many resources from the Internet. eLearning is an Internet-based learning mode. While accessing e-learning website,
Knowledge Management & E-Learning, 10(1), 97–112
109
students could access other sites in a browser to get guidance to learn the materials.
Lastly, e-learning led students to be more curious in learning. Online resources would
offer more information to students which then boosted students’ curiosity in learning.
6. Conclusion
Students’ activities in e-learning were low and not normally distributed. There were more
students who spent less time in learning the materials and did few quizzes than those who
had high records in the two activities. Graded quiz was considered as the main reason for
students to take part in e-learning. However, students could not complete all of the
quizzes and answer each of them in a single attempt. To fulfill curriculum demand,
quizzes were designed so that they did not only ask students to memorize, but also
required students to understand, apply and analyze chemistry concepts and principles to
solve the problems. Therefore, it is very reasonable that students needed comprehensive
resources to learn the materials. In current e-learning, more worked-out examples and
supports should have been provided to help students understand the lesson.
Furthermore, students did not spend much time on a learning material page. Yet,
their speed of reading was shown slower than that of the average Indonesian normal
speed reader. Instead of trying to seriously read and understand the text, it is suggested
that students were either slow readers or getting difficulty to read the text on the screen.
Thus, practitioner should consider the convenience of reading the on-screen text by
choosing the best combination of line length, line height, font style, font size, and fontbackground color of the text.
e-Learning could help lecturer to effectively use time to teach materials and give
feedback on students’ performance. e-Learning was useful for students because it eased
students to learn, hand in assignments and get learning resources. However, introducing
e-learning to students who are used to classroom and teacher-directed instruction needs
very well preparation and implementation. They include (1) design of e-learning website,
(2) content or material put in e-learning, and (3) learning atmosphere in e-learning. The
last is related to social presence and collaboration in e-learning. This condition can be
created by providing synchronous discussion forum and display of online users in the
website.
7. Implication for practitioner and future research
University as learning facilitator needs to provide a fast and stable Internet (both Wi-Fi
and LAN) connection on campus so that e-learning can be accessed by all of the students.
When e-learning is being introduced, practitioners need to provide more resources and
worked-out examples (especially the downloadable versions of materials) so that students
can begin to learn independently. In addition, students expectations including e-learning
website that has attractive and convenient look and e-learning website that provides
social features are other important factors to consider when implementing e-learning.
This study was limited to one college where almost all of the students were
Minangese (similar to Malay clan) and most of the students came from family with low
to middle income. This study was also done in a place where Internet connection was
neither very fast nor stable. Other study should be taken from institutions that have more
diverse population of students and have stable and fast Internet connection. Moreover, e-
110
Guspatni (2018)
learning was implemented in nuclear chemistry topic. Additional research should include
variety of topics and subjects.
Acknowledgements
The author wishes to thank Universitas Negeri Padang for providing website domain and
access for students. Thanks to The United States Agency for International Development
(USAID) for facilitating this research. Thanks to David W. Brooks whose website served
as a basis for this study, and to the University of Nebraska-Lincoln, Nebraska, USA.
References
Abrami, P. C., Bernard, R. M., Bures, E. M., Borokhovski, E., & Tamim, R. M. (2011).
Interaction in distance education and online learning: Using evidence and theory to
improve practice. Journal of Computing in Higher Education, 23(2/3), 82–103.
Adewole-Odeshi, E. (2014). Attitude of students towards e-learning in south-west
nigerian universities: An application of technology acceptance model. Library
Philosophy
and
Practice
(e-journal).
Retrieved
from
/>Adiele, C., & Nwanze, E. D. (2010). The dynamics of interactivity modelling for elearning. Knowledge Management & E-Learning (KM&EL), 2(4), 370–384.
Agariya, A. K., & Singh, D. (2012). e-Learning quality: Scale development and
validation in Indian context. Knowledge Management & E-Learning (KM&EL), 4(4),
500–517.
Anand, R., Saxena, S., & Saxena, S. (2012). e-Learning and its impact on rural areas.
International Journal of Modern Education and Computer Science, 4(5), 46–52.
Andersson, A., & Grönlund, A. (2009). A conceptual framework for e-learning in
developing countries: A critical review of research challenges. The electronic Journal
of information systems in developing Countries, 38(1), 1–16.
Awad, B. (2014). Empowerment of teaching and learning chemistry through information
and communication technologies. African Journal of Chemical Education, 4(3), 34–
47.
Bell, B. S., & Federman, J. E. (2013). e-Learning in postsecondary education. The Future
of Children, 23(1), 165–185.
Bertea, P. (2009, April). Measuring students’ attitude towards e-learning: A case study.
In Proceedings of 5th International Scientific Conference on eLearning and Software
for Education. Bucharest, Romania.
Brooks, D. W., Cohen, K. C., Abuloum, A., Langell, M. A., Markwell, J. P., Emry, R.,
Crippen, K. J., & Brooks, H. B. (2007). Developing web-based pedagogical content
coursework for high school chemistry teachers. Journal of Chemical Education,
84(11), 1861–1865.
Butchart, S., Forster, D., Gold, I., Bigelow, J., Korb, K., Oppy, G., & Serrenti, A. (2009).
Improving critical thinking using web based argument mapping exercises with
automated feedback. Australasian Journal of Educational Technology, 25(2), 268–
291.
Cavus, N., Uzunboylu, H., & Ibrahim, D. (2007). Assessing the success rate of students
using a learning management system together with a collaborative tool in web-based
teaching of programming languages. Journal of Educational Computing Research,
36(3), 301–321.
Chen, C. M., Lee, H. M., & Chen, Y. H. (2005). Personalized e-learning system using
Knowledge Management & E-Learning, 10(1), 97–112
111
item response theory. Computers & Education, 44(3), 237–255.
CSS
line-height
Property.
(2016).
Tryit
Editor.
Retrieved
from
/>Debuse, J. C. W., Lawley, M., & Shibl, R. (2008). Educators' perceptions of automated
feedback systems. Australasian Journal of Educational Technology, 24(4), 374–386.
Deng, L., & Tavares, N. J. (2015). Exploring university students’ use of technologies
beyond the formal learning context: A tale of two online platforms. Australasian
Journal of Educational Technology, 31(3), 313–327.
Denton, P., Madden, J., Roberts, M., & Rowe, P. (2008). Students' response to traditional
and computer-assisted formative feedback: A comparative case study. British Journal
of Educational Technology, 39(3), 486–500.
Dori, Y. D., Barak, M., & Adir, N. (2003). A web-based chemistry course as a means to
foster freshmen learning. Journal of Chemical Education, 80(9), 1084–1092.
Dyson, M. C., & Haselgrove, M. (2001). The influence of reading speed and line length
on the effectiveness of reading from screen. International Journal of HumanComputer Studies, 54(4), 585–612.
Ebrahimi, A., Faghih, E., & Marandi, S. S. (2016). Factors affecting pre-service teachers’
participation in asynchronous discussion: The case of Iran. Australasian Journal of
Educational Technology, 32(2), 115–129.
Eichler, J. F., & Peeples, J. (2013). Online homework put to the test: A report on the
impact of two online learning systems on student performance in general chemistry.
Journal of Chemical Education, 90(9), 1137–1143.
Erdogan, Y. (2008). Legibility of websites which are designed for instructional purposes.
World Applied Sciences Journal, 3(1), 73–78.
Frehywot, S., Vovides, Y., Talib, Z., Mikhail, N., Ross, H., Wohltjen, H., … Scott, J.
(2013). e-Learning in medical education in resource constrained low-and middleincome countries. Human Resource for Health, 11: 4.
Gilbert, J., Morton, S., & Rowley, J. (2007). e-Learning: The student experience. British
Journal of Educational Technology, 38(4), 560–573.
Groves, M., & O'Donoghue, J. (2009). Reflections of students in their use of
asynchronous online seminars. Educational Technology & Society, 12(3), 143–149.
Gunasekaran, A., McNeil, R. D., & Shaul, D. (2002). e-Learning: Research and
applications. Industrial and Commercial Training, 34(2), 44–53.
Gutierrez-Santiuste, E., Rodríguez-Sabiote, C., & Gallego-Arrufat, M. J. (2015).
Cognitive presence through social and teaching presence in communities of inquiry:
A correlational-predictive study. Australasian Journal of Educational Technology,
31(3), 349–362.
Hattie, J., & Timperley, H. (2007). The power of feedback. Review of Educational
Research, 77(1), 81–112.
He, Y., Swenson, S., & Lents, N. (2012). Online video tutorials increase learning of
difficult concepts in an undergraduate analytical chemistry course. Journal of
Chemical Education, 89(9), 1128–1132.
Keller, C., & Cernerud, L. (2002). Students’ perceptions of e-learning in university
education. Journal of Educational Media, 27(1/2), 55–67.
Kendeou, P., & van den Broek, P. (2007). The effects of prior knowledge and text
structure on comprehension processes during reading of scientific texts. Memory and
Cognition, 35(7), 1567–1577.
Kumbhar, R. (2009). Use of e-learning in library and information science education.
DESIDOC Journal of Library & Information Technology, 29(1), 37–41.
Liaw, S. S., & Huang, H. M. (2011). A study of investigating learners attitudes toward elearning. In Proceedings of the 5th International Conference on Distance Learning
112
Guspatni (2018)
and Education (Vol. 12, pp. 28–32).
Nichols, M. (2003). A theory for eLearning. Educational Technology & Society, 6(2), 1–
10.
O’Sullivan, T. P., & Hargaden, G. C. (2014). Using structure-based organic chemistry
online tutorials with automated correction for student practice and review. Journal of
Chemical Education, 91(11), 1851–1854.
Quimno, V., Imran, A., & Turner, T. (2013). Introducing a sociomaterial perspective to
investigate e-learning for higher educational institutions in developing countries. In
Proceedings of the 24th Australasian Conference on Information Systems (ACIS) (pp.
1–12). RMIT University.
Qureshi, I. A., Ilyas, K., Yasmin, R., & Whitty, M. (2012). Challenges of implementing
e-learning in a Pakistani university. Knowledge Management & E-Learning
(KM&EL), 4(3), 310–324.
Ramani, S., & Krackov, S. K. (2012). Twelve tips for giving feedback effectively in the
clinical environment. Medical Teacher, 34(10), 787–791.
Ruiz, J. G., Mintzer, M. J., & Leipzig, R. M. (2006). The impact of e-learning in medical
education. Academic Medicine, 81(3), 207–212.
Soedarso. (2006). Speed reading: Sistem membaca cepat dan efektif. Jakarta: Gramedia.
Stark, E., Lassiter, A., & Kuemper, A. (2013). A brief examination of predictors of elearning success for novice and expert learners. Knowledge Management & ELearning (KM&EL), 5(3), 269–277.
Sun, P. C., Tsai, R. J., Finger, G., Chen, Y. Y., & Yeh, D. (2008). What drives a
successful e-Learning? An empirical investigation of the critical factors influencing
learner satisfaction. Computers & Education, 50(4), 1183–1202
Thurlings, M., Vermeulen, M., Bastiaens, T., & Stijnen, S. (2013). Understanding
feedback: A learning theory perspective. Educational Research Review, 9, 1–15.
Topchyan, R. (2016). Does social presence relate to knowledge sharing in virtual learning
teams? Knowledge Management & E-Learning (KM&EL), 8(4), 646–660.
Waight, C. L., Willging, P. A., & Wentling, T. L. (2002). Recurrent themes in e-learning:
A meta-analysis of major e-learning reports. In Proceedings of the Academy of
Human Resource Development Conference (pp. 491–499).
Welsh, E. T., Wanberg, C. R., Brown, K. G., & Simmering, M. J. (2003). e-Learning:
Emerging uses, empirical results and future directions. International Journal of
Training and Development, 7(4), 245–258.
Zhang, D., & Nunamaker, J. F. (2003). Powering e-learning in the new millennium: An
overview of e-learning and enabling technology. Information Systems Frontiers, 5(2),
207–218.
Zoroja, J., Skok, M. M., & Bach, M. P. (2014). e-Learning implementation in developing
countries: Perspectives and obstacles. In F. J. García Peñalvo & A. M. Seoane Pardo
(Eds.), Online Tutor 2.0: Methodologies and Case Studies for Successful Learning
(pp. 97–118). Hershey, PA: IGI Global.