Gender differences in the age-cohort distribution of psychological distress in Canadian adults: Findings from a national longitudinal survey
Bạn đang xem bản rút gọn của tài liệu. Xem và tải ngay bản đầy đủ của tài liệu tại đây (405.12 KB, 13 trang )
Drapeau et al. BMC Psychology 2014, 2:25
/>
RESEARCH ARTICLE
Open Access
Gender differences in the age-cohort distribution
of psychological distress in Canadian adults:
findings from a national longitudinal survey
Aline Drapeau1,2,3*, Alain Marchand4,5 and Charlotte Forest1,6
Abstract
Background: Psychological distress is frequently used as an indicator of the mental health of a population. Overall,
the mean level of distress is higher in women than in men and tends to decrease in both genders during
adulthood. This pattern is primarily attributable to the differential exposure of women and men to specific risk
factors over their lifetimes. However, the age distribution for distress may be confounded by a cohort effect. This
study aimed to compare the age and birth cohort distribution of psychological distress by gender.
Methods: This study was based on data from the National Population Health Survey, a longitudinal population
survey conducted in Canada from 1994–1995 to 2010–2011. Growth curve analyses were performed separately in
women (n = 9062) and in men (n = 7877) to examine the distribution of psychological distress by age group and
birth cohort in Canadians aged 18 years and older.
Results: The mean level of psychological distress is higher in women than in men in all age groups and all birth
cohorts, and in the 18-29 age group than in older adults. Minor gender differences are found in the distribution of
distress when age and birth cohort are examined jointly. In women, the mean level of distress decreases steadily
beginning at age 18, reaches its lowest point in the 60-69 age group and rises thereafter without ever reaching the
level observed in young adults. In men, it remains stable in the twenties and then follows a pattern similar to that
observed in women. This age pattern is more apparent in more recent than in earlier cohorts and is related to
variations in employment status, marital status and education during adulthood.
Conclusions: Young adults and, to a lesser degree, seniors are at higher risk for psychological distress than other
adults. To better understand the epidemiology of psychological distress, future research should focus on the risk
factors that are more prevalent in these age groups. A starting point would be to evaluate how employment status,
marital status and educational level change during adulthood and have changed over time in women and in men.
Keywords: Psychological distress, Age, Cohort, Adults, Gender, Growth curve analysis, Longitudinal survey, Canada
Background
Psychological distress is a state of emotional suffering
characterized by moderate to severe depressive and anxiety symptoms (Drapeau et al. 2011; Mirowsky and Ross
2002). It is a marker of the severity of symptoms for
major depression and anxiety disorders and a diagnostic
criterion for post-traumatic stress disorder (Knapp et al.
2007). Because of its association with certain psychiatric
* Correspondence:
1
Centre de recherche – Institut universitaire en santé mentale de Montréal,
7331 rue Hochelaga, H1N 3X6 Montreal, Canada
2
Département de psychiatrie, Université de Montréal, Montréal, Canada
Full list of author information is available at the end of the article
disorders (Knapp et al. 2007; Organisation mondiale de
la santé 2006; Phillips 2009) and with the use of mental
health services (Gudmundsdottir and Vilhjalmsson 2010;
Koopmans et al. 2005; Lin et al. 2012; Svensson et al.
2009), psychological distress is used as an indicator of
population mental health by public health institutions
worldwide (Delorme et al. 2005; Herman et al. 2005). In
adults, the annual prevalence of psychological distress
ranges from 10% in Australia (Chittleborough et al. 2011)
to 21% in Canada (Caron and Liu 2011) and 27% in Japan
(Sakurai et al. 2010), Great Britain (Benzeval and Judge
2001) and Belgium (Levecque et al. 2009). The prevalence
© 2014 Drapeau et al.; licensee BioMed Central Ltd. This is an Open Access article distributed under the terms of the Creative
Commons Attribution License ( which permits unrestricted use, distribution, and
reproduction in any medium, provided the original work is properly credited. The Creative Commons Public Domain
Dedication waiver ( applies to the data made available in this article,
unless otherwise stated.
Drapeau et al. BMC Psychology 2014, 2:25
/>
and mean level of distress tend to decrease over the life
course beginning in early adulthood (Caron and Liu 2011;
Gispert et al. 2003; Jorm et al. 2005; Langlois and Garner
2013; Phongsavan et al. 2006; Walters et al. 2002).
Though the negative association between age and psychological distress has been repeatedly observed, the shape
of the curve describing the age distribution of distress
remains ambiguous. For instance, Schieman et al. (2001)
and Turcotte and Schellenberg (2007) have shown
that the mean levels of distress were higher in young
Americans and Canadians than in older adults. Levels
then decreased with age, reaching a minimum between
ages 60 and 69 (Schieman et al. 2001) or 65 and 74
(Turcotte and Schellenberg 2007) before increasing in
those older than 74. A U-shaped distribution was also
noted by Sacker and Wiggins (2002) despite the fact that
the British sample under study was much younger, ranging from 23 to 42 years of age. In addition, Jorm et al.
(2005) have provided some evidence that the age distribution of psychological distress may vary by gender. This
study, based on Australians in three specific age groups
(20–24, 40–44 and 60–64), found that the mean level of
distress among men was similar in the first two age groups
and lower in the oldest group, whereas it diminished at a
constant rate between ages 20 and 64 among women.
The age distribution for depression and anxiety symptoms could shed some light on the age distribution for
psychological distress, given the strong relationship between the former and the latter. Unfortunately, data on
the distribution of anxiety symptoms by age are lacking
for the general population. Findings regarding the age distribution for depression symptoms, moreover, are conflicting. Most studies support a U-shaped distribution for
depression symptoms, but the age cohort at which symptoms reach their lowest levels remains unclear. The mean
level of depressive symptoms tends to be higher among
young adults, then diminishes until the forties (Mirowsky
and Kim 2007), mid-fifties (Kessler et al. 1992) or sixties
(Schieman et al. 2001) before again increasing among
those aged 70 and older. Roberts et al. (1991) compared
the prevalence of depression by age in 1965, 1974 and
1983 and found no statistically significant differences between young and middle-aged adults. However, that study
did find higher prevalences for those aged 62 years and
older (in 1965), 70 years and older (in 1974) and 80 years
and older (in 1983). According to Roberts et al. (1991), the
variation in peak depression prevalence among seniors between 1965 and 1983 could indicate that the age distribution observed in other studies is biased by a cohort effect.
Variations in psychological distress and other health
problems during adulthood have been primarily attributed to differential lifetime exposures to specific risk factors (Jorm et al. 2005; Schieman et al. 2001). Some risk
factors commonly associated with psychological distress,
Page 2 of 13
such as low educational level (Brault et al. 2011; Caron
and Liu 2011; Jorm et al. 2005; Schieman et al. 2001),
lack of a spouse (Brault et al. 2011; Caron and Liu 2011;
Jorm et al. 2005; Kasen et al. 2003; Schieman et al. 2001;
Yang 2007) and non-employment (Brault et al. 2011;
Chiao et al. 2009; Jorm et al. 2005; Schieman et al. 2001;
Walters et al. 2002), follow a U-shaped distribution that
matches the age distribution for psychological distress
during adulthood found in some studies. For example, in
Canada the percentage of the population having completed high school or less is higher for those aged 15–24
(34%) and 65 and older (38%) than for those aged 25–54
(10%) or 55–64 (16%) (Statistique Canada 2012). The
youngest age group includes teenagers who, as a rule, have
not yet finished high school. Those aged 65 and older
grew up at a time when high school diplomas were much
less common than they are today. Similarly, having no
spouse (i.e.,single, divorced, separated or widowed) is most
frequent among those aged 20–24 (84%), reaches minimum levels between ages 35 69 (29%) and gradually increases, primarily because of the death of a spouse, to 59%
between ages 75 and 79 and more than 80% after age 90
(Statistique Canada 2013). Finally, non-employment is
relatively high among those aged 15–24 (45%), drops to
19% between ages 25 and 54 and then increases to 41%
among those aged 55–64 and to 89% among those aged
65 years and older (Statistique Canada 2011). Nonemployment among younger people may be high in part
because of college or university enrolment. Older adults
generally start retiring in their sixties.
An alternative explanation for the distribution of psychological distress by age is the cohort effect (Brault et al.
2011; Chiao et al. 2009; Kasen et al. 2003; Jorm 2000;
Lewinsohn et al. 1993; Mirowsky and Kim 2007; Roberts
et al. 1991; Sacker and Wiggins 2002; Yang 2007). The cohort effect results from generational exposure to unique
combinations of social and cultural factors, which differentiate each birth cohort from previous and subsequent
generations (Susser et al. 2006). To our knowledge, only
one study (Sacker and Wiggins 2002) sought to disentangle the effects that age and cohort had on the distribution
of psychological distress in the general population. The
study analysed the data pooled from two longitudinal
surveys conducted in the United Kingdom: the National
Child Development Study (NCDS) and the 1970 British
Birth Cohort Study (BCS70). The NCDS targeted people
born in one week in 1958 (n = 14 663), whereas the
BCS70 focused on those born in one week in 1970 (n = 12
597). The study by Sacker and Wiggins (2002) was restricted to data collected when NCDS respondents were
23, 33 and 42 years of age and BCS70 respondents were
26 and 30 years of age. Sacker and Wiggins (2002) observed significant age and cohort effects. The rate of
highly distressed individuals followed a U-shaped age
Drapeau et al. BMC Psychology 2014, 2:25
/>
distribution; the youngest cohort (born in 1970) had a
higher rate of distress than the oldest cohort (born in
1958). The interaction between age and cohort effects was
not statistically significant.
The age and cohort effects and their interaction have
also been investigated for depression and depressive
symptoms (Brault et al. 2011; Chiao et al. 2009; Kasen
et al. 2003; Lewinsohn et al. 1993; Mirowsky and Kim
2007; Roberts et al. 1991; Yang 2007). But only the study
conducted by Brault et al. (2011) covers a broad age
range and includes several waves of data collection. It
was based on data from the Panel Study of Belgian
Households (PSBH), a longitudinal population survey
with collected data each year between 1992 and 2002
(Brault et al. 2011). The analyses were restricted to respondents between 25 and 74 years of age at baseline.
Five cohorts were defined based on birth year (1918–
1927, 1928–1937, 1938–1947, 1948–1957 and 1958–
1967); cohort membership was treated as a categorical
variable and analysed with four dummy variables. Statistically significant effects were found for age, cohort and
interaction between age and cohort. Unlike the findings
in studies conducted by Kessler et al. (1992), Mirowsky
and Kim (2007) and Schieman et al. (2001), Brault et al.
(2011) found that the mean level of depression symptoms increased slightly with age. They also noted statistically significant effects for birth cohort and for
age-cohort interaction. These effects showed that the
mean level of depression symptoms was higher in more
recent cohorts than in earlier cohorts and that the tendency of symptoms to increase with age was more pronounced in more recent cohorts. Controlling for gender,
marital status, education, income and employment status
did not alter the cohort effect or the interaction between
age and cohort. Other studies that investigated the effects
of age and cohort on the distribution of depression
symptoms were based on selective samples, which limited the generalisability of their findings. The study by
Yang (2007) was limited to seniors (aged 65 to 95);
Chiao et al. (2009) restricted their study to those aged
60 to 69; and Kasen et al. (2003) studied only mothers
from 35 to 55 years of age.
Taken together, findings from the studies that examined the effects of age and cohort on the distribution of
psychological distress and depressive symptoms suggest
that gender differences, cohort effect and the interaction
of age and cohort effects should be taken into account if
the distribution of psychological distress during adulthood is to be fully understood. The main objective of
our study was to examine the effects of age and birth cohorts on the distribution of psychological distress in
Canadian adults. More specifically, it aimed to compare
the patterns of the age and birth cohort distributions for
psychological distress in women and men and to verify
Page 3 of 13
to what extent educational level, marital status and employment status account for this distribution.
Methods
Study population
This study is based on data from the National Population Health Study (NPHS). The NPHS is a longitudinal
population survey conducted by Statistics Canada every
two years from 1994–1995 to 2010–2011 (9 waves). It
assessed the health status, lifestyle and health care practices of Canadians. The target population of the NPHS
comprised Canadians aged 12 years and older and living
in private households. At baseline (1994–1995), respondents were selected using a multi-level stratified sampling strategy to identify 20 095 households from which
one person was selected at random; the response rate
was 86%. Additional information regarding the design of
the NPHS can be found in Catlin and Will (1992) and
Tambay and Catlin (1995).
In this study, analyses were restricted to adult respondents. Between 1994–1995 and 2010–2011, 16939 respondents (women n = 9062; men n = 7877) 18 years old
and older took part in the NPHS. Among these, 1405
women and 1428 men became eligible for this study
after baseline since they reached 18 years old between
waves 2 and 9 of the NPHS. The 16 939 respondents
generated 127322 observations (women n = 69020; men
n = 58302). Over the course of the survey, one third of
adult respondents (women 32.0%; men 35.8%) were permanently or temporarily lost to follow-up (i.e., they
missed one wave but participated in the next wave).
Those lost to follow-up tended to have a higher mean
level of psychological distress in the wave preceding
their withdrawal than those who remained part of the
survey.
Dependent variable
Psychological distress was assessed with the K6, a scale
developed by Kessler and his colleagues and used in several population surveys (Kessler et al. 2002; Kessler et al.
2003; Furukawa et al. 2003; Baillie 2005). The K6 is a
unidimensional scale comprising 6 items asking respondents how often during the preceding 30 days they felt:
so sad that nothing could cheer them up; nervous; restless or fidgety; hopeless; worthless; that everything was
an effort. Each item is scaled from 0 (none of the time)
to 4 (all of the time). The total score of psychological
distress is computed by summing the six items scores
and ranges from 0 to 24. Items with missing values were
replaced with the mean of valid items among respondents with valid answers to four or five items of the K6
before computing the total distress score (rounded to
the nearest unit). Respondents with valid answers to
three items or fewer were coded as missing values for
Drapeau et al. BMC Psychology 2014, 2:25
/>
the distress score. In this study, the reliability of the K6
ranged from αCronbach = .72 to αCronbach = .84 over the 9
waves of the NPHS. The measurement and structural invariance of the K6 across gender was demonstrated in a
previous paper (Drapeau et al. 2010).
Independent variables
Age was analyzed as a continuous time-varying variable
and was centred at 18 years of age (i.e., 18 years = 0).
Quadratic age and cubic age were input to model the
curvilinear age distribution that has been observed for
psychological distress in other studies (Langlois and
Garner 2013; Sacker and Wiggins 2002; Schieman et al.
2001; Turcotte and Schellenberg 2007). Birth cohorts
were divided into 10-year periods except for the most recent (1980 to 1995) and the earliest (1893 to 1919) cohorts, both of which span more than a decade (15 and
26 years, respectively) in order to ensure a sufficient
number of respondents in each cohort. The successive
cohorts were coded 0 (1980 to 1995) to 7 (1893 to
1919). Three time-varying covariates were taken into account: educational level (high school or less = 2; post
high school education = 1; university diploma = 0), marital status (without spouse i.e., single, divorced, separated
or widowed = 1; with legal or common-law spouse = 0),
and employment status (not employed = 1; full-time or
part-time workers = 0). Not employed include volunteer
workers, retirees and individuals who are not in the
work market for any reasons. Employed include salaried
employees, self-employed workers and workers on sick
leave or temporarily absent from work for family reasons.
Statistical analyses
Hierarchical growth curve analyses were conducted separately for women and men to examine the effects of
age and birth cohort on the distribution of psychological
distress. Growth curve analysis is a form of multilevel
analysis for longitudinal data where data collected at
each wave (level 2) are nested in individuals (level 1)
(Rabe-Hesketh and Skrondal 2012). It is used to describe
the trajectory of a phenomenon over time by simultaneously taking into account the intra- and inter-individual
variation of this trajectory. The two main parameters,
the intercept (i.e., initial level) and the slope (i.e., growth
or decline rate), have two dimensions: a fixed dimension
reflecting the mean value of the parameter and a random dimension corresponding to the individual variations around this mean. In this study, the coefficient for
age estimates the intra-individual growth rate of distress
during adulthood, the coefficient for cohort estimates
the inter-individual variation of distress over time, and
the interaction between age and cohort estimates variation in the growth rate over time. Hierarchical growth
curve analyses by gender comprise five consecutive
Page 4 of 13
models. Model 1, the null model, includes only the intercept and serves to verify the presence of random variation in the trajectory of psychological distress. Model 2
includes the age variables (i.e., age, age2 and age3) and
assesses the crude effect of time on the trajectory of distress. Birth cohort is added in Model 3, and the interaction between age and birth cohort in Model 4. Model
5 includes the time-varying covariates (i.e., education,
marital status and employment status) and aims to verify
to what extent these covariates explain the results observed in Model 4. Growth curve analyses were carried
out using the mi-xtmixed function of Stata version 13.
They were based on weighted data to control for the
non response and loss to follow-up during the NPHS.
These weights are estimated by Statistics Canada and, in
this study, they are standardized to 1 to respect sample
size. Estimated standard errors of the confidence intervals were inflated by the square root of the global survey
design effect.
Before undertaking growth curve analysis, missing values
were replaced by imputed values to control for a potential
selection bias due to selective loss to follow-up and nonresponse. Although growth curve analysis takes into account all valid data, the estimation of parameters can be
biased in cases of selective attrition and non-responses.
Missing values were imputed on wide- format file using
the multiple imputation method developed by Rubin
(1987). Multiple imputation produces several series of
completed data where the missing values of a variable are
replaced by values predicted by linear, ordinal or logistic
regression based on an imputation model. Statistical analyses (here, growth curve analyses) are conducted separately on each completed data set and the estimated
parameters are combined using Rubin’s rules (Rubin
1987). The imputation model must contain all variables
used in subsequent analyses. It may also contain auxiliary
variables that will not be included in the main analyses
but that will improve the precision of imputed values
(Collins et al. 2001; Enders 2010; Rubin 1996; Schafer and
Graham 2002). In this study, the imputation model included the variables used in growth curve analyses (i.e.,
age; age2; age3; birth cohorts; interaction between age and
cohort; educational level; marital status; employment status) and five auxiliary variables. These auxiliary variables
were selected because they correlated with psychological
distress (r > .10) and because they were assessed in all nine
waves of the NPHS. These variables are: subjective health
perception (5 categories ranging from 0 “poor health” to 4
“excellent health”); number of visits to a medical practitioner (generalist or specialist) in the 12 months preceding
the survey; number of depression symptoms according to
the CIDI-Short Form; inability to perform daily activities
in the previous two weeks (index ranging from 0 to 3);
and number of chronic health problems indicated on a
Drapeau et al. BMC Psychology 2014, 2:25
/>
checklist of 19 health problems. The auxiliary variables
contained few missing data (ranging from 0.01% to
6.20%); missing values were replaced with the median
value observed in men and women.
The multiple imputation of missing values for psychological distress was based on the MICE (Multiple Imputation by Chained Equation) algorithm implemented by
the ICE (Iterated Chained Equation) program; MICE
and ICE were both developed by Royston (Royston 2007;
Royston and White 2011). The ICE program allows the
user to specify the range of imputed values so that
they reflect plausible minimum and maximum values
(Royston and White 2011). For instance, imputed values
for psychological distress ranged from 0 (minimum score)
to 24 (maximum score) and were rounded to the nearest
unit since K6 scores do not contain decimal values. Following Graham et al.’s recommendations (Graham et al.
2007), twenty series of completed data sets were generated. These completed data sets comprised 23.1% of imputed values for women and 27.3% for men. According to
Rubin (1987), multiple imputation is problematic when
the percentage of missing values exceeds 50%. Missing
values were not imputed for respondents who ceased participating in the survey due to death (n = 6.3%), but their
data were included in the analyses for the waves preceding
their death. The mean levels of psychological distress
based on imputed data sets were higher (women: 6.4% to
8.1%; men: 16.7% to 19.2%) than the observed mean levels,
which is consistent with the fact that respondents lost to
follow-up expressed higher mean levels of distress than
those who remained in the survey.
Ethics
This study was approved by the ethics committee of the
Institut universitaire en santé mentale de Montréal. Access to the NPHS data was granted by the Social Science
and Humanities Council of Canada and by Statistics
Canada. Analyses were carried out at the Centre Interuniversitaire Québécois de Statistiques Sociales (CIQSS).
Informed consent from participants was obtained by
Statstics Canada.
Results
Descriptive data
Table 1 displays the means for psychological distress and
their confidence intervals by gender, age group and birth
cohort. Comparison of these confidence intervals indicates that the mean level of distress is statistically higher
in women than in men (for all age groups and birth cohorts), in younger than in older adults, and in more recent than in earliest birth cohorts. In both women and
men, the highest mean level of psychological distress is
found in the 18–29 age group. The level then decreases
steadily until reaching its minimum in the 60–69 age
Page 5 of 13
group, again increasing in older groups but without
reaching the mean level observed in young adults (20 to
39). The mean level of distress decreases steadily from
the most recent birth cohort to the 1930–1939 cohort
and increases slightly thereafter.
Growth curve analyses
Table 2 displays the estimated growth curve coefficients
for women. The null model indicates that most (62.1%)
of the variation of the longitudinal distribution of
psychological distress is explained by residual intraindividual variation. This residual variation is reduced by
11.6% with the addition of age variables in Model 2. The
estimated coefficient for age in this model indicates that
the mean level of psychological distress decreases by .03
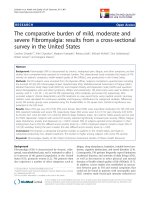
for each additional year of age among women. The estimated coefficient for age3 is statistically significant, thus
confirming the curvilinearity of the age distribution observed in Table 1 and illustrated in Figure 1.
The estimated coefficient for the interaction between
age and cohort (Model 4) indicates that the effect of
age on the distribution of psychological distress decreases by .007 for each additional birth cohort. The
ten-fold decrease in the estimated coefficient for age in
Model 5 compared to Model 4 (Model 4: βAge = −.04;
Model 5: βAge = −.004) suggests that employment status, marital status and educational level largely account for the effect of age observed in models 2 to 4.
Controlling for these variables also accentuates the
curvilinear nature of the age distribution (Model 4:
β3Age = .00001; Model 5: β3Age = .00002), the cohort effect (Model 4: βCohort = .19; Model 5: βCohort = .25) and
the age by cohort interaction (Model 4: βAge*Cohort = −.007;
Model 5: βAge*Cohort = −.009).
Table 3 presents the estimated growth curve coefficients for men. As is the case for women, the null model
shows that most of the variation in the longitudinal distribution of psychological distress is due to residual
intra-individual variation (63.2%). Adding age variables
in Model 2 reduces this residual variation by 9.9%. The
growth curve coefficients estimated in models 2 to 4 reveal both differences and similarities when compared
with the results for women.
On the one hand, unlike women, the estimated coefficient for age is not statistically significant in men. On
the other hand, akin to women, the statistically significant coefficient for age3 confirms the curvilinear distribution of psychological distress during adulthood and
the estimated coefficient for the interaction between age
and cohort indicates that the effect of age on the distribution of psychological distress decreases for each additional birth cohort (Model 4: βAge*Cohort = - .009). In
effect, the estimated growth curve coefficients in Model
4 are quite similar in women and men (except for the
Drapeau et al. BMC Psychology 2014, 2:25
/>
Page 6 of 13
Table 1 Mean level of psychological distress by age group and birth cohort
Birth cohort
Men (n = 7877)
Women (n = 9062)
Age group
Men (n = 7877)
Women (n = 9062)
1980 to 1995
3.21 (2.96 – 3.46)a
4.15 (3.85 – 4.46)
18 to 29
3.20 (3.05 – 3.35)
4.01 (3.84 – 4.19)
1970 to 1979
3.16 (2.97 – 3.35)
3.79 (3.60 – 3.98)
30 to 39
2.86 (2.71 – 3.01)
3.36 (3.22 – 3.51)
1960 to 1969
2.77 (2.63 – 2.91)
3.22 (3.08 – 3.36)
40 to 49
2.59 (2.45 – 2.73)
3.13 (2.99 – 3.26)
1950 to 1959
2.52 (2.38 – 2.67)
3.13 (2.99 – 3.28)
50 to 59
2.36 (2.22 – 2.50)
2.96 (2.81 – 3.12)
1940 to 1949
2.28 (2.14 – 2.42)
2.85 (2.69 – 3.01)
60 to 69
2.12 (1.96 – 2.29)
2.68 (2.51 – 2.85)
1930 to 1939
2.05 (1.87 – 2.23)
2.71 (2.54 – 2.88)
70 to 79
2.10 (1.88 – 2.32)
2.74 (2.55 – 2.93)
1920 to 1929
2.23 (2.00 – 2.47)
2.91 (2.68 – 3.14)
80 and older
2.48 (2.11 – 2.86)
3.16 (2.86 – 3.47)
1892 to 1919
2.39 (1.97 – 2.81)
3.11 (2.77 to 3.46)
a
Confidence intervals at the 0.95 level adjusted for the survey design effect.
direct effect of age in women). Finally, as is the case in
women, controlling for employment status, marital status and educational level (Model 5) increases the estimated coefficients for birth cohort and the interaction
between age and cohort in men.
In order to verify the potential impact of multiple imputation on the results, growth curve analyses were repeated using observed data (women = 52897; men =
42268). Table 4 compares the results of Model 4 based
on completed and observed data in women and men.
The estimated growth curve coefficients point in the
same direction in completed and observed data but they
are smaller in completed than in observed data. As a
consequence, three coefficients not statistically significant in completed data are significant in observed data
(women: age2; men: age and birth cohort). The percentage of residual intra-individual variance is slightly larger
in completed data (women: 50.5%; men: 53.1%) than in
observed data (women: 48.2%; men: 49.1%).
Post-hoc analyses
Post-hoc descriptive analyses and exploratory growth
curve analyses were conducted to clarify the effects that
employment status, marital status and educational level
had on the estimated coefficients for age and cohort. See
Additional file 1: Table S1A to S6A display the distribution of employment status, marital status and educational level and the mean level of distress for each
category of these variables by age group and gender.
These data show notable gender differences.
In women, the proportion of not employed is slightly
higher in the 18–29 age group (.27) over the course of
the NPHS than in the 30–49 age group (.22 to .25)
and it is highest in seniors (60 and older: .71 to .87)
(Additional file 1: Table S1A). Non-employment appears
to be a risk factor for psychological distress for women
aged 18 to 59 but a protective factor for those aged 70
and older (Additional file 1: Table S1A). As is the case
for women, the proportion of not employed in men is
slightly higher in the 18–29 age group (.24) than in the
30–49 age group (.15 to .22) and it is highest in seniors
(60–69: .54; 70 and older: .80 to .84) (Additional file 1:
Table S2A). Non-employment is a risk factor for psychological distress for men aged 18 to 59 but a protective
factor for those aged 80 and older (Additional file 1:
Table S2A) compared to 70 and older in women.
Being without a spouse is more frequent in the
youngest (18–29: .75) and oldest (80 and older: .80) age
group than in other adult women (30–79: .33 to .56)
(Additional file 1: Table S3A). It is a risk factor for psychological distress in all age groups except in seniors
aged 80 and over (Additional file 1: Table S3A). In men,
the proportion of individuals without spouse is also
highest in the youngest age group (18–29: .84) and lower
in other age groups (30 and older: .23 to .43). Unlike
women, it is a risk factor for psychological distress in all
age groups (Additional file 1: Table S4A).
The proportion of women with a high school diploma
or less is higher in the 18–29 age group (.68) than in the
30–59 age group (.56 to .63) and it is highest in seniors
(60 and older : .73 to .85) (Additional file 1: Table S5A).
A low level of education is a risk factor for psychological
distress in all age groups in women (Additional file 1:
Table S5A). The proportion of men with a high school
diploma or less is higher in the 18–29 age group (.74)
and in seniors (70 and older: .75 to .79) than in the 30–
69 age group (.55 to .66) (Additional file 1: Table S6A).
Contrary to women, a low educational level is a risk factor only in young men (18–39).
Findings from exploratory growth curve analyses in
women (Table 5) suggest that the substantial decline in
the estimated coefficient for age in Model 5 (β = −.004)
compared to Model 4 (β = −.04) may have been caused
by the interactions between age and employment status
and between age and marital status that were not taken
into account in Model 5. These statistically significant
interactions indicate that the effect of age on the distribution of psychological distress is lower in not employed
women than in employed, and in single, divorced, separated or widowed women than in those with a spouse.
The slight increase in the estimated coefficient for birth
cohort age in Model 5 (β = .19) compared to Model 4
Drapeau et al. BMC Psychology 2014, 2:25
/>
Page 7 of 13
Discussion
Effect of age and birth cohort on the distribution of
psychological distress
The main objective of this study was to examine the distribution of psychological distress during adulthood in
women and men. Findings from this study reveal minor
gender differences in the distribution of distress among
Canadian adults when age and birth cohort are examined
10
Psychological distress
(β = .25) appears to be attributable to the direct effect of
marital status and to the interaction of employment status and birth cohort. The estimated growth curve coefficient for this interaction indicates that the effect of birth
cohort on the distribution of distress is higher in not
employed women than in those employed (Table 5).
Findings from exploratory growth curve analyses in
men (Table 6) suggest that employment status, marital
status and education level, taken in combination rather
than individually, account for the two-fold increase in
the coefficient for birth cohort in Model 5 (β = .23) compared to Model 4 (β = .12). At first glance (Table 6 –
Model 5f ), this increase seems mostly attributable to the
interaction of marital status and birth cohort: the effect
of birth cohort on the distribution of psychological distress appears to be lower single, divorced, separated and
widowed men than in those with a spouse. However, this
interaction is no longer statistically significant when employment status and education are taken into account
(Model 5h).
8
6
Women
4
Men
2
0
20
25
30
35
40
45
50
55
60
65
70
75
80
85
90
Age
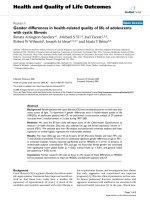
Figure 1 Predicted mean level of psychological distress
(Model 2: Age + Age2 + Age3).
jointly using growth curve analyses. In women, the
mean level of distress decreases steadily during adulthood beginning at age 18 and evidences a slight curvilinear distribution. In men, the mean level of psychological
distress seems to follow a bimodal distribution: it remains
relatively stable in the twenties and decreases steadily
thereafter before increasing after age 80. However, when
the interaction between age and cohort is taken into
account, the distribution of psychological distress during adulthood is quite similar in women and men. In
addition, the curvilinear or bimodal distribution observed in women and men is hardly noticeable since
Table 2 Estimates of growth curve coefficients – women (n = 9062)
Model 1
Model 2
Model 3
Model 4
Model 5
3.22***
4.04***
4.06***
3.93***
2.97***
-.03*
-.03*
-.04**
-.004
Age
-.0006
-.0006
.0002
-.0008
Age3
.00001**
.00001**
.00001**
.00002***
Fixed effects
Intercept
Age
2
Cohort
-.02
Cohort *Age
.19*
.25**
-.007**
-.009***
Not employed
.16**
Lower education
.21***
Without spouse
.54***
Random effects (variance)
Intercept (between)
4.51
Slope (between)
Residuals (within)
7.39
6.96
6.95
6.99
6.71
.004
.004
.004
.004
7.09
7.09
7.09
7.08
ICCa
Intercept (between)
.379
.495
.495
.496
.487
Residuals (within)
.621
.505
.505
.504
.513
*< .05; **< .01; ***< .001.
a
ICC: Intra-class correlation coefficient.
Drapeau et al. BMC Psychology 2014, 2:25
/>
Page 8 of 13
Table 3 Estimates of growth curve coefficients – men (n = 7877)
Model 1
Model 2
Model 3
Model 4
2.65***
Model 5
Fixed effects
Intercept
3.21***
3.35***
3.21***
2.29***
Age
-.007
-.001
-.014
.013
Age2
-.001**
-.001**
-.0002
-.0008
Age3
.00002***
.00002***
.00002***
.00002***
Cohort
-.14**
Cohort *Age
.12
.23**
-.009***
-.010***
Not employed
.22**
Lower education
.17***
Without spouse
49***.
Random effects (variance)
Intercept (between)
3.43
Slope (between)
Residuals (within)
5.89
4.94
4.94
4.94
4.93
.004
.004
.004
.004
5.63
5.63
5.63
5.63
ICCa
Intercept (between)
.368
.467
.467
.467
.467
Residuals (within)
.632
.533
.533
.533
.533
*< .05; **< .01; ***< .001.
a
ICC: Intra-class correlation coefficient.
the growth curve coefficients for quadratic age and
cubic age are very small.
Data regarding the shape of the age distribution for
psychological distress in adults are scarce and come almost exclusively from cross-sectional surveys (Jorm
et al. 2005; Schieman et al. 2001; Turcotte and Schellenberg
2007). The present study was based on a national longitudinal survey for which data were collected every two years
between 1994–1995 and 2010–2011 (9 waves). The sample
under study covered a broad age range (18 years old and
older) and spanned several birth cohorts (1892 to 1995).
These methodological features allowed conducting a more
in-depth investigation of the distribution of psychological
distress during adulthood than has been the case in
previous studies.
The cross-sectional studies conducted by Schieman
et al. (2001) and Turcotte and Schellenberg (2007) also
covered a broad age range and provided evidence bearing on the curvilinear distribution of psychological distress during adulthood. Schieman et al. (2001) targeted
Table 4 Estimates of growth curve by gender (completed vs. observed data)
Women
Men
Completed data
Observed data
Completed data
Observed data
(n = 69020)a
(n = 52897)
(n = 58302)
(n = 42268)
3.93***
3.90***
3.21***
3.15***
Fixed effects
Intercept
Age
-.04**
-.08***
-.014
-.07***
Age2
.0002
.0001***
-.0002
.0009
Age3
.00001**
.000003***
.00002***
.000003***
Cohort
.19*
.40***
.12
.38***
Cohort *Age
-.007**
-.008***
-.009***
-.009***
Between-person
.495
.518
.469
.509
Within-person
.505
.482
.531
.491
ICCb
*< .05; **< .01; ***< .001.
a
Number of observations.
b
ICC: Intra-class correlation coefficient.
Drapeau et al. BMC Psychology 2014, 2:25
/>
Page 9 of 13
Table 5 Exploratory analyses - estimates of growth curve coefficients – women (n = 9062)
Model 5a
Model 5b
Model 5c
Model 5d
Model 5e
Model 5f
Model 5 h
Intercept
3.86**
3.84***
3.51***
3.53**
3.40***
3.13***
2.69***
Age
-.04*
-.03*
-.03
-.02
-.02
.01
.02
Age2
-.0001
.0001
-.0003
-.0003
-.0004
-.0011*
-.0011*
Age3
.00001***
.00001***
.00001***
.00002***
.00002***
.00002***
.00002***
Fixed effects
Cohort
.21*
.20*
.16
.07
.25**
.21*
.25**
Cohort *Age
-.008*
-.012***
-.007**
-.007**
-.008**
-.008**
-.012***
Not employed
.15*
.23*
.21
Employment *Age
-.03***
-.03***
Employment *Cohort
.30**
Low education
.30**
.24***
.22**
Education *Age
-.006
Education *Cohort
.07
Without spouse
.20***
.83***
.83***
Marital status *Age
.55***
-.02**
-.02**
Marital status *Cohort
.10
Random effects (variance)
Intercept (between)
6.96
6.89
6.91
6.90
6.82
6.77
6.62
Slope (between)
.004
.004
.004
.004
.004
.004
.004
Residuals (within)
7.09
7.09
7.09
7.09
7.08
7.07
7.07
ICCa
Intercept (between)
.495
.493
.494
.493
.491
.489
.495
Residuals (within)
.505
.507
.506
.507
.509
.511
.505
*< .05; **< .01; ***< .001.
a
ICC: Intra-class correlation coefficient.
individuals aged 18–89 and grouped them into ten-year
age categories. They found that the mean level of distress was higher among young adults (18–29 years),
reached its lowest level in the 60–69 group, and then increased among those aged 70 and older. The study by
Turcotte and Schellenberg (2007) compared the health
of seniors and younger adults. It grouped respondents
into four age ranges: 25–54, 55–64, 65–74 and 75 and
older. Turcotte and Schellenberg (2007) observed a decline in the mean level of distress that bottomed out
with the 65–74 age group, then increased among respondents aged 75 and older. Findings from our study
generally agree with those of Schieman et al. (2001) and
Turcotte and Schellenberg (2007). But they also indicate
that the distribution of psychological distress may be
more bimodal than curvilinear among adult males.
Findings from our study also partly agree with the gender differences highlighted by Jorm et al. (2005). That
study examined the age distribution for psychological distress in Australians aged 20–24, 40–44 and 60–64. It
found that, among men, the mean level of distress was
similar in the younger age groups (20–24 and 40–44) and
lower in the oldest group (60–64). By contrast, distress
levels among women diminished steadily between 20 and
64. In the present study, the mean level of distress in
Canadian women was found to decrease steadily during
adulthood and to reach its lowest point in the 60–69 age
group, but among Canadian men the decrease was preceded by a plateau of high distress in the 18–29 age group.
The age range (20–64) of the sample investigated by Jorm
et al. (2005) was not large enough to reveal a putative increase in psychological distress in seniors as observed in
the present study.
Finally, findings from our study concur to some extent
with those of Sacker and Wiggins (2002) based on a
small age range (23–42) and two birth cohorts (1958
and 1970). Sacker and Wiggins (2002) found that the
rate of psychological distress was higher in the most recent cohort than in the earliest cohort. A similar cohort
effect on the distribution of psychological distress was
noticed in Canadian adults when the interaction between age and cohort was taken into account.
Several authors have hypothesized that the age distribution observed for psychological distress may be confounded
Drapeau et al. BMC Psychology 2014, 2:25
/>
Page 10 of 13
Table 6 Exploratory analyses - estimates of growth curve coefficients – men (n = 7877)
Model 5a
Model 5b
Model 5c
Model 5d
Model 5e
Model 5f
Model 5 h
Intercept
3.10***
3.05***
2.84***
2.74***
2.69***
2.59***
2.12***
Age
-.010
-.006
-.006
-.003
.002
-.001
.020
Age2
-.0003
-.0003
-.0004
-.0005
-.0005
-.0003
-.0010*
Age3
.00002***
.00002***
.00002***
.00002***
.00002***
.00002***
.00002***
Fixed effects
Cohort
.16
.17
.12
.15
.19*
.32***
.27**
Cohort *Age
-.011***
-.012***
-.002***
-.009***
-.010***
-.010***
-.012***
Not employed
.24***
.41**
.38**
Employment *Age
-.02*
-.01
Employment *Cohort
.17
Low education
.19***
.25**
Education *Age
-.0003
Education *Cohort
-.024
Without spouse
.16***
.50***
.62***
Marital status *Age
.02
Marital status *Cohort
-.20*
.63***
-.06
Random effects (variance)
Intercept (between)
4.96
4.93
4.95
4.95
4.93
4.93
4.91
Slope (between)
.004
.004
.004
.004
.004
.004
.004
Residuals (within)
5.62
5.62
5.62
5.62
5.62
5.62
5.61
ICCa
Intercept (between)
.469
.467
.468
.468
.467
.467
.467
Residuals (within)
.531
.533
.532
.532
.533
.533
.533
*< .05; **< .01; ***< .001.
a
ICC: Intra-class correlation coefficient.
by a cohort effect (Brault et al. 2011; Chiao et al. 2009;
Kasen et al. 2003; Jorm 2000; Lewinsohn et al. 1993;
Mirowsky and Kim 2007; Roberts et al. 1991; Sacker
and Wiggins 2002; Yang 2007). Thus, for instance,
young adults might express a higher mean level of distress than older adults not only because they are exposed to more risk factors or because they are more
vulnerable to those risk factors, but, at least partly, because they were born at a time when these factors were
more prevalent or potentially more harmful. In the
present study, the effect of age on the distribution of
psychological distress was not confounded by the effect
of cohort but it was moderated by the latter.
Effect of covariates on the age distribution of
psychological distress
Findings from this study show that controlling for employment status, marital status and educational level
produce a ten-fold decrease in the effect of age on the
distribution of psychological distress in women and a
two-fold increase in the effect that birth cohort has on
the distribution of distress in men. Exploratory growth
curve analyses suggest that, in women, the effect of age
is lower among the not employed and among individuals without spouses and the effect of cohort is higher
among the not employed. Among men, the effect of
age is also lower among the not employed; whereas the
effect of cohort is lower in individuals without spouses.
However, the interactions between age and employment status and between birth cohort and marital status are no longer statistically significant in men when
employment status, marital status and education are
taken into account together.
Several studies have shown that non-employment
(Marchand et al. 2012; Matthews et al. 2001; Talala et al.
2007; Walters et al. 2002), being without a spouse
(Marchand et al. 2012; Matthews et al. 2001; Talala et al.
2007) and low educational level (Mandemakers and
Monden 2010; Talala et al. 2007; Walters et al. 2002) are
associated with psychological distress. To our knowledge, no studies have compared the effect of these
variables on psychological distress in different age
groups. Findings from this study indicate that nonemployment may be a risk factor for women and men
Drapeau et al. BMC Psychology 2014, 2:25
/>
in the 18–59 age group but not in older adults. In contrast, low educational level tends to remain a risk factor in
all adulthood in women whereas, in men, its deleterious
effect is confined to the 18–39 age group. Additional
research is needed to better understand the complex
interplay between psychological distress and the contextual variation in non-employment, lack of a spouse
and low educational level during adulthood in women
and in men.
Page 11 of 13
Additional file
Additional file 1: Table S1A. Distribution of employment status and
mean level of distress by age group. Women (n = 9062; 69020
observations). Table S2A. Distribution of employment status and mean
level of distress by age group, Men (n = 7877; 58302 observations). Table
S3A. Distribution of marital status and mean level of distress by age group.
Women (n = 9062; 69020 observations). Table S4A. Distribution of marital
status and mean level of distress by age group Men (n = 7877; 58302
observations). Table S5A. Distribution of educational level and mean level
of distress by age group – Women (n = 9062; 69020 observations).
Table S6A. Distribution of educational level and mean level of distress
by age group – Men (n = 7877; 58302 observations).
Limitations
The main limitation of this study is the small number
of cohorts in each age group, especially at the extremities of the age distribution. The youngest (18–29) and
the oldest (80 and older) age group each cover three
birth cohorts whereas the other age groups each cover
four birth cohorts. A second limitation is that the interactions examined in exploratory growth curve analyses (i.e., age and birth cohort by employment status,
marital status and education) were not included in the
imputation model. Rubin (1987) and others recommend that all variables used in subsequent analyses be
part of the imputation model. Given that there are nine
waves of data collection in the NPHS and that multiple
imputation was performed on a wide-format file, these
interactions required the creation of 54 variables. The
addition of these variables to an imputation model that
already contains more than 100 variables could not be
managed by the ICE program. A third limitation is that
employment status, marital status and education were
each defined by a single variable. In consequence, it
cannot be determined which dimensions of these variables is responsible for the age, cohort and gender differences observed in the exploratory growth curve
analyses. Finally, as in other longitudinal studies that
span a long period, the birth cohort observed in this
study cannot be distinguished from a putative period
effect.
Conclusion
Age and gender are useful risk markers because they
shift the focus of epidemiological research and public
health programs towards risk and protective factors
that are more prevalent in certain age groups and in
women or men (World Health Organization 2005).
Findings from our study indicate that the risk of psychological distress, which is higher for younger adults
than for older adults and for women than for men in
all age groups, may be related to the changing features
of employment status, marital status and educational
level during adulthood. Additional research is needed
to identify which of these features have the highest
prevalence in younger adults, women and men.
Competing interests
The authors declare that they have no competing interests.
Authors’ contributions
AD designed the study, supervised the review of the literature, performed
statistical analyses, assumed leadership for the interpretation of findings and
wrote the manuscript. AM participated in statistical analyses and in the
interpretation of findings and reviewed the manuscript. CF conducted the
review of the literature and wrote a first draft of the background section.
All authors read and approved the final manuscript.
Acknowledgements
This study was supported by the Fonds de la recherche en santé du Québec
(ref. #14389) and was carried out while two of the authors (AD and AM)
were supported by researcher’ awards from the Fonds de la recherche en
santé du Québec.
Author details
1
Centre de recherche – Institut universitaire en santé mentale de Montréal,
7331 rue Hochelaga, H1N 3X6 Montreal, Canada. 2Département de
psychiatrie, Université de Montréal, Montréal, Canada. 3Département de
Médecine Sociale et Préventive, Université de Montréal, Montréal, Canada.
4
École de Relations Industrielles, Université de Montréal, C.P. 6128, succursale
Centre-ville, H3C 3 J7 Montréal, Canada. 5Institut de Recherche en Santé
Publique, Université de Montréal, Montréal, Canada. 6Département de
Médecine, Université de Montréal, Montréal, Canada.
Received: 11 February 2014 Accepted: 22 July 2014
Published: 9 August 2014
References
Baillie, AJ. (2005). Predictive gender and education bias in Kessler’s
psychological distress scale (K10). Social Psychiatry and Psychiatric
Epidemiology, 40, 743–748.
Benzeval, M, & Judge, K. (2001). Income and health: the time dimension. Social
Science and Medicine, 52, 1371–1390.
Brault, MC, Bart, M, & Bracke, P. (2011). Depressive symptoms in the Belgian
population: disentangling age and cohort effects. Social Psychiatry and
Psychiatric Epidemiology, 47, 903–915.
Caron, J, & Liu, A. (2011). Factors associated with psychological distress in the
Canadian population: a comparison of low-income and non low-income
sub-groups. Community Mental Health Journal, 47, 318–330.
Catlin, G, & Will, P. (1992). The national population health survey: highlights of
initial developments. Health Reports (Statistics Canada), 4, 313–319.
Chiao, C, Weng, LJ, & Botticello, A. (2009). Do older adults become more
depressed with age in Taiwan? The role of social position and birth
cohort. Journal of Epidemiology & Community Health, 63, 625–632.
Chittleborough, CR, Winefield, H, Gill, TK, Koster, C, & Taylor, AW. (2011). Age
differences in associations between psychological distress and chronic
conditions. International Journal of Public Health, 56, 71–80.
Collins, LM, Schafer, JL, & Kam, C-M. (2001). A comparison of inclusive and restrictive
strategies in modern missing data procedures. Psychological Methods,
6, 330–351.
Delorme, A, Breton, M, Bouchard, S, Deschênes, L, Hince, C, & Rhéaume, J. (2005).
Plan d’action en Santé Mentale 2005–2010. La Force des Liens. In Direction.
Drapeau et al. BMC Psychology 2014, 2:25
/>
de la Santé Mentale. Québec: Ministère de la Santé et des Services sociaux Gouvernement du Québec.
Drapeau, A, Beaulieu-Prévost, D, Marchand, A, Boyer, R, Préville, M, & Kairouz,
S. (2010). A life-course and time perspective on the construct validity of
psychological distress in women and men. Measurement invariance of
the K6 across gender. BMC Medical Research Methodology, 10(68) .
/>Drapeau, A, Marchand, A, & Beaulieu-Prévost, D. (2011). Epidemiology of
Psychological Distress. In Luciano L’abate (Ed.), Mental Illness.
Understanding, Prediction and Control (pp. 105–134). Croatia: InTech Open
Access Publisher.
Enders, CK. (2010). Applied Missing Data Analysis. New York: Guilford Press.
Furukawa, TA, Kessler, RC, Slade, T, & Andrews, G. (2003). The performance of
the K6 and K10 screening scales for psychological distress in the Australian
National Survey of Mental Health and Well-Being. Psychological Medicine,
33, 357–362.
Gispert, R, Rajmil, L, Schiaffino, A, & Herdman, M. (2003). Sociodemographic and
health-related correlates of psychiatric distress in a general population. Social
Psychiatry and Psychiatric Epidemiology, 38, 677–683.
Graham, JW, Olchowski, AE, & Gilreath, TD. (2007). How many imputations are
really needed? Some practical clarifications of multiple imputation theory.
Prevention Research, 8, 206–213.
Gudmundsdottir, G, & Vilhjalmsson, R. (2010). Group differences in
outpatient help-seeking for psychological distress: results from a
national prospective study of Icelanders. Scandinavian Journal of Public
Health, 38, 160–167.
Herman, H, Saxena, S, & Moodie, R. (2005). Promoting Mental Health: Concepts,
Emerging Evidence, Practice. In World Health Organization (Ed.), Department
of Mental Health and Substance Abuse in collaboration with the Victorian
Health Promotion Foundation and the University of Melbourne. Genève
(Suisse): World Health Organization.
Jorm, AF. (2000). Does old age reduce the risk of anxiety and depression? A
review of epidemiological studies across the adult life span. Psychological
Medicine, 30, 11–22.
Jorm, AF, Windsor, TD, Dear, KBG, Anstey, KJ, Christensen, H, & Rodgers, B. (2005).
Age group differences in psychological distress: the role of psychosocial risk
factors that vary with age. Psychlogical Medicine, 35, 1253–1263.
Kasen, S, Cohen, P, Chen, H, & Castille, D. (2003). Depression in adult women: age
changes and cohort effects. American Journal of Public Health,
93, 2061–2066.
Kessler, RC, Foster, C, Webster, S, & House, JS. (1992). The relationship between
age and depressive symptoms in two national surveys. Psychology and Aging,
7, 119–126.
Kessler, RC, Andrews, G, Colpe, LJ, Hiripi, E, Mroczek, D, Normand, S-LT, Walters,
EE, & Zaslavsky, AM. (2002). Short screening scales to monitor population
prevalences and trends in non-specific psychological distress. Psychological
Medicine, 32, 959–976.
Kessler, RC, Barker, PR, Colpe, LJ, Epstein, JF, Gfroerer, JC, Hipipi, E, Howes, MJ,
Normand, SLT, Manderschied, RW, Walters, EE, & Zaslavsky, AM. (2003).
Screening for serious mental illness in the general population. Archives of
General Psychiatry, 60, 184–189.
Knapp, M, McDaid, D, Mossialos, E, & Thornicroft, G. (2007). Mental Health Policy
and Practice Across Europe. The Future Direction of Mental Health Care. United
Kingdom: European Observatory On Health Systems And Policies Series.
Koopmans, GT, Donker, MCH, & Rutten, FHH. (2005). Common mental disorders and
use of general health services: a review of the literature on population-based
studies. Acta Psychiatrica Scandinavica, 111, 341–350.
Langlois, KA, & Garner, R. (2013). Trajectoires de la détresse psychologique au
Canada chez les adultes ayant été exposés à une dépendance parentale
dans leur enfance. Rapports sur la santé - Statistique Canda, 24, 15–23.
Levecque, K, Lodewyckx, I, & Bracke, P. (2009). Psychological distress, depression
and generalised anxiety in Turkish and Moroccan immigrants in Belgium: a
general population study. Social Psychiatry and Psychiatric Epidemiology,
44, 188–197.
Lewinsohn, PM, Rohde, P, Seeley, JR, & Fischer, SA. (1993). Age-cohort changes in
the lifetime occurence of depression and other mental disorders. Journal of
Abnormal Psychology, 102, 110–120.
Lin, M-T, Burgess, JF, & Carey, K. (2012). The association between serious
psychological distress and emergency department utilization among
young adults in the USA. Social Psychiatry and Psychiatric Epidemiology,
47, 939–947.
Page 12 of 13
Mandemakers, JJ, & Monden, CW. (2010). Does education buffer the impact of
disability on psychological distress? Social Science and Medicine, 71, 288–297.
Marchand, A, Drapeau, A, & Beaulieu-Prévost, D. (2012). Psychological distress in
Canada: the role of employment and reasons for non-employment.
International Journal of Social Psychiatry, 58, 596–604.
Matthews, S, Power, C, & Stansfeld, SA. (2001). Psychological distress and work
and home roles: a focus on socio-economic differences in distress.
Psychological Medicine, 31, 725–736.
Mirowsky, M, & Kim, J. (2007). Graphing age trajectories. Vector graphs, synthetic
and virtual cohort projections, and cross-sectional profiles of depression.
Sociological Methods & Research, 35, 497–541.
Mirowsky, J, & Ross, CE. (2002). Measurement for a social science. Journal of
Health and Social Behavior, 43, 152–170.
Organisation mondiale de la santé. (2006). Classification Statistique Internationale
des Maladies et Problèmes de Santé Connexes - Dixième Révision. Genève
(Suisse): Organisation mondiale de la santé.
Phillips, MR. (2009). Is distress a symptom of mental disorders, a marker of
impairment, both or neither? World Psychiatry, 8, 91–92.
Phongsavan, P, Chey, T, Bauman, A, Brooks, R, & Silove, D. (2006). Social capital,
socio-economic status and psychological distress among Australian adults.
Social Science and Medicine, 63, 2546–2561.
Rabe-Hesketh, S, & Skrondal, A. (2012). Multilevel and Longitudinal Modeling Using
Stata. Volume 1: Continuous Responses (3rd ed.). Texas (USA): Stata Press.
Roberts, RE, Lee, ES, & Roberts, CR. (1991). Changes in prevalence of depressive
symptoms in Alameda county. Age, period, and cohort trends. Journal of
Aging and Health, 3, 66–86.
Royston, P. (2007). Multiple imputation of missing values: further update of ICE,
with an emphasis on interval censoring. Stata Journal, 7, 445–464.
Royston, P, & White, IR. (2011). Multiple imputation by chained equations (MICE):
implementation in stata. Journal of Statistical Software, 45, 1–20.
Rubin, DB. (1987). Multiple Imputation for Nonresponse in Surveys. New-York: John
Wiley & Sons Inc.
Rubin, DB. (1996). Multiple imputation after 18+ years. Journal of the American
Statistical Association, 91, 473–489.
Sacker, A, & Wiggins, RD. (2002). Age-period-effect on inequalities in psychological distress, 1981–2000. Psychological Medicine, 32, 977–990.
Sakurai, K, Kawakami, N, Yamaoka, K, Ishikawa, H, & Hashimoto, H. (2010).
The impact of subjective and objective social status on psychological
distress among men and women in Japan. Social Science and Medicine,
70, 1832–1829.
Schafer, JL, & Graham, JW. (2002). Missing data: Our view of the state of the art.
Psychological Methods, 7, 147–177.
Schieman, S, Van Gundy, K, & Taylor, J. (2001). Status, role, and resource
explanations for age patterns in psychological distress. Journal of Health and
Social Behavior, 42, 80–96.
Statistique Canada. (2013). Tableau 051-0042 - Estimations de la population selon
l'état matrimonial ou l'état matrimonial légal, l'âge et le sexe au 1er juillet
2011. CANSIM. />Statistique Canada. (2011). Tableau 282–0209 - Enquête sur la population active
(EPA), estimations selon le diplôme scolaire, le sexe et le groupe d’âge,
annuel (personnes sauf indication contraire). CANSIM. .
ca/cansim/home-accueil?lang=fr.
Statistique Canada. (2012). Tableau 282–0003 - Enquête sur la population active
(EPA), estimations selon le niveau de scolarité atteint, le sexe et le groupe
d’âge, non désaisonnalisées. CANSIM. />home-accueil?lang=fr.
Susser, E, Schwartz, S, Morabia, A, & Bromet, EJ. (2006). Psychiatric Epidemiology:
Searching for the Causes of Mental Disorders (Oxford Psychiatry Series). Oxford:
Oxford University Press.
Svensson, E, Nyagard, JF, Sorensen, T, & Sandanger, I. (2009). Changes in formal
help seeking for psychological distress: the Oslof study. Nordic Journal of
Psychiatry, 63, 260–266.
Talala, K, Huurre, T, Aro, H, Martelin, T, & Prattala, R. (2007). Socio-demographic
differences in self-reported psychological distress among 25- to 64-year-old
Finns. Social Indicators Research, 86, 323–335.
Tambay, JL, & Catlin, G. (1995). Sample design of the National population health
survey. Health Reports (Statistics Canada), 7, 1–11.
Turcotte, M, & Schellenberg, G. (2007). A Portrait of Seniors in Canada. In Social
and Aboriginal Statistics Division. Ottawa: Statistics Canada.
Walters, V, McDonough, P, & Strohschein, L. (2002). The influence of work,
household structure, and social, personal and material resources on gender
Drapeau et al. BMC Psychology 2014, 2:25
/>
Page 13 of 13
differences in health: an analysis of the 1994 Canadian National Population
Health Survey. Social Science and Medicine, 54, 677–692.
World Health Organization. (2005). Promoting Mental Health. Concepts. In
SSH Herrman & R Moodie (Eds.), Emerging Evidence. Practice. Geneva
(Suisse): World Health Organization - Department of Mental Health and
Substance Abuse.
Yang, Y. (2007). Is old age depressing? Growth trajectories and cohort
variations in late-life depression. Journal of Health and Social Behavior,
48, 16–32.
doi:10.1186/s40359-014-0025-4
Cite this article as: Drapeau et al.: Gender differences in the age-cohort
distribution of psychological distress in Canadian adults: findings from a
national longitudinal survey. BMC Psychology 2014 2:25.
Submit your next manuscript to BioMed Central
and take full advantage of:
• Convenient online submission
• Thorough peer review
• No space constraints or color figure charges
• Immediate publication on acceptance
• Inclusion in PubMed, CAS, Scopus and Google Scholar
• Research which is freely available for redistribution
Submit your manuscript at
www.biomedcentral.com/submit